
Eliminating
Friction in
Fashion Path
to Purchase

© 2018 KPMG, an Indian Registered Partnership and a member firm of the KPMG network of independent member firms affiliated with KPMG International Cooperative (“KPMG International”), a Swiss entity. All rights reserved.
2
The content herein is based on the primary survey carried out and consequent data provided by Nielsen India on behalf of Facebook India Online Services
Private Limited (“Primary Data”), which has been relied upon while conducting the secondary survey by [KPMG in India] (“KPMG”). KPMG has also
referred to information from public domain and other secondary sources in conducting secondary survey (“Secondary Data”). KPMG has not verified or
investigated Primary Data or Secondary Data and assumes no responsibility for the veracity, accuracy and completeness of such information and will not
be held liable for it under any circumstances. KPMG accordingly disclaims all responsibility and liability for use of such Primary Data or Secondary Data,
including disclaims any warranty for accuracy, veracity, completeness or non-infringement.
The information contained herein is of a general nature and is not intended to address the circumstances of any particular individual or entity. No one
should act on such information without appropriate professional advice after a thorough examination of the particular situation.
In connection with the report or any part thereof, KPMG does not owe duty of care (whether in contract or in tort or under statute or otherwise) to any
person or party to whom the report is circulated to and KPMG shall not be liable to any party who uses or relies on this report. KPMG thus disclaims all
responsibility or liability for any costs, claims, damages, losses, liabilities, expenses incurred by such third party arising out of or in connection with the
report or any part thereof including for any acts of commission or omission therein, howsoever caused.
Although we have attempted to provide correct and timely information, there can be no guarantee that such information is correct as of the date it is
received or that it will continue to be correct in the future.
Use of companies’ names in the report is only to exemplify the trends in the industry. We maintain our independence from such entities and no bias is
intended towards any of them in the report.
The report may make reference to ‘KPMG Analysis’; this merely indicates that we have (where specified) undertaken certain analytical activities on the
underlying data to arrive at the information presented; we do not accept responsibility for the veracity of the underlying data.
The views and opinions expressed herein are those of the interviewees, survey respondents and do not necessarily represent the views and opinions of
KPMG in India.
This study is commissioned by Facebook. Zero Friction Future is intellectual property of Facebook and cannot be used without prior consent.
By reading this report, the reader of the report shall be deemed to have accepted the terms mentioned hereinabove.
Disclaimers
© 2018 KPMG, an Indian Registered Partnership and a member firm of the KPMG network of independent member firms affiliated with KPMG International Cooperative (“KPMG International”), a Swiss entity. All rights reserved.
3
Friction
Decoded -
Scope of
Opportunity
Friction Mapping -
Understanding
Friction
Zero Friction
Future -
Reimagining
The Purchase
Journey
* Friction to be explained in the forthcoming chapters
Executive
Summary
01
02
03
Friction Busting -
Increasing
Sales Opportunity
With Mobile
04
05

© 2018 KPMG, an Indian Registered Partnership and a member firm of the KPMG network of independent member firms affiliated with KPMG International Cooperative (“KPMG International”), a Swiss entity. All rights reserved.
4
Executive summary
Sources:
[1] Apparel and Footwear in India, Euromonitor, February 2018; Apparel Accessories in India, Euromonitor, February 2018
[2] India Internet Opportunity, Kalaari Capital Advisors, May 2017
*Apparel includes – Clothing for men, women, children and sportswear
**Fashion accessories include – Footwear, Apparel accessories, jewelry, watches and bags
#
This number can be achieved by reducing the friction, thus increasing the addressable market opportunity
India has emerged as one of the world’s fastest-
growing fashion markets over the past few years. It
is projected to grow at 15 per cent CAGR till 2022
and become a USD102 billion market* for apparel
and a USD155 billion market**
[1]
for fashion
accessories.
The growing penetration of the internet, social media
and e-commerce is now providing the consumers in
tier 2 and below cities increased access to brands
and products. New operating models such as omni-
channel and assisted e-commerce could further fuel
growth and adoption of online commerce. E-tail
today contributes 2 per cent of total retail
[2]
, and is
expected to capture a larger chunk of both organised
and unorganised retail in near future. In such an
evolving and competitive market, it becomes critical
to understand consumer expectations from media
touch-points during the purchase journey.
In this report, we aim to understand the reasons that
lead to dropouts in the path to purchase of apparel
and fashion accessories, referred to as ‘friction’,
which may lead to potential loss of revenue for the
brands.
With reduced attention span, increased connectivity
and acceptance of new technology, consumers are
demanding everything with limited effort at a click of
a button and any change in the expectation can
cause them to abandon the purchase journey. To
understand the path to purchase and friction at
different stages of the purchase journey, a random
listing study was conducted by Nielsen India on
3,000 respondents to understand the proportion of
the population that falls at each stage of the journey,
and a further deep-dive study was conducted among
1,025 respondents in the fashion category across
varied demographic and socio-economic groups.
KPMG in India also interacted with industry experts
to obtain their perspective on the possible solutions
to eliminate friction and improve conversion rates.
Our research indicates that
• In the apparel category, 19 per cent of
consumers drop out due to friction, and more
than two-thirds of this friction is caused by the
media
• In the fashion accessories category, 22 per cent
of consumers drop out due to friction, and around
two-thirds of this friction is caused by media
• Mobile platforms are expected to influence more
than two-thirds of both apparel and fashion
accessories purchases by 2022
• Facebook is expected to influence more than half
of mobile-influenced purchases for both apparel
and fashion accessories by 2022
• Mobile-enabled purchase journeys of apparel are
14 per cent shorter than offline journeys
• Mobile-enabled purchase journeys of fashion
accessories are 25 per cent shorter than offline
journeys
• Mobile could help apparel brands to tap into
potential sales opportunity of ~USD5 billion
#
by
reducing media friction
• Mobile could help fashion accessory brands to
tap into potential sales opportunity of ~USD9
billion
#
by reducing media friction
© 2018 KPMG, an Indian Registered Partnership and a member firm of the KPMG network of independent member firms affiliated with KPMG International Cooperative (“KPMG International”), a Swiss entity. All rights reserved.

© 2018 KPMG, an Indian Registered Partnership and a member firm of the KPMG network of independent member firms affiliated with KPMG International Cooperative (“KPMG International”), a Swiss entity. All rights reserved.
5
© 2018 KPMG, an Indian Registered Partnership and a member firm of the KPMG network of independent member firms affiliated with KPMG International Cooperative (“KPMG International”), a Swiss entity. All rights reserved.

© 2018 KPMG, an Indian Registered Partnership and a member firm of the KPMG network of independent member firms affiliated with KPMG International Cooperative (“KPMG International”), a Swiss entity. All rights reserved.
6
Consumption in India is undergoing a gradual, yet tectonic shift. Consumer expenditure in India is expected to grow at 12 per cent year-on-year till 2022
[1]
, driving the
consumption of the growing urban population, two-thirds of which lives in 400+ tier 2 and below cities
[2].
Therefore, aspirational demand for branded products from these new
geographies is expected to surge over the next few years. Reaching these consumers through traditional brick-and-mortar route forces the brands to incur heavy capital
investments. Further, with growing access to digital content, consumers today are increasingly updated with the latest fashion trends. Online shopping options and virtual
showrooms are already revolutionising consumers’ shopping journey. In order to tap the emerging opportunities, organisations are deploying unique strategies to penetrate
new markets and differentiate their offerings.
Trends shaping the Indian fashion industry
Rise of content-based commerce
[3]
Emergence of assisted commerce
[3]
Evolving fashion trends of Indian consumers
[4]
Omni-channel for balancing consumers’ expectations
Brands have realised the power of social media and are increasingly leveraging
these platforms that support interactions among users, encourage their
contribution and provide advocacy from influencers. High engagement purchase
categories have found stronger merit in social commerce as it accentuates trust,
referrals and connects with a relatable community.
Micro-targeting by brands through online-only strategy
[3]
Traditional brick-and-mortar brands are adopting digital channels for engaging
with and selling to Indian consumers while defending their competitive
positioning.
Building online brands is helping companies to not only reach a wider
audience, but also test the market before committing to a large-scale
investment.
With similar objectives, established global brands, such as Under Armour,
Bjorn Borg and Replay, are entering India through online-only routes to cater
to their target consumers at minimal investments.
Business models that leverage the existing physical retail network of local
merchants or kiraana stores have emerged to penetrate the 67 per cent of
population that is either not connected to the internet, or have no means to
access aspirational products that do not reach them due to logistical challenges.
Both traditional and internet businesses can adopt such strategies to tap into the
less-penetrated markets of today, and lock these potential consumers to their
brand(s) for tomorrow.
While online platforms allow convenience, information and assortment,
traditional retail allows touch-and-feel and comfort of face-to-face interaction with
brand or store representative.
However, brands — both e-commerce and traditional – have realised the power
of integrating the two channels. Omni-channel is now observed as not only the
means to win consumers, but also the path to higher profitability.
The fashion spectrum in India is evolving where the affluent wants the latest to
keep up with fashion trends, and the masses look for more aspirational
products that offer value for money.
Secondly, the growing propensity of Indian consumers towards fast-fashion is
allowing the brands and retailers to sell their products year-round.
Thirdly, custom-fit apparel have begun gaining popularity again, and premium
brands are targeting niche customers with both made-to-measure and bespoke
fit offerings.
Indian language internet users to drive next wave of growth
India is expected to see a four-fold growth in the number of Indian language e-
tailing users between 2016 (42 million) and 2021 (165 million). By 2021, the
number of Hindi internet users is expected to be more than English users
[3]
.
E-tailers could realise their next big growth-wave by targeting these vernacular
language internet users by creating local content and engaging with them in
the language of their choice.
Sources:
[1] Economies and Consumers Annual Data, Euromonitor, July 2018
[2] India Internet Opportunity, Kalaari Capital Advisory, May 2017
[3] #India Trends 2018: Trends Shaping Digital India, KPMG-YourStory-NASSCOM-Kalaari Report, May 2018
[4] Seven consumption trends that will define the future of Indian apparel industry, Wazir Advisors, 2016

© 2018 KPMG, an Indian Registered Partnership and a member firm of the KPMG network of independent member firms affiliated with KPMG International Cooperative (“KPMG International”), a Swiss entity. All rights reserved.
7
Understanding the varied dimensions of today’s fashion consumer
My attention
My motivation
My connection
My watch
My wallet
Motivational
characteristics
that drive behaviours
and expectations
How consumers balance
constraints of time and
how they change across
life events
The ways consumers
direct their attention
and focus
How consumers connect
to devices, information
and each other
How consumers adjust
their share of wallet
across life events
Understanding the fashion consumer through 5Mys framework
Source:
Me, my life, my wallet report, KPMG International, 2017
• Brand community events
and support
• Word of mouth online via
fashion blogs
• On-demand availability
of apparel/fashion
accessories (rent/custom
made)
• Referrals from friends
and family
• Peer reviews and
suggestions
• Aspirational vs. functional
apparel/fashion
accessories – ones for
‘my need’ and for ‘my
wallet’
• Off-season sale/discount
• Bundled offers on fashion
accessories and apparel
• Rental options for luxury
apparel or fashion
accessories
• Channel specific
discounts
• Targeted communication
• Relevant information
• Channel and media of
choice
• Customised offers
and(or) payment modes
• Popular trends or fashion
fads
• Customised season-
specific offers
• Occasion-based needs,
e.g., festivals, weddings,
celebrations
• Fashion as a status
symbol
• Celebrity endorsements
• Seasonal preferences e.g.
linen clothes during
summers
• Functional purchases
such as sportswear, gym-
wear, etc.
• Emotion based purchase
e.g. eco-friendly or
organically made clothes
• Fast access to new
designs and styles
• Innovative models such
as ‘Buy Online, Pickup In
Store’
• Home pick-up in case of
replacement and delivery
• Eliminating wait time
using virtual changing
rooms
• Content for consumer
stickiness with brand(s)
Wallet-shareMind-share Time-share

© 2018 KPMG, an Indian Registered Partnership and a member firm of the KPMG network of independent member firms affiliated with KPMG International Cooperative (“KPMG International”), a Swiss entity. All rights reserved.
8
Friction Decoded -
Scope of Opportunity
© 2018 KPMG, an Indian Registered Partnership and a member firm of the KPMG network of independent member firms affiliated with KPMG International Cooperative (“KPMG International”), a Swiss entity. All rights reserved.

© 2018 KPMG, an Indian Registered Partnership and a member firm of the KPMG network of independent member firms affiliated with KPMG International Cooperative (“KPMG International”), a Swiss entity. All rights reserved.
9
© 2018 KPMG, an Indian Registered Partnership and a member firm of the KPMG network of independent member firms affiliated with KPMG International Cooperative (“KPMG International”), a Swiss entity. All rights reserved.

© 2018 KPMG, an Indian Registered Partnership and a member firm of the KPMG network of independent member firms affiliated with KPMG International Cooperative (“KPMG International”), a Swiss entity. All rights reserved.
10
Understanding and defining friction
The traditional path to purchase is undergoing transformation
with the advent of technology, smartphones and digital
assistants, and is expected to be replaced by personalised
journeys.
Today’s consumer expects and demands convenience, speed,
automation and simplicity that weren’t possible a few years
ago. Any unnecessary additional effort, incremental step or
inconvenience that leads the consumers to abandon their
purchase journey is defined as ‘friction’.
Friction may occur offline or online, and includes subjecting
consumers to unnecessarily wait, queue, click, type, tap, add
information or fill in forms. On their journey, they may also have
to load, buffer, switch channels/windows or hold for service. It
can hinder efficiency, impact consumer experience and in turn,
the consumer purchase journey. Any friction that is primarily
caused by a media touch-point is defined as ‘Media friction’.
Research shows that consumer pain points that lead to friction
can occur across three main stages of the consumer journey:
awareness, consideration and intent as listed below.
Businesses may be offering friction unknowingly, hindering
efficiency and in turn, the consumer journey.
• Awareness Friction: Every touchpoint or missing
touchpoint that requires the consumers to make any effort
to discover a brand
• Consideration Friction:: Every touchpoint or missing
touchpoint that requires the consumers to make any effort
to consider a brand
• Intent Friction:: Every touchpoint or missing touchpoint
that requires the consumers to make any effort to purchase
a brand
Awareness
Consideration
Intent
Purchase
Discovering the
product and identifying
the need
Gathering information and
decision-making
parameters to narrow the
consideration set
Displaying realistic intention to
purchase and understanding the
purchase process
Completing the transaction
Buyer
Post
Purchase
Consideration
friction
Intent friction
First time purchaser
of a fashion product
Repeat purchaser of
a fashion product
Potential buyer
Path-to-purchase (P2P)
Awareness
friction

© 2018 KPMG, an Indian Registered Partnership and a member firm of the KPMG network of independent member firms affiliated with KPMG International Cooperative (“KPMG International”), a Swiss entity. All rights reserved.
11
Awareness
Consideration
Intent
Purchase
Post
Purchase
Discover models,
brands and
categories
Research trends on
social media, vlogs,
blogs, magazines,
etc.
Compare styles/brands
on different portals or
websites
Seek
opinions
Visit
showroom
Seek expert
views
Visit brand
website/e-
commerce
portal or
app
Check for payment
options
Make a
purchase
Recommend/
review
Contact
customer
service/
customer care
for exchange or
replacement
• The ad content does not appeal to the consumer, or a potentially ‘good’ ad
content displayed at a time that caused ‘inconvenience’ to the consumer
• The consumer is targeted with an ad that is not relevant to him/her
• Ad content is not appealing in terms of design/colour/graphics or offer
negative reviews or coverage about the item or brand in media and(or)
other channels
• Desired brand or style is out-of-stock at the beginning of the purchase
journey itself
• The prospects learns about hidden terms and conditions on offers
communicated in advertisements
An apparel/fashion accessories buyer’s friction areas
Fashion needs identified –
Utilitarian (Use based) or
Hedonic (Pleasure/Status)
Check for fit and size
variations
• Opinion of peers differ from the prospect’s perception
• Limited community or influencer view on the selected item
• Showroom of the shortlisted brand is not in vicinity of the prospect
• The required size/colour is not available in the store/portal
• Sales representative is not able to assist the prospect
• The apparel’s look and feel does not match expectations from
advertisements across media channels
• Consumers not sure how the apparel or fashion accessories fit them, since
catalogue displays only attractive models
• Consumer travels long distance at the cost of his/her daily schedule to
visit the store
• No arrangement for alteration of the product
• Sales representative fails to provide information to the consumer for
size/colour/material
• Experience at the showroom was not pleasant or up to the consumer’s
expectations
• Competing brand provided a better offer
• Preferred payment options are not available
• Product delivered differs from what was displayed on the online catalogue
Decoding a fashion buyer’s journey and friction across purchase stages

© 2018 KPMG, an Indian Registered Partnership and a member firm of the KPMG network of independent member firms affiliated with KPMG International Cooperative (“KPMG International”), a Swiss entity. All rights reserved.
12
Media friction accounts for more than two-thirds of total friction in the
apparel purchase journey
• 'Deep Dive is only among 86 per cent of the population who are Aware Decision
Makers for Apparel and Accessories categories each
• At intent stage, only retail store and online touch-points were evaluated in media
mix to calculate friction
• Apparel Buyers – Aware Decision Makers who have purchased or tried to purchase a
clothing apparel in the last 3 months
• Apparel Considerers – Aware Decision Makers who have considered purchase of a clothing
apparel in the last 3 months but have yet not purchased
• Apparel Aware Non-considerers – Aware Decision Makers who have not considered
purchase of a clothing apparel in the last 3 months
In a highly penetrated apparel market, nearly one out of five buyers abandon the purchase during some stage of the purchase journey. Such dropout could be on account
of unavailability of desired product, hidden charges, compulsory registration, stock-out or any other dissatisfaction caused by media touch-point(s).
More than a two-thirds of friction loss is driven by dissatisfaction with media touch-point(s) across the purchase journey. Friction is observed the most at the final stage of
the journey, where highest media friction is experienced. Despite heavy focus of leading e-commerce platforms on bottom of the pyramid oriented marketing campaigns
[1]
,
media friction remains highest (8 per cent) at intent stage.
Source:
[1] How e-commerce companies make you spend more, YourStory, April 2017
3%
10%
19%
Media
friction
2%
8%
2%
12%
Total
friction
Consumers who are unaware of the category, or are
not primary decision makers/influencers
Awareness
friction
Aware decision
makers & influencers
Consideration
Intent
86%
77%
Purchase
Consideration
friction
Intent
friction
80%
67%
Total population – 100%
=
=
14%
Base = 547
Apparel
6%

© 2018 KPMG, an Indian Registered Partnership and a member firm of the KPMG network of independent member firms affiliated with KPMG International Cooperative (“KPMG International”), a Swiss entity. All rights reserved.
13
• 'Deep Dive is only among 86 per cent of the population who are Aware Decision Makers
for Apparel and Accessories categories each
• At intent stage, only retail store and online touch-points were evaluated in media mix to
calculate friction
• Accessories Buyers – Aware Decision Makers who have purchased or tried to purchase a
male and(or) female fashion accessories in the last 3 months
• Accessories Considerers – Aware Decision Makers who have considered purchase of a
male and(or) female fashion accessories in the last 3 months but have yet not purchased
• Accessories Aware Non-considerers – Aware Decision Makers who have not considered
purchase of a male and(or) female fashion accessories in the last 3 months
Base = 478
Fashion accessories is a high-engagement category, where consumers seek to evaluate how watches, jewelry or footwear look or fit in terms of size, and style or design.
Despite this, nearly half of the total friction loss is observed at the intent stage, where consumers evaluate last minute offers and prices. Also, campaigns by the brands
targeted at creating awareness at top of the funnel drive consumers towards the brand at the point of sale. Further, contribution of media to friction is 80 per cent at intent
stage and nearly half at the top of the funnel. Brand building content and advocacy can plug friction at top of the funnel, while improved efficiency in media and point of sale
is needed to close the larger gap of intent stage friction.
Media friction accounts for 60 per cent of total friction in the fashion
accessories purchase journey
4%
8%
10%
Media
friction
3%
8%
2%
22% 13%
Total
friction
Consumers who are unaware of the category, or
are not primary decision makers
Awareness
friction
Consideration
Intent
Purchase
Consideration
friction
Intent
friction
78%
74%
64%
Total population – 100%
=
=
14%
Accessories
Aware decision
makers & influencers
86%

© 2018 KPMG, an Indian Registered Partnership and a member firm of the KPMG network of independent member firms affiliated with KPMG International Cooperative (“KPMG International”), a Swiss entity. All rights reserved.
14
Apparel
Mobile could help apparel brands to tap into potential sales opportunity
of approximately USD5 billion by reducing media friction
Media friction can impact marketing ROI and significantly hit a brand’s bottom line. The loss of even a single prospect can add to revenue loss, more so in case of luxury or
high-end fashion market. Each and every sale counts, and according to this study mobile has the potential to reduce media friction by 3 percentage points, creating a sales
opportunity of about USD5 billion between apparel brands
[1][2]
. Based on this study, currently, nearly half of apparel purchases are influenced by mobile, and by 2022, nearly
two out of three apparel purchases would be influenced by mobile. In addition, the reduction in media friction could accelerate the growth in fashion e-commerce. Hence, it
becomes imperative for marketers to strengthen their media mix by enhancing marketing activities on mobile.
Media friction
observed in
purchase journey
12%
Estimated media
friction in
purchase journey
~9%
By reducing media friction with mobile, apparel brands can tap into a
~USD5 billion* opportunity
Note: Potential opportunity estimated by KPMG India is based on the potential reduction in consumer dropout. Modelling for reduction in
dropouts is based on the potential friction reduction, which may get impacted due to the usage of mobile-based media.
*This number can be achieved by reducing the friction, thus increasing the addressable market opportunity
Source:
[1] Apparel and Footwear in India, Euromonitor, February 2018
[2] KPMG in India's analysis, 2018 based on data obtained from multiple industry reports and primary survey conducted by Nielsen, 2018
2017
2022
e
Enhancing mobile in
media mix

© 2018 KPMG, an Indian Registered Partnership and a member firm of the KPMG network of independent member firms affiliated with KPMG International Cooperative (“KPMG International”), a Swiss entity. All rights reserved.
15
Accessories
Mobile could help accessories brands tap into potential sales
opportunity of approximately USD9 billion by reducing media friction
Mobile has the ability to reduce media friction, and by enhancing mobile in the media mix, brands can improve the conversion rate. Mobile not only helps add additional
revenue, but also enhances the customer experience leading to more satisfied consumers. In case of fashion accessories, mobile can reduce media friction by nearly 4
percentage points, creating a sales opportunity of about USD9 billion between the fashion accessories brands
[1][2]
. Currently, more than half of fashion accessories
purchases are influenced by mobile, and by 2022, more than 70 per cent of such purchases would be influenced by mobile.
Media friction
observed in
purchase journey
13%
Estimated media
friction in
purchase journey
~9%
Note: Potential opportunity estimated by KPMG India is based on the potential reduction in consumer dropout. Modelling for
reduction in dropouts is based on the potential friction reduction, which may get impacted due to the usage of mobile-based media.
*This number can be achieved by reducing the friction, thus increasing the addressable market opportunity
Source:
[1] Apparel and Footwear in India, Euromonitor, February 2018; Apparel Accessories in India, Euromonitor, February 2018
[2] KPMG in India's analysis, 2018 based on data obtained from multiple industry reports and primary survey conducted by
Nielsen, 2018
2017
2022
e
By reducing media friction with mobile, fashion accessories brands can tap into a
~USD9 billion* opportunity
Enhancing mobile in
media mix

© 2018 KPMG, an Indian Registered Partnership and a member firm of the KPMG network of independent member firms affiliated with KPMG International Cooperative (“KPMG International”), a Swiss entity. All rights reserved.
16
Friction Mapping -
Understanding
Friction
© 2018 KPMG, an Indian Registered Partnership and a member firm of the KPMG network of independent member firms affiliated with KPMG International Cooperative (“KPMG International”), a Swiss entity. All rights reserved.

© 2018 KPMG, an Indian Registered Partnership and a member firm of the KPMG network of independent member firms affiliated with KPMG International Cooperative (“KPMG International”), a Swiss entity. All rights reserved.
17
© 2018 KPMG, an Indian Registered Partnership and a member firm of the KPMG network of independent member firms affiliated with KPMG International Cooperative (“KPMG International”), a Swiss entity. All rights reserved.
© 2018 KPMG, an Indian Registered Partnership and a member firm of the KPMG network of independent member firms affiliated with KPMG International Cooperative (“KPMG International”), a Swiss entity. All rights reserved.
18
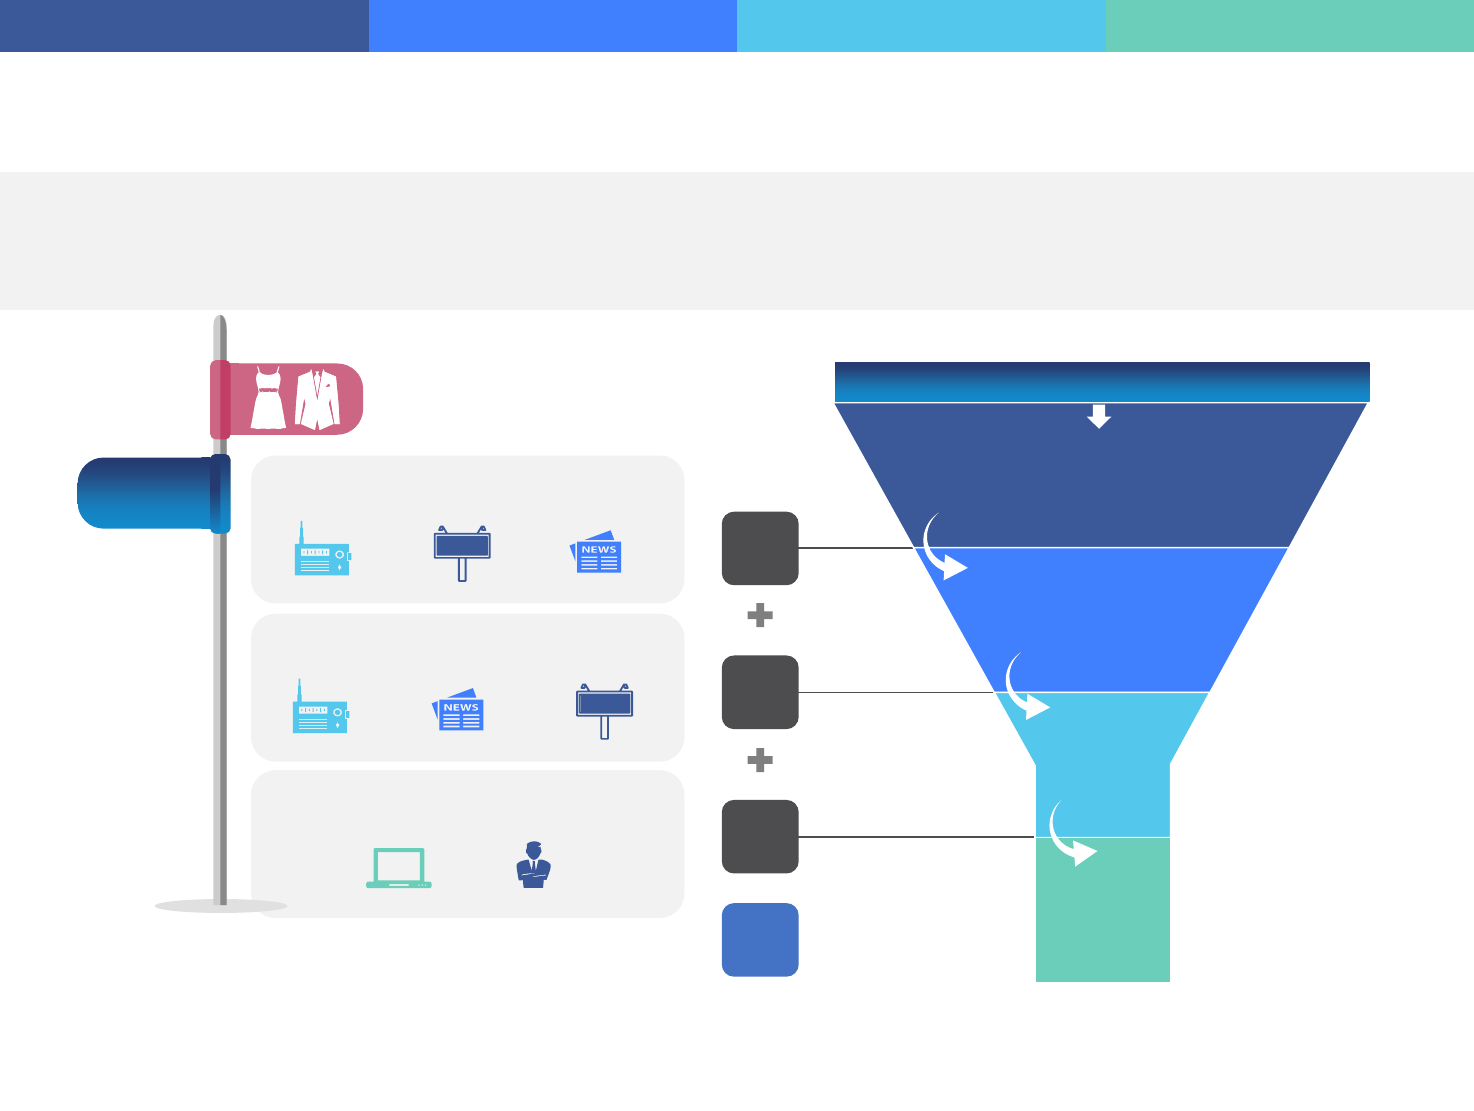
Consumers expect more information and clarity on next steps at the top of the funnel, where traditional media such as print, outdoor and radio are relatively less efficient.
Further, two-thirds of media-led friction occurs at intent stage of the purchase journey. While consumers are most comfortable in physical browsing and trial of apparel at
stores, the survey revealed that nearly one-third of the consumers at retail stores found a better product, brand, or price elsewhere. A similar behaviour was observed for e-
commerce portals, where the proportion of consumers facing friction shows an increasing trend from one in five at the awareness stage, to nearly one-third at intent stage.
This indicates that while e-commerce platforms provide relevant information, they lack the ability to drive the final transaction efficiently.
Base = 547
Apparel Buyers – Aware Decision Makers who have purchased or tried to purchase a clothing
apparel in the last 3 months
Apparel Considerers – Aware Decision Makers who have considered purchase of a clothing
apparel in the last 3 months but have yet not purchased
Apparel Aware Non-considerers – Aware Decision Makers who have not considered
purchase of a clothing apparel in the last 3 months
Note: * At intent stage, only retail store and online touch-points were evaluated in the research to eliminate default
attribution to top-of-mind channels
** Online includes top five media touch points accessed by respondents at respective stage of the journey
Top 3 friction-causing media at Awareness stage
Top 3 friction-causing media at Consideration stage
Top friction-causing media at Intent stage*
Outdoor PrintRadio
PrintRadio
Online** Retail Store
Media
friction
2%
8%
2%
12%
Consideration
Intent
86%
77%
Purchase
Consideration
friction
Intent
friction
80%
67%
Total population – 100%
Awareness
friction
Aware decision
makers/influencers
=
86%
74%
70%
90%
89%
Outdoor
85%
74%
57%
Apparel
More than 8 out of 10 people face friction on print, outdoor and radio at
the top of the apparel purchase funnel
© 2018 KPMG, an Indian Registered Partnership and a member firm of the KPMG network of independent member firms affiliated with KPMG International Cooperative (“KPMG International”), a Swiss entity. All rights reserved.
19
Base = 478
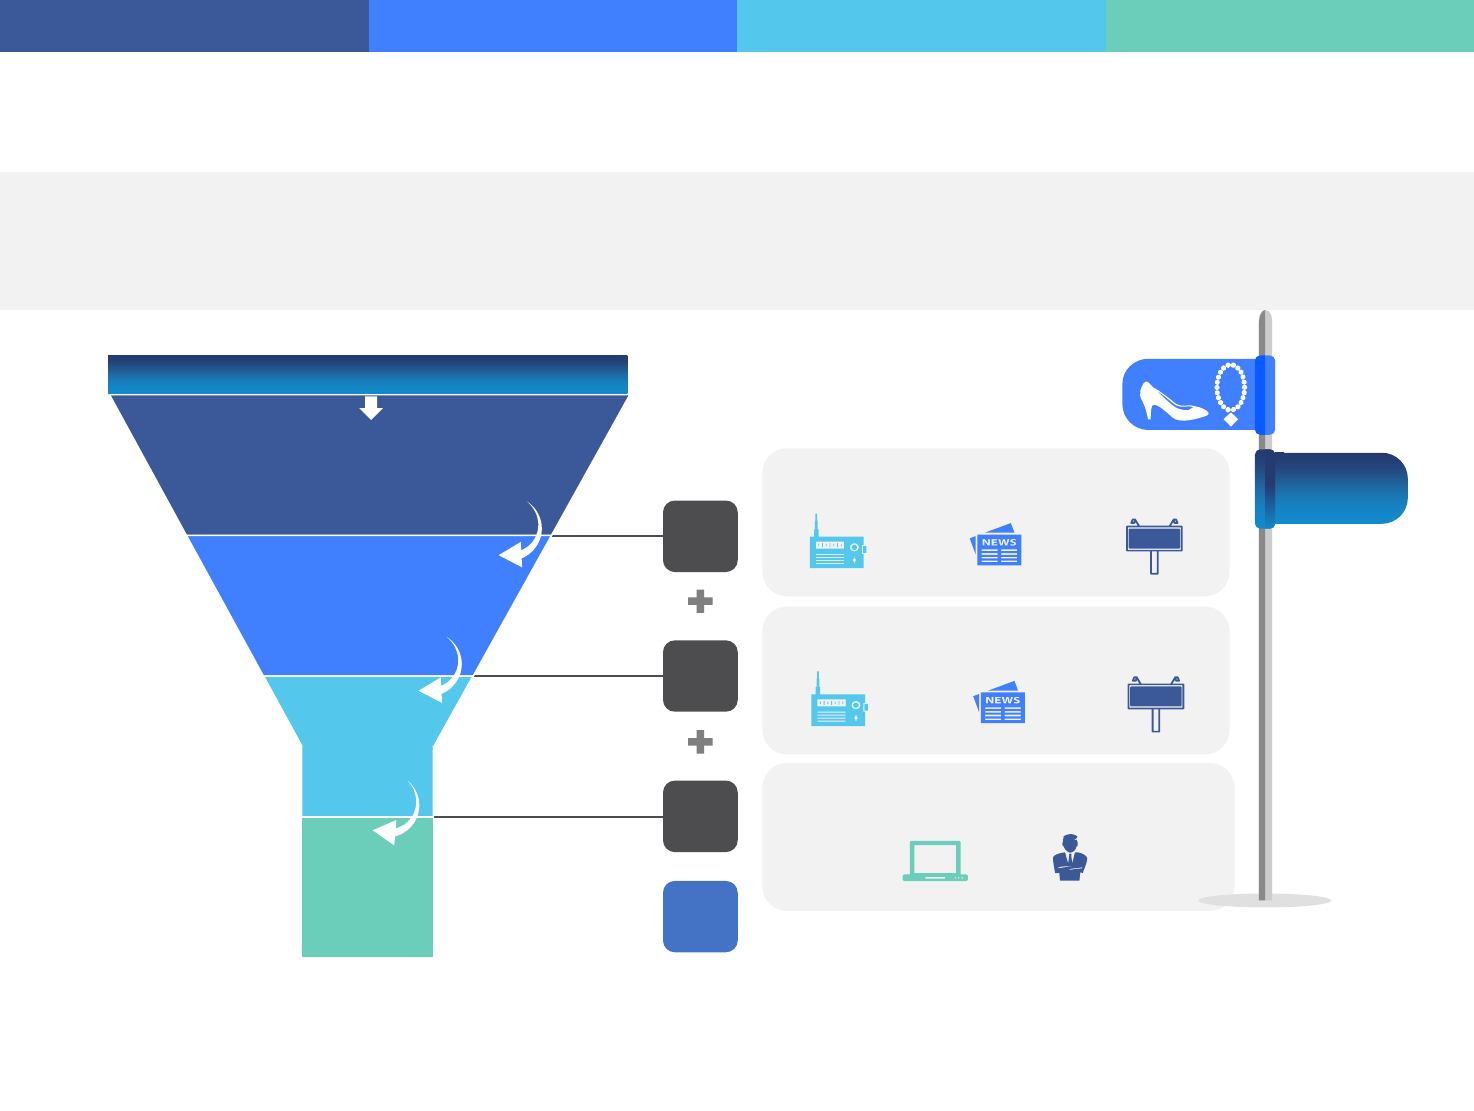
Static media touch points such as print, radio and outdoor offer the highest friction at the top of the funnel. Although these media touch-points are best suited for creating
‘brand awareness and recall’ among the target consumers, they are less suited for providing further information to the consumers. Online channels, on the other hand,
perform better as source of more information or as point of sale. Not only can online platforms attract attention of consumers through contextualised and targeted
communication, but can also provide detailed product information with convenience of home delivery. However, in terms of transactions, only 20 per cent of buyers reported
using e-commerce for purchase of fashion accessories, indicating an opportunity for the brands to further leverage digital channels for improving their reach among target
consumers.
Accessories Buyers – Aware Decision Makers who have purchased or tried to purchase
a male and(or) female fashion accessories in the last 3 months
Accessories Considerers – Aware Decision Makers who have considered purchase of a
male and(or) female fashion accessories in the last 3 months but have yet not
purchased
Accessories Aware Non-considerers – Aware Decision Makers who have not considered
purchase of a male and(or) female fashion accessories in the last 3 months
Note: * At intent stage, only retail store and online touch-points were evaluated in the research to eliminate default
attribution to top-of-mind channels
** Online includes top five media touch points accessed by respondents at respective stage of the journey
Media
friction
3%
8%
2%
13%
Consideration
Intent
86%
74%
Purchase
Consideration
friction
Intent
friction
78%
64%
Total population – 100%
Awareness
friction
Aware decision
makers/influencers
=
Top 3 friction-causing media at Awareness stage
Top 3 friction-causing media at Consideration stage
Top friction-causing media at Intent stage*
PrintRadio
PrintRadio
Online** Retail Store
72%
64%
93%
92%
Outdoor
72%
67%
47%
Outdoor
57%
Accessories
Print, outdoor and radio cause dissatisfaction to nearly 7 out of 10
people in fashion accessories purchase funnel

© 2018 KPMG, an Indian Registered Partnership and a member firm of the KPMG network of independent member firms affiliated with KPMG International Cooperative (“KPMG International”), a Swiss entity. All rights reserved.
20
Both genders display different drivers for entering the purchase funnel. Men seek clear next steps after watching an advertisement. On the other
hand, women are more susceptible to ignoring ads if they fail to either capture their attention or provide relevant information. As the prospects move
ahead in the purchase journey, offer communication and better ‘value for money deals’ become important decision-making parameters for both
genders. At the intent stage, consumers lack trust with point of sale on account of product authenticity, delivery and payment. However, consumers
are much more likely to switch brand/sales channel at retail stores, as they are significantly more likely to find better price, product or fit elsewhere.
5%
11%
4%
Male
Female
Prospect does not know
what to do next after
watching ads
Prospect finds too little
information from ads
Offer communication is not
clear
Prospect does not find
requisite information
Prospect found a better
price/option elsewhere
Lack of trust at point of sale
5%
10%
3%
Prospect found a better
price/option elsewhere
Lack of trust at point of sale
Prospect finds too little
information from ads
Prospect did not pay
enough attention to ads
Offer communication is not
clear
Prospect does not trust the
medium as source of
information
Note: * At intent stage, only retail store and online touch-points were evaluated in the research to eliminate
default attribution to top-of-mind channels
18%
Media friction (%)
Media friction (%)
Media friction (%)
Media friction (%)
Media friction (%)
Media friction (%)
17%
25% 22%
17%
37%
37%
17% 17%
=
20%
=
18%
Aware decision makers/
influencers
Consideration
Intent
Purchase
Total population – 100%
Consideration
friction
Intent friction
84%
79%
76%
66%
Awareness
friction
Consideration
friction
Intent friction
88%
83%
79%
68%
Awareness
friction
28%
‘Value for money’ and ‘credible information’ at point of sale are
common asks for both men and women
Legend
Outdoor Print Television Digital Medium*
Media with highest contribution to top two friction points
Retail store
Radio
Apparel

© 2018 KPMG, an Indian Registered Partnership and a member firm of the KPMG network of independent member firms affiliated with KPMG International Cooperative (“KPMG International”), a Swiss entity. All rights reserved.
21
Consideration
friction
Intent friction
Awareness
friction
Consideration
friction
Intent friction
Awareness
friction
Note: * At intent stage, only retail store and online touch-points were evaluated
in the research to eliminate default attribution to top-of-mind channels
8%
4%
4%
7%
12%
4%
A similar proportion of target population of men and women commences purchase journey of fashion accessories. Primary reasons for abandoning the
purchase are same for men and women. However, women are more sensitive to price of the product and trust at the point of sale. Men, on the other hand,
are more likely to ignore an advertisement at top of the funnel, but seek lucrative offers and detailed information for evaluating their shortlisted products.
Further, the tendency of consumers to switch to another product or brand is significantly higher at offline stores. Of the total, 41 per cent men and 33 per
cent women are likely to find an option of the product elsewhere when buying at retail stores. On the other hand, brand or product loyalty is observed to be
higher at online stores among both genders.
Prospect finds too little
information from ads
Prospect did not pay attention to
the ads
Offer communication is not clear
Prospect does not find requisite
information
Prospect found a better
price/option elsewhere
Lack of trust at point of sale
Prospect found a better
price/option elsewhere
Lack of trust at point of sale
Prospect does not know what to
do next after watching ads
Prospect finds too little
information from ads
Offer communication is not
clear
Prospect does not find
requisite information
11% 19%
24% 22% 16%
11%
16%
23%
20%
Media friction (%)
Media friction (%)
Media friction (%)
Media friction (%)
Media friction (%)
Media friction (%)
=
16%
=
23%
Aware decision makers/
influencers
Consideration
Intent
Purchase
Total population – 100%
84%
77%
73%
61%
88%
80%
76%
72%
19% 35%
27%
Women are more sensitive to the price of product and lack trust at
point of sale
Legend
Outdoor Print Television Digital Medium*
Media with highest contribution to top two friction points
Retail store
Radio
Male
Female
Accessories

© 2018 KPMG, an Indian Registered Partnership and a member firm of the KPMG network of independent member firms affiliated with KPMG International Cooperative (“KPMG International”), a Swiss entity. All rights reserved.
22
Although e-commerce advertising is often targeted towards younger age groups, similar number of potential consumers across older age groups also enter and
complete the purchase journey. Unlike younger consumers, 35-49 year-olds are more sensitive to inaccurate targeting of ads, or lack of clear call-to-action.
However, younger age group of 18-24 year olds has a higher propensity to drop out at the intent stage.
Consumers from all age groups display discontent for lack of options to compare, lack of attractive offers and expectation mismatch at point of sale. This
creates an opportunity for e-commerce players to deploy a full-funnel marketing strategy by addressing such friction points. Brand’s marketing communication
strategy implemented in tandem with e-commerce strategy, could capture leads at top of the funnel and facilitate their movement through the purchase funnel.
Note: * At intent stage, only retail store and online touch-points were evaluated in the research to
eliminate default attribution to top-of-mind channels
Friction points
for 35-49 years
Prospect finds too little
information from ads
Prospect does not know what
to do next after watching ads;
and prospect did not pay
attention to the ads
Prospect does not trust the
medium as source of
information
Prospect does not find
requisite information
Prospect found a better
price/option elsewhere
Prospect found it difficult to
express interest/buy
instantly
Friction points
for 25-34 years
Prospect does not know what to
do next after watching ads
Prospect did not pay enough
attention to ads
Offer communication is
not clear
Prospect does not trust
the medium as source of
information
Prospect found a better
price/option elsewhere
Lack of trust at point of sale
Friction points
for 18-24 years
Prospect finds too little
information from ads
Prospect does not know what
to do next after watching ads;
and prospect did not pay
attention to the ads
Offer communication is not
clear
Prospect does not find
requisite information
Lack of trust at point of sale
Prospect found a better
price/option elsewhere
21% 40% 20% 20%
28% 23% 44% 35% 29%36%
14% 21%
24%
Consideration
Intent
88%
84%
80%
Purchase
68%
86%
79%
76%
67%
18–24 years
3%
9%
25–34 years 35–49 years
Aware decision
makers/influencers
84%
81%
77%
68%
4%
3%
9%
Total population
100%
Total population
100%
Total population
100%
4%
4%
12%
= =
16% 19%20%
7%
Media friction (%)
22% 24%
40%
Legend
Outdoor Print Television Digital Medium*
Media with highest contribution to top two friction points
Retail store
Radio
Apparel
All age groups seek product assortment with attractive offers and
assured authenticity
Media friction (%)
Media friction (%)

© 2018 KPMG, an Indian Registered Partnership and a member firm of the KPMG network of independent member firms affiliated with KPMG International Cooperative (“KPMG International”), a Swiss entity. All rights reserved.
23
Highest friction in fashion accessories purchase across all age groups is observed at the top of the funnel. The age group of 35-49 years distinctly show
dissatisfaction with print advertisements in terms of gathering information or understanding next steps in the purchase journey. This age group also
seeks more assistance in decision making, and is less likely than younger age groups to abandon the purchase at the bottom of the funnel. The age
group of 18-24 years abandon the purchase at the awareness stage itself, because the advertisement fails to both capture their attention and provide
call-to-action. Further, all age groups demand competitive pricing and assurance of quality from the sales channel they purchase from.
Friction points
for 35-49 years
Prospect does not know
what to do next after
watching ads
Prospect finds too little
information from ads
Prospect does not find
requisite information
No expert advice/answers
available
Prospect found a better
price/option elsewhere
Lack of trust at point of
sale
Friction points
for 25-34 years
Prospect finds too little
information from ads
Prospect does not know what
to do next after watching ads
Offer communication is
not clear
No expert advice/answers
available
Prospect found a better
price/option elsewhere
Lack of trust at point of sale
Friction points
for 18-24 years
Prospect does not know what
to do next after watching ads
Prospect did not pay enough
attention to the ads
Prospect does not find
requisite information
Offer communication is
not clear
Prospect found a better
price/option elsewhere
Lack of trust at point of sale;
and it was difficult express
interest or buy instantly
Note: * At intent stage, only retail store and online touch-points were evaluated in the research to eliminate default
attribution to top-of-mind channels
27% 11% 29% 22% 41% 17%
9% 26% 33% 20%
19% 25% 15%
Consideration
Intent
89%
80%
76%
Purchase
72%
86%
77%
73%
68%
18–24 years
4%
5%
25–34 years 35–49 years
Aware decision
makers/influencers
84%
78%
74%
71%
4%
6%
3%
Total population
100%
Total population
100%
Total population
100%
9%
4%
4%
= =
13% 18%17%
9%
Media friction (%)
29%20%
Accessories
Across age groups, more than 1 in 3 consumers shopping at retail
stores are likely to change their accessories purchase decision
Media friction (%)
Media friction (%)
Legend
Outdoor Print Television Digital Medium*
Media with highest contribution to top two friction points
Retail store
Radio

© 2018 KPMG, an Indian Registered Partnership and a member firm of the KPMG network of independent member firms affiliated with KPMG International Cooperative (“KPMG International”), a Swiss entity. All rights reserved.
24
Both NCCS A and NCCS B* consumers display comparable tendency to enter and complete the apparel purchase journey. However, more than three-fourths
of prospects abandon the purchase at either the awareness or intent stage.
Further, the spending patterns evolve from need or utility based for NCCS B consumers, to hedonic for NCCS A consumers. At the top of the funnel, NCCS B
consumers tend to ignore advertisements that do not resonate with their needs. Further, although e-commerce advertisements are more often focused on
NCCS A consumers, NCCS B consumers are 34 per cent more likely to purchase apparel online than NCCS A consumers, thereby offering an additional
source of growth to e-commerce players. While network robustness could improve gradually, innovative solutions such as an offline shopping mode on e-
commerce apps and assisted e-commerce could curb a significant portion of final-stage friction loss arising due to weak internet connectivity.
4%
10%
4%
Prospect finds too little information
from ads
Prospect does not know what to
do next after watching ads
Offer communication is not clear
Prospect does not find requisite
information
Prospect found a better
price/option elsewhere
Lack of trust at point of sale
7%
8%
5%
Lack of trust at point of sale
Connectivity issue impacting
experience
Prospect did not pay enough
attention to ads
Prospect does not know what to do
next after watching ads
Prospect does not find requisite
information
Offer communication is not clear
Note: At intent stage, only retail store and online touch-points were evaluated in the research to eliminate
default attribution to top-of-mind channels
*NCCS- New Consumer Classification System
30%
Media friction (%)
Media friction (%)
28% 30% 19%
21%
32%
28%
19%
14%
21%
=
18%
=
20%
Aware decision makers/
influencers
Consideration
Intent
Purchase
Total population – 100%
Consideration
friction
Intent friction
87%
80%
75%
67%
Awareness
friction
Consideration
friction
Intent friction
85%
81%
77%
67%
Awareness
friction
Media friction (%)
Media friction (%)
31%
Apparel
Legend
Outdoor Print Television Digital Medium*
Media with highest contribution to top two friction points
Retail store
Radio
Media friction (%)
Media friction (%)
Poor connectivity and lack of trust at point of sale inhibit mobile-driven
purchase journeys of NCCS B consumers
NCCS A NCCS B

© 2018 KPMG, an Indian Registered Partnership and a member firm of the KPMG network of independent member firms affiliated with KPMG International Cooperative (“KPMG International”), a Swiss entity. All rights reserved.
25
7%
4%
3%
10%
4%
5%
NCCS B* consumers are more likely to abandon purchase of fashion accessories after entering the purchase funnel as compared to NCCS A
consumers, and half as likely as NCCS A consumers to transact online. More than half of friction loss among NCCS B consumers occurs at the
awareness stage itself. Performance of digital medium could be further enhanced by targeting NCCS B consumers with the relevant content. Further,
at consideration stage, this consumer segment is more sensitive to price offers and lacks trust in the information shared by traditional media.
Prospect does not know what to
do next after watching ads
Prospect finds too little
information from ads
Prospect does not find requisite
information
Offer communication is not clear
Prospect found a better
price/option elsewhere
Lack of trust at point of sale
Prospect found a better
price/option elsewhere
Lack of trust at point of sale
Prospect does not know what to
do next after watching ads
Prospect finds too little
information from ads
Offer communication is not clear
Prospect does not trust the
medium as source of
information
Note: At intent stage, only retail store and online touch-points were evaluated in
the research to eliminate default attribution to top-of-mind channels
*NCCS- New Consumer Classification System
Media friction (%)
Media friction (%)
Media friction (%)
Media friction (%)
Media friction (%)
Media friction (%)
19% 23% 17%
18%
50%
36%
19%
20%
20%
=
14%
=
19%
Aware decision makers/
influencers
Consideration
Intent
Purchase
Total population – 100%
Consideration
friction
Intent friction
87%
77%
72%
68%
Awareness
friction
Consideration
friction
Intent friction
85%
78%
75%
71%
Awareness
friction
27%
21%
Accessories
Legend
Outdoor Print Television Digital Medium*
Media with highest contribution to top two friction points
Retail store
Radio
Lack of contextualised content and clear call-to-action mechanism are
key asks for NCCS B consumers
NCCS A NCCS B

© 2018 KPMG, an Indian Registered Partnership and a member firm of the KPMG network of independent member firms affiliated with KPMG International Cooperative (“KPMG International”), a Swiss entity. All rights reserved.
26
At the awareness stage, the objective of advertising campaigns is to make the brand visible and stand out from the crowd. Traditional print media placements,
store displays, extravagant photo-shoots and images of celebrities wearing the brand collections have been conventionally used by fashion brands to create
consumer awareness. However, new age digital platforms have emerged as a preferred source for building consumer awareness and communication.
Fashion and retail brands are leveraging social platforms to successfully create a community following. By way of highly efficient tools such as sequential
advertisements and analytics based micro-targeting, digital platforms outscore traditional media at the top of the funnel in capturing the attention of
consumers, and driving them towards the point of sale.
Awareness
Consideration
Intent
Purchase
Top friction points Television Print Outdoor Radio
Retail
store/outlet
Online*
Prospect finds too little
information from ads
Prospect does not
know what to do next
after watching ads
Prospect did not pay
enough attention to
ads
Offer communication
is not clearly
mentioned
Payment
schemes/options
available are not
enlisted
29%
28%
28%
22%
16%
27%
12%
9%
2%
3%
21%
29%
12%
10%
9%
9%
14%
29%
8%
4%
5%
36%
32%
19%
5%
4%
2%
7%
4%
5%
5%
9%
12%
11%
7%
Percentage of respondents experiencing the mentioned
friction in respective media touchpoints
%
Media with lowest friction for the given friction point Media with highest friction for the given friction point
Medium causing high friction
Apparel: Awareness friction
* Online includes top five media touch points accessed by respondents at respective stage of the journey
New age digital platforms emerging as the preferred source for
consumer awareness and communication
Apparel

© 2018 KPMG, an Indian Registered Partnership and a member firm of the KPMG network of independent member firms affiliated with KPMG International Cooperative (“KPMG International”), a Swiss entity. All rights reserved.
27
While traditional mediums, such as print and radio, lag in meeting consumers’ expectations at the top of the funnel, fashion accessories brands and retailers
are increasingly leveraging digital platforms for deploying their full-funnel strategies. Xeric brand of watches has leveraged social media to bootstrap the
brand awareness for its vintage inspired watches and raised more than USD2 million by leveraging the power of social media and crowdfunding
[1]
. Today,
people do not have to rely on traditional advertising mediums to stay abreast with fashion trends, but prefer digital mediums to seek information. Fashion
accessories brand, Kate Spade allows its customers to ‘seamlessly explore, tap and shop the product’— going from inspiration to information to purchase in
just a few steps. Shoppable (also called interactive or e-commerce) technology allows viewers to click prompts on the screen to save items for viewing later
or to head straight to a link to buy the item. Social media oriented marketers who have already uploaded their product catalogues on that platform can easily
plug them into the ‘shoppable technology.’
[2]
Awareness
Consideration
Intent
Purchase
Top friction points Television Print Outdoor Radio
Retail
store/outlet
Online*
Prospect does not
know what to do next
after watching ads
Prospect finds too little
information from ads
Prospect did not pay
enough attention to
the ads
Payment
schemes/options
available are not
enlisted
Offer communication is
not clearly mentioned
27%
26%
22%
17%
15%
13%
20%
5%
3%
2%
31%
21%
13%
7%
8%
12%
9%
13%
7%
8%
26%
6%
24%
9%
18%
0%
3%
1%
2%
3%
Percentage of respondents experiencing the mentioned
friction in respective media touchpoints
%
Media with lowest friction for the given friction point Media with highest friction for the given friction point
Medium causing high friction
Accessories: Awareness friction
0%
5%
8%
4%
6%
[1] How a Vintage-Inspired Watch Brand Used Crowdfunding and Social Media to Raise Millions, Adweek.com, April 2017
[2] Retailers Can Now Make Instagram Posts Much More Shoppable, Adweek.com, May 2017
* Online includes top five media touch points accessed by respondents at respective stage of the journey
Innovative applications of digital platforms augment consumer
experience with brands at the top of the funnel
Accessories

© 2018 KPMG, an Indian Registered Partnership and a member firm of the KPMG network of independent member firms affiliated with KPMG International Cooperative (“KPMG International”), a Swiss entity. All rights reserved.
28
Awareness
Consideration
Intent
Purchase
Fashion brands, which traditionally used print extensively, are gradually moving towards digital. Leading global brands such as Gucci, Louis Vuitton and others
have spent 60 per cent more on online ads in 2016 as compared to 2013.
[1]
Tailor-made and in-vogue product suggestions, purchase discounts, offers and
incremental services that are suitable to meet consumer’s lifestyle, comfort and requirement could significantly aid brands in converting the acquired lead into a
potential buyer at this stage. Digital channels are uniquely equipped to, first identify prospects that have moved to the consideration stage by analysing their
digital footprints, and then provide immersive and sequential content to assist them in the purchase journey. Virtual product trials and technology based tools for
accurate body measurements have already become a commercial reality and could further break barriers to evaluating and buying apparel online.
Awareness
Consideration
Intent
Purchase
Top friction points Television Print Outdoor Radio
Retail
store/outlet
Online*
Offer communication
is not clear
Prospect does not
find it easy to
browse/find
information required
Prospect does not
trust the medium as
source of information
Not able to get
credible/clear advice
Prospect does not
get all the required
information
27%
27%
22%
20%
16%
14%
2%
8%
26%
3%
53%
6%
17%
16%
6%
28%
11%
37%
12%
11%
22%
17%
31%
9%
2%
3%
3%
3%
1%
5%
8%
9%
12%
6%
10%
Percentage of respondents experiencing the mentioned
friction in respective media touchpoints
%
Media with lowest friction for the given friction point Media with highest friction for the given friction point
Medium causing high friction
Apparel: Consideration friction
[1] ”Fashion Ads, a Last Bastion of Print, Are Going Digital”-Matthew Dalton, WSJ.com, June 2017
* Online includes top five media touch points accessed by respondents at respective stage of the journey
Digital helps drive brand visibility and stickiness
Apparel

© 2018 KPMG, an Indian Registered Partnership and a member firm of the KPMG network of independent member firms affiliated with KPMG International Cooperative (“KPMG International”), a Swiss entity. All rights reserved.
29
Fashion-related products remain the number one category for online sales globally, and the numbers continue to grow. While the e-commerce industry
allocates more than two-thirds of its marketing budget to television, print, radio and outdoor
[1]
, these mediums scored significantly less in meeting consumers’
expectations at this stage. On the other hand, creative usage of digital technology is becoming more evident in the retail and online fashion market. Leading
fashion accessories brands in India have tried to eliminate the need for visiting a retail store by deploying Virtual Reality (VR), which allows users to interact
with high resolution 3D catalogue of products and see how they look from every angle. Such adoption of technologies has rewarded e-tailers with lower
perception of ‘touch and feel friction’ on an online portal than in offline touch-points. Digital content supported by such technologies could make the evaluation
process of fashion accessories more interactive and engaging for consumers.
Awareness
Consideration
Intent
Purchase
Top friction points Television Print Outdoor Radio
Retail
store/outlet
Online*
Prospect does not
find it easy to
browse/find
information required
Offer communication
is not clear
Not able to get
credible/clear advice
Prospect does not
trust the medium as
source of information
Unable to touch and
feel the product
28%
27%
23%
21%
2%
13%
25%
5%
5%
12%
32%
27%
20%
14%
10%
27%
9%
29%
15%
8%
20%
13%
30%
8%
3%
6%
1%
2%
2%
5%
5%
4%
10%
6%
Percentage of respondents experiencing the mentioned
friction in respective media touchpoints
%
Media with lowest friction for the given friction point Media with highest friction for the given friction point
Medium causing high friction
Accessories: Consideration friction
[1] Digital Advertising in India 2018, Dentsu Aegis Network
* Online includes top five media touch points accessed by respondents at respective stage of the journey
17%
Virtual trials have broken the barrier of touch-and-feel for e-tailing
platforms
Accessories

© 2018 KPMG, an Indian Registered Partnership and a member firm of the KPMG network of independent member firms affiliated with KPMG International Cooperative (“KPMG International”), a Swiss entity. All rights reserved.
30
Online brands have leveraged digital technology to match their relevance with the traditional retail stores. For instance, Virtusize allows online shoppers to go
through different outfits and compare the size and fitting of a garment they are looking to purchase with their favourite wardrobe outfits they already own. This
comparison helps them in selecting the ideal fit.
[1]
. However, customers still experience friction while concluding purchase on the online mediums. The inability
to ensure that the product displayed in catalogue is how it actually looks, and apprehension around delivery and return of the product, lead to lack of trust with
online point of sale. Further, more than one-fourth of e-commerce users face friction while completing online payments.
Traditional retail stores may continue to stay relevant and score higher on parameters of trust, touch-and-feel and impulse purchases. However, an optimised
omni-channel play, with multiple payment solutions could integrate the two channels and address each others’ friction areas to provide a uniform experience to
consumers.
% Percentage of respondents experiencing the mentioned friction in respective media touchpoints
[1] ‘How it works’, Vitusize.com, June 2018
* Online includes top five media touch points accessed by respondents at respective stage of the journey
Awareness
Consideration
Intent
Purchase
Top friction points Retail store/outlet Online*
Prospect did not find the preferred
payment option
Prospect found a better price/option
elsewhere
Lack of trust at point of sale
The right size was no longer available
Payment failed and prospect did not
try again
30%
25%
22%
Apparel: Intent friction
32%
2%
7%
12%
23%
12%
21%
33%
0%
37%
18%
21%
Note: At intent stage, only retail store and online touch-points were evaluated in media mix to calculate friction
Online platforms provide product information and comparisons, but
cause friction at the point of sale
Apparel

© 2018 KPMG, an Indian Registered Partnership and a member firm of the KPMG network of independent member firms affiliated with KPMG International Cooperative (“KPMG International”), a Swiss entity. All rights reserved.
31
At retail stores, consumers are more likely to be influenced by a competing brand or product. Especially in multi-brand outlets, where products from various
brands are on display, it is more convenient for consumers to compare prices, features and fit of products. On the other hand, it is more likely that a
consumer accesses an online channel with a predetermined set of brands or products. Therefore, stickiness of a consumer with a brand is significantly
higher on online portals.
However, online point of sales still offers friction on account of convenience of payment, touch and feel of product and credibility of information. Localisation
of payment web-pages and offering multiple and easy payment solutions could address such concerns significantly. Further, e-tailers have already seen
proven results from VR-based platforms providing a virtual experience of the product and prompt chat-bot based system for customer connect, targeted at
addressing bottom-of-the-funnel friction.
% Percentage of respondents experiencing the mentioned friction in respective media touchpoints
Note: At intent stage, only retail store and online touch-points were evaluated in media mix to calculate friction
* Online includes top five media touch points accessed by respondents at respective stage of the journey
Awareness
Consideration
Intent
Purchase
Top friction points Retail store/outlet Online*
Prospect found a better price/option
elsewhere
Prospect did not get the preferred
payment option
Lack of trust at point of sale
Unable to touch and feel the product
The same price was no longer available
or the offer had expired
34%
26%
19%
18%
28%
Accessories: Intent friction
43%
5%
6%
9%
14%
17%
22%
15%
16%
18%
Online observes higher stickiness of consumers towards brand or
product at bottom of the funnel
Accessories

© 2018 KPMG, an Indian Registered Partnership and a member firm of the KPMG network of independent member firms affiliated with KPMG International Cooperative (“KPMG International”), a Swiss entity. All rights reserved.
32
Accessories
Apparel
Lack of immediate availability and touch-and-feel of size, colour, fit and design of product(s) are the key barriers to online fashion commerce today. E-tailers are increasingly
adopting consumer-friendly technology solutions and are integrating digital technology to their physical assets to either replicate, or complement the offline consumer
experience. They, however, are still solving the ‘returns management’ part of the e-commerce puzzle. Omni-channel has offered one of the solutions where consumers
could access physical touch-points of e-tailers for both returning and experiencing the products. Both offline and online brands today are increasingly exploring omni-
channel strategies to offer the best of both channels to the consumers.
Further, advocacy is a major aspect of apparel and fashion accessories. Consumers display their fashion purchases and are more vocal about their product experience.
Consumers who shop online are more likely to speak about the purchase and give reviews about the product quality or experience with the portal. In a category where
brand or channel loyalty is low, fashion brands could create communities around their differentiated brand identities to engage with potentially loyal customers.
47%
33%
23%
Spoke about the
purchase on social
media
Recommended the
purchase to friends,
family members on
social media or chat
apps
Wrote reviews for the
product online
Purchase channel preference Post purchase activities
38%
29%
Wrote reviews for the
product online
40%
Spoke about the products
purchased on social
media
Recommended the
purchase to friends,
family members on social
media or chat apps
Convenience of door
step delivery
78%
Anytime
purchase
67%
Easy access to multiple
brands/products
42%
What
lacks in
offline?
Immediate availability
of product
55%
Ability to see, touch
and try merchandise
39%
Ability to easily return
items
34%
What
lacks in
online?
Anytime purchase
Convenience of door
step delivery
Easy access to multiple
brands/products
81%
63%
51%
What
lacks in
offline?
Immediate availability of
product
Ability to easily return
items
Ability to see, touch
and try merchandise
59%
44%
41%
What
lacks in
online?
E-tailers and traditional players are adopting strategies to offer the best
of both channels to their target consumers
Purchase channel preference Post purchase activities

© 2018 KPMG, an Indian Registered Partnership and a member firm of the KPMG network of independent member firms affiliated with KPMG International Cooperative (“KPMG International”), a Swiss entity. All rights reserved.
33
© 2018 KPMG, an Indian Registered Partnership and a member firm of the KPMG network of independent member firms affiliated with KPMG International Cooperative (“KPMG International”), a Swiss entity. All rights reserved.

© 2018 KPMG, an Indian Registered Partnership and a member firm of the KPMG network of independent member firms affiliated with KPMG International Cooperative (“KPMG International”), a Swiss entity. All rights reserved.
34
Friction Busting -
Increasing Sales
Opportunity With
Mobile
© 2018 KPMG, an Indian Registered Partnership and a member firm of the KPMG network of independent member firms affiliated with KPMG International Cooperative (“KPMG International”), a Swiss entity. All rights reserved.

© 2018 KPMG, an Indian Registered Partnership and a member firm of the KPMG network of independent member firms affiliated with KPMG International Cooperative (“KPMG International”), a Swiss entity. All rights reserved.
35
© 2018 KPMG, an Indian Registered Partnership and a member firm of the KPMG network of independent member firms affiliated with KPMG International Cooperative (“KPMG International”), a Swiss entity. All rights reserved.

© 2018 KPMG, an Indian Registered Partnership and a member firm of the KPMG network of independent member firms affiliated with KPMG International Cooperative (“KPMG International”), a Swiss entity. All rights reserved.
36
By 2022, mobile internet users in India are expected to rise to 677 million from 420 million users in 2017
[1]
. Nearly 65 per cent of apparel purchases in 2022 are expected to
be mobile-influenced, while nearly one out of three purchases is expected to be Facebook-influenced, each growing nearly three times. This growth is expected to be driven
on the back of organic penetration of internet, social media and digital technologies over the next five years. Brands, therefore, have a USD66 billion opportunity to re-look
at their marketing strategies and adapt to the fast-evolving mobile-first internet economy of India. Further, a mobile-enabled apparel purchase journey is shortened by at
least five days (14 per cent) as compared to a pure offline journey.
Mobile-enabled journeys are 14 per cent shorter. By 2022, mobile is
expected to influence ~2 in 3 apparel purchases, half of which are
expected to be driven by Facebook
Mobile influence
2.6x
USD66
billion
2017 2022
e
[2][3]
USD26
billion
47%
44%
58%
49%
62%
59%
73%
65%
Average
influence
Awareness
Consideration
Intent
Sales
opportunity
within
category
Facebook influence
2.7x
USD35
billion
2017 2022
e
[2][3]
USD13
billion
21%
24%
27%
24%
31%
35%
38%
34%
Average
influence
Awareness
Consideration
Intent
Sales
opportunity
within
category
Purchase journey in days
38 days
33 days
Offline
purchase
Mobile-enabled
purchase
Sources:
[1] [2] Internet users to touch 420 million by June 2017: IAMAI
report, Economic Times, May 2017; Internet users in India expected
to reach 500 million by June: IAMAI, Economic Times, Feb 2018;
eMarketer Forecasts Strong Growth in Facebook Users in India,
eMarketer, June 2017
[3] Apparel and Footwear in India, Euromonitor, February 2018;
KPMG in India's analysis, 2018 based on data obtained from
multiple industry reports and primary survey conducted by Nielsen,
2018

© 2018 KPMG, an Indian Registered Partnership and a member firm of the KPMG network of independent member firms affiliated with KPMG International Cooperative (“KPMG International”), a Swiss entity. All rights reserved.
37
By 2022, mobile internet users in India are expected to rise to 677 million from 420 million users in 2017.
[1]
More than 70 per cent of fashion accessories purchases in 2022
is expected to be mobile-influenced, while more than one-third of fashion accessories purchases in 2022 are expected to be Facebook-influenced, growing 2.5 times and
nearly three times, respectively. This growth is expected to be driven on the back of the organic penetration of the internet, social media and digital technologies over the
next five years. Brands, therefore, have a USD110 billion opportunity
[2][3]
to re-look at their marketing strategies, and adapt to the fast-evolving mobile-first internet economy
of India.
Mobile-ending journeys are 25 per cent shorter. By 2022, ~7 in 10
fashion accessories purchases are expected to be mobile-influenced,
nearly half of which are expected to be driven by Facebook
Mobile influence
2.5x
USD110
billion
2017 2022
e
[2][3]
USD43
billion
53%
51%
65%
56%
68%
66%
79%
71%
Average
influence
Awareness
Consideration
Intent
Sales
opportunity
within
category
Facebook influence
2.8x
USD59
billion
2017 2022
e
[2][3]
USD21
billion
25%
23%
32%
27%
36%
34%
44%
38%
Average
influence
Awareness
Consideration
Intent
Sales
opportunity
within
category
Purchase journey in days*
26 days 19 days
Sources:
[1] [2] Internet users to touch 420 million by June 2017: IAMAI
report, Economic Times, May 2017; Internet users in India expected
to reach 500 million by June: IAMAI, Economic Times, Feb 2018;
eMarketer Forecasts Strong Growth in Facebook Users in India,
eMarketer, June 2017
[3] Apparel and Footwear in India, Euromonitor, February 2018;
Apparel Accessories in India, Euromonitor, February 2018; KPMG in
India's analysis, 2018 based on data obtained from multiple industry
reports and primary survey conducted by Nielsen, 2018
*In case of fashion accessories, offline purchases includes all
purchase journeys where the purchase ends at offline channel, and
mobile-enabled purchase includes all purchase journeys where the
purchase ends at online channel
Offline
purchase
Mobile-enabled
purchase

© 2018 KPMG, an Indian Registered Partnership and a member firm of the KPMG network of independent member firms affiliated with KPMG International Cooperative (“KPMG International”), a Swiss entity. All rights reserved.
38
Methodology - Friction reduction
by enhancing the media mix
Interpret media-related friction individually at each
stage of the journey — awareness, consideration
and intent
Calculate potential friction reduction
opportunity for areas where mobile can help
bring down friction
Calculate potential opportunity for a brand to
reduce friction in future by enhancing mobile in
the media mix
Recommend feasible and scalable approaches on
the basis of identified friction areas and possibility
of technology fitment
© 2018 KPMG, an Indian Registered Partnership and a member firm of the KPMG network of independent memb

© 2018 KPMG, an Indian Registered Partnership and a member firm of the KPMG network of independent member firms affiliated with KPMG International Cooperative (“KPMG International”), a Swiss entity. All rights reserved.
39
Note: KPMG in India's analysis, 2018 based on primary survey conducted by Nielsen, 2018
For all three stages - awareness, consideration and intent - the reduction in friction on offline media is based on the weighted average of friction
scores for all online media, obtained from primary research
The calculation took into account the reduction in friction that could be achieved if offline friction percentages are replaced with the weighted averages of
online media. It has been assumed that the values of online media can be used as a proxy for mobiles since nearly 95 per cent of the online usage happens via mobile devices
2017
Media
friction
2022
e
Media
friction
Friction points
2022
e
Media
friction
2017
Media
friction
Friction points Friction points
28% 32% 24%
Awareness friction Consideration friction Intent friction
2017
Media
friction
2022
e
Media
friction
63%
44%
28%
27%
24%
22%
60%
55%
41%
23%
22%
18%
17%
39%
39%
28%
28%
24%
20%
16%
Prospect finds too little
information from ads
Prospect did not understand the
language of the ad
Product/brand was not
relevant to the prospect
The advertised product was not
meant for the prospect
Prospect does not know what to
do next after watching ads
Prospect did not pay enough
attention to ads
Offer communication was not
clear
No expert advice/answers
available
Prospect does not trust the
medium as source of information
Prospect was suggested
another option because of
which he/she switched
Prospect does not find it easy to
browse/find information required
Product looks different on the
screen than actual
Unable to touch and feel the
product
Prospect does not trust the
medium
Unable to touch and feel the
product
The same price was no longer
available or the offer had expired
Salesperson/customer service
agent could not address all queries
Prospect found a better
price/option elsewhere
Not able to easily contact
shopping websites/brands
customer service centre
The right size was no longer
available
Prospect found it difficult to
express interest/buy instantly
Prospect was not given all the
relevant information
16%
14%
Prospect did not find the ads to be
appealing
19%
17%
14%
Payment schemes/options
available are not enlisted
Offer communication was not
clearly mentioned
17%
Unpleasant experience with the
medium in the past
15%
Prospect does not find all the
relevant information
Mobile has the potential to reduce media friction by 3 percentage
points across the apparel purchase journey

© 2018 KPMG, an Indian Registered Partnership and a member firm of the KPMG network of independent member firms affiliated with KPMG International Cooperative (“KPMG International”), a Swiss entity. All rights reserved.
40
Note: KPMG in India's analysis, 2018 based on primary survey conducted by Nielsen, 2018
For all three stages - awareness, consideration and intent - the reduction in friction on offline media is based on the weighted average of friction
scores for all online media, obtained from primary research
The calculation took into account the reduction in friction that could be achieved if offline friction percentages are replaced with the weighted averages of
online media. It has been assumed that the values of online media can be used as a proxy for mobiles since nearly 95 per cent of the online usage happens via mobile devices
2017
Media
friction
2022
e
Media
friction
Friction points
2022
e
Media
friction
2017
Media
friction
Friction points Friction points
43% 40% 18%
Awareness friction Consideration friction Intent friction
2017
Media
friction
2022
e
Media
friction
100%
63%
38%
35%
32%
29%
78%
53%
52%
42%
36%
35%
35%
27%
24%
23%
20%
19%
15%
14%
13%
13%
Prospect does not know what to
do next after watching ads
Prospect finds too little
information from ads
Ads were not appealing for the
prospect
Prospect did not pay enough
attention to ads
Prospect does not trust the
medium as source of information
Product/brand was not relevant
to prospect
No expert advice/answers
available
Offer communication was not
clear
Prospect does not trust the
medium as source of information
Prospect does not find all the
relevant information
Too many brands/shopping
websites are advertised for
The right size of the product
was not identified
Product looks different on the
screen than actual
Prospect found a better
price/option elsewhere
Prospect does not trust the
medium
Salesperson/customer service
agent could not address all my
queries
Prospect does not find all the
relevant information
The right size was no longer
available
The same price was no longer
available or the offer had expired
Prospect found it difficult to
express interest/buy instantly
Prospect was not able to easily
contact shopping website’s/brand’s
customer service centre
Unable to touch and feel the
product
29%
The advertised product was not
meant for the prospect
28%
Offer communication is not
clearly mentioned
28%
Payment schemes/options
available are not enlisted
32%
Unable to touch and feel the
product
32%
Prospect does not find it easy to
browse/find information required
Mobile has the potential to reduce media friction by 4 percentage
points across the accessories purchase journey

© 2018 KPMG, an Indian Registered Partnership and a member firm of the KPMG network of independent member firms affiliated with KPMG International Cooperative (“KPMG International”), a Swiss entity. All rights reserved.
41
Source: Digital Advertising in India 2018, Dentsu Aegis Network,; Apparel and Footwear in India, Euromonitor, February 2018; KPMG in India's analysis, 2018
Methodology: The projection is based on estimated ratio of average cost of consumer acquisition for online and offline medium in apparel industry. The ratio is assumed to be consistent in
2022, and is used to project incremental spend on mobile based digital advertisement to tap about USD14 billion opportunity
*This number can be achieved by reducing the friction, thus increasing the addressable market opportunity
Replacing less-efficient offline media touch-points with mobile-based advertisement solutions could create opportunity of about USD14 billion between fashion brands
(apparel and fashion accessories), and could create value for fashion marketers by reducing their average cost per acquisition (CPA) of consumers by up to five per cent.
CPA of mobile-based digital mediums is today only a fraction of traditional mediums. Therefore, incremental spend on digital mediums could offer a better experience to
the consumers and higher economic value to the marketers.
Awareness
Consideration
Intent
Purchase
Apparel Accessories
2022
e
9%
1.5%
1.5%
6%
2017
12%
2%
8%
2%
3 percentage
point reduction
in friction
28%
reduction
in friction
32%
reduction
in friction
24%
reduction
in friction
2022
e
9%
2%
1%
6%
2017
13%
3%
8%
2%
4 percentage
point reduction
in friction
43%
reduction
in friction
40%
reduction
in friction
18%
reduction
in friction
~USD5 billion*
sales opportunity for brands
5%
Reduction in consumer acquisition cost
by moving spends from traditional media
like print, outdoor and radio to mobile
~USD9 billion*
sales opportunity for brands
Mobile in media mix can help fashion brands tap into ~USD14 billion
sales opportunity and reduce average CPA by 5 per cent
Consideration
friction
Intent friction
Awareness
friction
Consideration
friction
Intent friction
Awareness
friction

© 2018 KPMG, an Indian Registered Partnership and a member firm of the KPMG network of independent member firms affiliated with KPMG International Cooperative (“KPMG International”), a Swiss entity. All rights reserved.
42
*This number can be achieved by reducing the friction, thus increasing the addressable market opportunity
Mobile-influenced opportunity of about USD190 billion in fashion path to
purchase
2017 2022
e
Mobile-
influenced
market
Market
opportunity
through friction
reduction
Apparel Accessories
USD26
billion
USD43
billion
Apparel Accessories
USD66
billion
USD110
billion
Apparel Accessories
USD5
billion
USD9
billion
USD176 billion*
~USD14 billion*
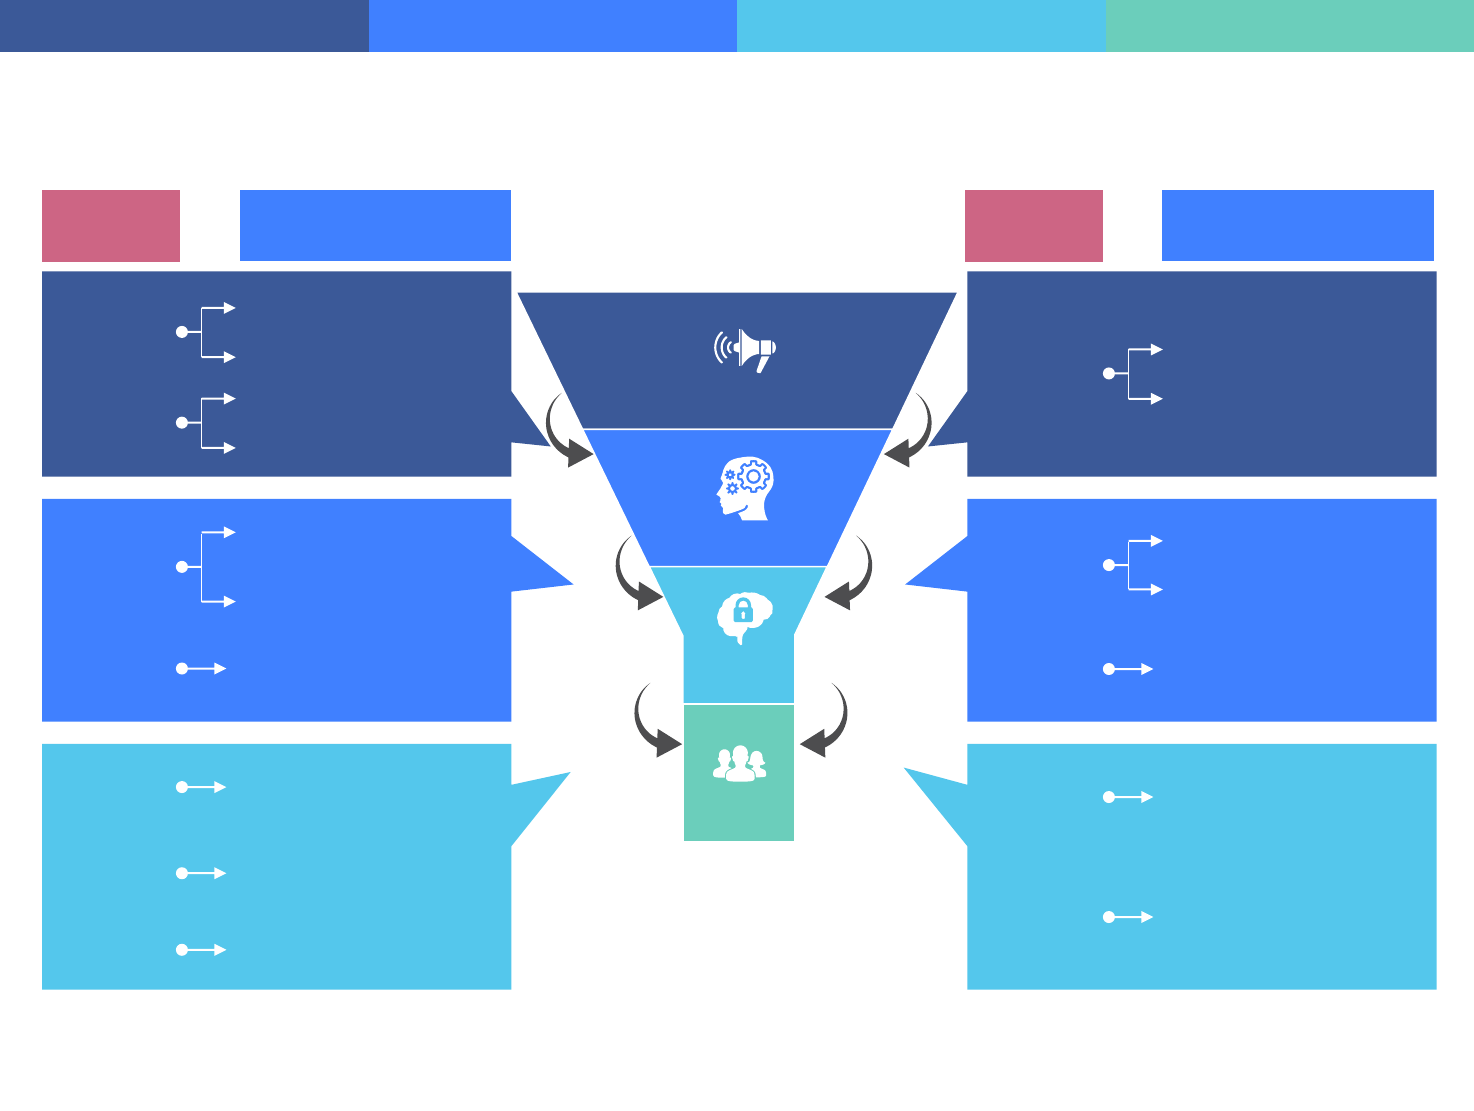
© 2018 KPMG, an Indian Registered Partnership and a member firm of the KPMG network of independent member firms affiliated with KPMG International Cooperative (“KPMG International”), a Swiss entity. All rights reserved.
43
Incremental spend on mobile medium could reduce cost of consumer
acquisition by 5 per cent for fashion brands
Awareness
Consideration
Intent
Purchase
Friction
points
Friction
busters
Prospect did not
pay enough
attention to ads
Operating at 2-3+ frequency to land
key product attributes using reach
and frequency
Leverage power of influencers
Prospect does
not know what
to do next after
watching ads
Clear ‘Call to Action’ leading to
product interactions
Geography-based suggestions on
brand stores
Offer
communication
is not clear
Instead of discount ranges, provide
specific information about absolute
money saved or percentage of
discount
Personalised offers and bundling
based on historical preferences,
search-trends, etc
Prospect does
not trust the
medium as
source of
information
Partner with multiple affiliates,
stores, channels to promote the
brand
Unable to touch
and feel the
product
Product demos, 360 degree
videos, in-depth product write-ups,
short form videos and carousel ads
to demonstrate products
Prospect found a
better
price/option
elsewhere
Call out reasons-to-buy and if
after-sales, warranty is applicable,
mention it upfront, along with
customer testimonials
Provide communication around
money refunds, customer safety
processes, service and warranties
Lack of trust at
the point of sale
Consideration
friction
Consideration
friction
Intent
friction
Intent
friction
Awareness
friction
Awareness
friction
Friction
points
Friction
busters
Prospect finds
little information
from ads
Simplified story telling by sequential
steps, product comparison
features, expert opinion/query
AR/VR based tools for experiencing
life-like look-and-feel of the product
Not able to get
credible/clear
advice
Blogs, articles, customer reviews,
especially for new products or
brands
Leverage power of influencers
Prospect does
not find requisite
information
Product demos, 360 degree videos,
in-depth product write-ups, short
form videos and carousel ads to
demonstrate products
Same price was
no longer
available or the
offer had expired
Mention time sensitive nature of
product, over-communicate during
sale period
Prospect was not
able to easily
contact shopping
websites or
brand’s customer
service centre
Provide easy contact options -
WhatsApp, messenger, phone and
others

© 2018 KPMG, an Indian Registered Partnership and a member firm of the KPMG network of independent member firms affiliated with KPMG International Cooperative (“KPMG International”), a Swiss entity. All rights reserved.
44
Zero Friction
Future -
Reimagining
The Purchase Journey
© 2018 KPMG, an Indian Registered Partnership and a member firm of the KPMG network of independent member firms affiliated with KPMG International Cooperative (“KPMG International”), a Swiss entity. All rights reserved.

© 2018 KPMG, an Indian Registered Partnership and a member firm of the KPMG network of independent member firms affiliated with KPMG International Cooperative (“KPMG International”), a Swiss entity. All rights reserved.
45
© 2018 KPMG, an Indian Registered Partnership and a member firm of the KPMG network of independent member firms affiliated with KPMG International Cooperative (“KPMG International”), a Swiss entity. All rights reserved.

© 2018 KPMG, an Indian Registered Partnership and a member firm of the KPMG network of independent member firms affiliated with KPMG International Cooperative (“KPMG International”), a Swiss entity. All rights reserved.
46
Awareness
Consideration
Intent
Purchase
Mobile will change the
consumer ’s journeys
A zero friction future
© 2018 KPMG, an Indian Registered Partnership and a member firm of the KPMG network of independent member firms affiliated with KPMG International Cooperative (“KPMG International”), a Swiss entity. All rights reserved.
47
Personalised suggestions on brands and style
based on digital interactions in the form of
searches, visits, video views and clicks
One-click purchase from e-commerce websites
and online portals
AI-driven bundling of apparel and fashion
accessories where system recommendations can
lead to cross-selling or up-selling
Home pick-up and delivery in case of product
return or exchange
Video or 360–degree video content on website to
provide aesthetic, functional and emotionally-
appealing motivations to customers
Messengers to facilitate payments/purchase while
browsing for apparel/fashion accessories on social
media
Personalised offers based on customer data and
purchase history
Virtual Reality and social media being used to
bring experiences from ongoing fashion events to
the consumers in stores/through online sites
Social media-based ‘brand community’ and real-
time interaction with fashion designers, stores and
shoppers
Online and chat-bot-assisted buying, stock
availability checks before visiting stores
Custom-made apparel/fashion accessories
Personalised fitting experience with size
recommendation engines in virtual changing rooms,
AR-based apps for fashion accessories
Localised language content and website
interaction to ensure a seamless buying
experience online
‘Try and Buy’ offer to try the products at home
before making a payment to purchase them
Consumers for this category no longer belong to a homogenous segment. This has led to emergence of different pathways, with digital playing a key role in shaping most,
if not all, pathways. With increased adoption of digital, rapid enhancement in consumer friendly technology such as AR/VR, consumer analytics through AI, machine
learning and personalised offers, the path to purchase is expected to be shorter and seamless. With this increasingly non-linear journey we are gearing up for a frictionless
future.
Re-imagine fashion path to purchase

© 2018 KPMG, an Indian Registered Partnership and a member firm of the KPMG network of independent member firms affiliated with KPMG International Cooperative (“KPMG International”), a Swiss entity. All rights reserved.
48
Phase 2: Deep dive
• Purposive sampling to recruit
respondents for each category
and cohort
• Each cohort helped provide
detailed information at different
stages in the purchase journey
Aware non-considerers
Considerers
Intenders
Buyers
Reasons for
non-consideration
Influence of media
touch points
Reasons for friction
Influence of media
touch points
Reasons for friction
Analysing different
paths to purchase
Influence of touch points
Reasons for friction
Primary research methodology
The study entails the following approach to identify in-depth understanding of
the consumer purchase journey and friction areas therein
Primary research was undertaken by Nielsen India to cover the overall
purchase journey of a consumer and to understand the friction points at each
step of the journey. The study is based on random listing study on 3,000
respondents to understand the proportion of the population that falls at each
stage of the journey. Deep-dive study for fashion category was conducted on
1,025 respondents split as:
Primary interviews
Detailed interviews were conducted with sector experts to understand key
industry trends, friction areas, future pathways and outlook.
Secondary research
Detailed secondary research was undertaken to understand the apparel and
fashion accessories industry, market growth and future trends.
• NCCS — New Consumer Classification System
• Listing exercise conducted to derive the dropouts at each stage of the journey for the
categories separately among randomly selected respondents
• Size of the cohorts from listing was used as weighting inputs for the outputs from the
quantitative deep dive
• Base has been considered as those who are aware of the category and are either primary
decision makers/have actively contributed to the decision-making process
• Apparel Buyers – Aware Decision Makers who have purchased or tried to purchase a clothing apparel in the last 3 months
• Apparel Considerers – Aware Decision Makers who have considered purchase of a clothing apparel in the last 3 months but have yet not purchased
• Apparel Aware non-considerers – Aware Decision Makers who have not considered purchase of a clothing apparel in the last 3 months
• Accessories Buyers – Aware Decision Makers who have purchased or tried to purchase a male and(or) female fashion accessories in the last 3 months
• Accessories Considerers – Aware Decision Makers who have considered purchase of a male and(or) female fashion accessories in the last 3 months but have
yet not purchased
• Accessories Aware non-considerers – Aware Decision Makers who have not considered purchase of a male and(or) female fashion accessories in the last 3
months
Primary research methodology
Phase 1: Listing
Aware decision makers
Considerers
Intenders
Buyers
Loss due
to friction
(%)
Loss due to
friction (%)
Loss due
to friction
(%)
Total population
• Listing exercise was conducted to better
understand the proportion in the universe that
falls under each individual cohort at any given
time and to derive the size of these cohorts to
be applied in the deep dive phase
• A large-scale listing study was conducted to
capture incidence of respondents falling
under the different cohorts of consumers, i.e.,
buyers, considerers and aware non-
considerers
Category Gender
Age group
(years)
NCCS* Cities
Apparel:
547
Male:
430
18-24:
367
NCCS A:
744
Mumbai: 179
Delhi: 137
25-34:
414
Bengaluru: 141
Fashion
accessories
478
Female:
595
NCCS B:
281
Chennai: 161
35-49:
244
Kolkata: 171
Pune: 236
Methodology

© 2018 KPMG, an Indian Registered Partnership and a member firm of the KPMG network of independent member firms affiliated with KPMG International Cooperative (“KPMG International”), a Swiss entity. All rights reserved.
49
ABOUT KPMG IN INDIA ABOUT FACEBOOK ABOUT NIELSEN
KPMG in India, a professional services firm,
is the Indian member firm affiliated with
KPMG International and was established in
September 1993. Our professionals
leverage the global network of firms,
providing detailed knowledge of local laws,
regulations, markets and competition.
KPMG in India has offices across India in
Ahmedabad, Bengaluru, Chandigarh,
Chennai, Gurugram, Hyderabad, Jaipur,
Kochi, Kolkata, Mumbai, Noida, Pune and
Vadodara.
KPMG in India offers services to national
and international clients in India across
sectors. We strive to provide rapid,
performance-based, industry-focussed and
technology-enabled services, which reflect
a shared knowledge of global and local
industries and our experience of the Indian
business environment.
Founded in 2004, Facebook's mission is to
give people the power to build community
and bring the world closer together. Over
2.2 billion people globally use Facebook
every month to stay connected with friends
and family, to discover what's going on in
the world, and to share and express what
matters to them. Millions of businesses, big
and small, use Facebook's apps and
services to connect with real people and
grow their business.
Rooted in what we’ve learned from over 2
billion people on our platforms and the 6
million businesses that advertise with us,
Facebook IQ provides actionable insights
about people, marketing and measurement.
We offer studies, tools and resources built
to transform how marketers reach people
and deliver real results in this cross-
channel, multi-device world.
Whether you need inspiration for your next
big idea, research on how best to reach the
people that matter most, or the latest in ad
effectiveness, lean on Facebook IQ for
insights and strategies.
Nielsen Holdings plc (NYSE: NLSN) is a
global performance management company
that provides a comprehensive
understanding of what consumers watch
and buy. Nielsen’s Watch segment provides
media and advertising clients with Nielsen
Total Audience measurement services for
all devices on which content — video, audio
and text — is consumed. The Buy segment
offers consumers, packaged goods
manufacturers and retailers the industry’s
only global view of retail performance
measurement. By integrating information
from its Watch and Buy segments and other
data sources, Nielsen also provides its
clients with analytics that help improve
performance. Nielsen, an S&P 500
company, has operations in over 100
countries, covering more than 90 percent of
the world’s population. For more
information, visit www.nielsen.com

© 2018 KPMG, an Indian Registered Partnership and a member firm of the KPMG network of independent member firms affiliated with KPMG International Cooperative (“KPMG International”), a Swiss entity. All rights reserved.
50
© 2018 KPMG, an Indian Registered Partnership and a member firm of the KPMG network of independent member firms affiliated with KPMG International Cooperative (“KPMG International”), a Swiss entity. All rights reserved.

© 2018 KPMG, an Indian Registered Partnership and a member firm of the KPMG network of independent member firms affiliated with KPMG International Cooperative (“KPMG International”), a Swiss entity. All rights reserved.
51
KPMG in India’s team:
Sreedhar Prasad, Aditya Rath, Vrinda
Narang, Angad Singh, Dipesh Agarwal,
Priyam Modi, Piyushi Singh, Rahul
Kathuria, Nisha Fernandes, Vivek Malekar
Nielsen India:
Anupam Asthana, Kejal Gosar,
Priyanka Awasthi
Acknowledgements
© 2018 KPMG, an Indian Registered Partnership and a member firm of the KPMG network of independent member firms affiliated with KPMG International Cooperative (“KPMG International”), a Swiss entity. All rights reserved.

© 2018 KPMG, an Indian Registered Partnership and a member firm of the KPMG network of independent member firms affiliated with KPMG International Cooperative (“KPMG International”), a Swiss entity. All rights reserved.
KPMG in India contacts
Mritunjay Kapur
National Head, Markets & Strategy
Head – Technology Media & Telecom
T: +91 124 307 4797
E: mritunjay@kpmg.com
Arvind Gupta
Head, Management Consulting Advisory
T: +91 124 336 9463
E: arvindgupta1@kpmg.com
Harsha Razdan
Partner & Head, Consumer Markets
T: +91 22 6134 9663
E: harsharazdan@kpmg.com
Sreedhar Prasad
Partner & Head – E-Commerce and Internet
T: +91 80 3065 4055
E: sreedharprasad@kpmg.com
Aditya Rath
Partner, Customer and Channel
T: +91 22 3090 2580
E: adityarat[email protected]om
Facebook in India contacts
Sunita G.R
Head of Marketing – India
E: sunitag[email protected]
© 2018 KPMG, an Indian Registered Partnership and a member firm of the KPMG network
of independent member firms affiliated with KPMG International Cooperative (“KPMG
International”), a Swiss entity. All rights reserved.
The KPMG name and logo are registered trademarks or trademarks of KPMG International.
Facebook Materials™ AND © Facebook, Inc. are used by permission. All rights reserved
This document is for e-communication only
kpmg.com/socialmedia
