
S
¯
adhan
¯
a Vol. 40, Part 6, September 2015, pp. 1937–1954.
c
Indian Academy of Sciences
Combustion, performance and emissions characteristics
of a newly developed CRDI single cylinder diesel engine
AVINASH KUMAR AGARWAL
∗
, PARAS GUPTA and
ATUL DHAR
Engine Research Laboratory, Department of Mechanical Engineering,
Indian Institute of Technology Kanpur, Kanpur 208016, India
e-mail: [email protected]
MS received 25 November 2013; revised 13 May 2015; accepted 3 August 2015
Abstract. For improving engine performance, combustion and controlling emis-
sions from compression ignition (CI) engines, common rail direct injection (CRDI)
technology offers limitless possibilities by controlling fuel injection parameters such
as fuel injection pressure, start of injection (SOI) timing, rate of fuel injection and
injection duration. CRDI systems available commercially are quite complex and
use a large number of sensors, hardware and analytical circuits, which make them
very expensive and unfeasible for cheaper single cylinder engines, typically used in
agricultural sector and decentralized power sector.
This paper covers experimental investigations of a simpler version of CRDI system
developed for a constant-speed, single-cylinder engine. Modifications in the cylin-
der head for accommodating solenoid injector, designing injector driver circuit and
development of high pressure stage controls were some of the engine modification
and development tasks undertaken. SOI timing is an important parameter for improv-
ing engine’s combustion characteristics. SOI timings were varied between 25
◦
and
40
◦
BTDC for investigating engine’s performance, emissions and combustion char-
acteristics. Advanced fuel injections showed higher heat release rate (HRR), cylinder
pressure and rate of pressure rise (RoPR) because of relatively longer ignition delay
experienced. Lowest brake specific fuel consumption (BSFC) was obtained for 34
◦
CA BTDC SOI. Reduction in engine out emissions except NO
x
was observed for
advanced fuel injection timings for this newly developed CRDI system.
Keywords. CRDI system; combustion characteristics; start of injection; heat
release rate; emissions; combustion duration.
1. Introduction
A large segment of modern transportation systems is powered by direct injection diesel engines.
This is due to numerous advantages offered by these combustion systems in terms of excellent
∗
For correspondence
1937
1938 Avinash Kumar Agarwal et al
fuel economy and higher power density compared to indirect injection systems as well as spark
ignited gasoline engines. Increasing the fuel injection pressures and optimizing the injection
strategies are extremely important for further improvements in highly optimized compression
ignition (CI) engines. The flexibility to change the injection strategy and multiple injection capa-
bilities are not offered by mechanical fuel injection systems. On the other hand, in electronic fuel
injection systems, fuel injection parameters such as injection pressure, fuel injection rate, mul-
tiple injections and the start of injection (SOI) are precisely controlled and regulated with great
ease by an electronic control unit (ECU) under different engine operating conditions. Electronic
fuel injection systems used in modern diesel engines include unit pump system, unit injector sys-
tem, and CRDI systems. In case of unit injector and unit pump systems, fuel injection pressure
depends on the engine speed and they require separate fuel pump assemblies for each cylinder.
On the contrary, CRDI system has a high pressure fuel reservoir (common rail), which is sup-
plied fuel by a single high pressure fuel pump. This fuel is then delivered to all the cylinders
using high pressure pipes and high pressure solenoid injectors, which are controlled by the ECU
individually.
CRDI concept was proposed by Bosch in 1978 for diesel fuel injection for the first time
(Eblen & Stumpp 1978). A stepped piston was provided in each injector, which was able to sup-
port the fuel injection pressures ranging from 200 bars to 2,000 bars. This system demonstrated
promising advantages in terms of lower combustion noise from the engine as well as lower PM
emissions; however, the costs were prohibitively high at that time. A new fuel injection sys-
tem named ‘ECD-U2’ was developed (Miyaki et al 1991), which also consisted of an electronic
unit injector system and a high pressure common rail. This system could achieve fuel injection
pressures up to 1,200 bars. Rinolf et al (1995) further simplified the CRDI system. In their sys-
tem, fuel injection was controlled by a 2-way solenoid valve rather than a 3-way solenoid valve.
Schubiger et al (2001) investigated a heavy-duty diesel engine with a pressure limit up to 1,600
bar. Their system was capable of varying maximum fuel injection pressure up to 1,800 bar.
Cheng et al (1999) conducted experiments on a single cylinder engine with fuel injection pres-
sure up to 1,800 bars. Such a high fuel injection pressure provided improved fuel–air mixing and
reduced the engine-out emissions. Kong & Karra (2008) increased the fuel injection pressure
further up to 2,000 bar. Such a high pressure significantly reduced the soot emissions further.
Shimada et al (1989) carried out research on single cylinder engine to understand the effect of
high pressure fuel injections on the exhaust emissions and fuel consumption. They reported that
by increasing the fuel injection pressure by modifying fuel pump’s injection rate and nozzle area,
superior smoke emission characteristics and lower fuel consumption at low and medium engine
speeds could be achieved. Kohketsu et al (1994) investigated the effect of different parame-
ters such as fuel injection pressure, injection nozzle hole diameter, swirl ratio, and EGR rate on
exhaust emissions, combustion noise and fuel consumption. The results suggested that smaller
nozzle hole diameters were effective in reducing smoke and PM emissions. However by opti-
mizing the fuel injection timings, swirl ratio and higher injection pressures, it was also possible
to improve the fuel consumption, in addition to lower NO
x
and PM emissions. Henein et al
(2001) also used single cylinder diesel engine to experimentally investigate the effect of fuel
injection pressure, EGR rate and swirl ratio on engine performance and emissions. They reported
that by increasing the EGR rate (up to 55%), NOx emissions decreased continuously; however,
the smoke increased because of NOx-PM trade-off. Thirouard et al (2009) performed tests on
IFP prototype single cylinder engine with very high fuel injection pressures up to 2,500 bars
and showed that by combining high fuel injection pressures with high boost and maximum in-
cylinder pressure, very high specific power outputs (85–90 kW/l) and high fuel/air equivalence
Development of low cost CRDI single cylinder diesel engine 1939
ratios (0.9) could be achieved. Pilot injection shortens the ignition delay of the fuel injected dur-
ing the main injection; therefore, it reduces the combustion noise. Block et al (2002) discovered
formation of homogenous charge of pilot injected fuel quantity with advanced fuel injection tim-
ings. Zhang (1999) used a single cylinder high-speed diesel engine equipped with common rail
system to investigate the effect of pilot injection on the engine-out emissions and combustion
noise, in combination with EGR. They showed that pilot injection leads to a high pressure and
temperature environment in the cylinder, which encourages smoother pressure rise and faster
ignition of the fuel injected during the main injection pulse. Endres et al (1994) showed that by
using the ‘pre-injection’, there was reduction of NO
x
and particulate emissions, in addition to
improvement in combustion noise. Koyanagi et al (1999) investigated the effect of pilot injection
in an optical engine using visualization techniques. For a stable pilot injection, Ishiwata et al
(1994) developed TICS pilot injection system. To improve NO
x
-PM trade-off and fuel consum-
ption, Uchida et al (1998) used pilot injection to generate an inert combustion gas, which
caused ‘EGR effect’. Tow et al (1994) investigated multiple injection strategies using a cater-
pillar engine with double and triple injections. Riaud & Lavoisier (2002) carried out research
on optimization of multiple injection strategies. In their study, four different injection strategies
namely pilot-pilot-main-post injection, retarded pilot-main injection, pilot-pilot-main injection,
and advanced pilot-main injection were used. Nakakita et al (1992) concluded that precise con-
trol of pilot injection fuel quantity and pilot-main interval are essential for reducing smoke. By
using pilot injection, NO
x
reduces for more retarded injection timings because of earlier start
of main combustion. Shundoh et al (1992) reported that combination of pilot injection and high
fuel injection pressures simultaneously reduces NO
x
(∼35%) and smoke (∼60–80%) without
adversely affecting fuel economy. They concluded that reduction in ignition delay does not lead
to effective improvement at usual injection timings before TDC. However, when the injection
timing is considerably retarded or when the original ignition delay is relatively long, shortening
of the ignition delay is effective in reducing premixed combustion, therefore the NO
x
emissions
reduce. In the CRDI system, post-injection or secondary injection occurs after the main injec-
tion, while the combustion process is still on. Using post injection, soot particles are re-ignited
and this reduces soot emissions by 20–70% (Robert Bosch 2006). Tsurushima et al (1999) also
reported that post-injection reduces HC, CO as well as PM emissions. This was primarily due
to the oxidation of unburnt fuel, which remains in the combustion chamber after the completion
of main injection. Desantes et al (2007) found that if the post-injection is done close enough to
main injection, the end of combustion can take place earlier compared to single injection strat-
egy. Under such conditions, NO
x
emissions increase due to higher temperature levels in the last
stage of combustion, and soot formation and specific fuel consumption decrease due to relatively
faster combustion in the last phase.
All these however require a large number of sensors at different locations, a powerful micro-
processor and a detailed engine calibration exercise to be undertaken, which would make this
technology rather expensive and unaffordable for simpler and cheaper engines. There are a very
large number of constant speed engines used in decentralized power generation sector, agricul-
tural farm machinery and irrigation purposes, which have not yet reaped the benefits of the new
technology because this technology is very expensive. The engines typically used in these niche
areas produce 2–10 kW power, and are cheap, mostly manufactured locally; therefore, this niche
area is unfamiliar with the benefits of common rail direct injection (CRDI) engine technology.
The objective of this study is therefore to develop a low-cost CRDI system for replacing the
existing mechanical FIE system in such constant speed engines with basic CRDI components so
that the cost if lower. Performance, emissions and combustion characteristics of this new CRDI

1940 Avinash Kumar Agarwal et al
system are comprehensively investigated for optimizing the fuel injection timings for constant
speed engine applications.
2. Experimental setup
The test engine used for this investigation is a constant speed, single cylinder, four-stroke, water-
cooled, direct injection diesel engine (Kirloskar, DM-10), which was coupled to an AC alternator
(Kirloskar) for loading it. Detailed specifications of the unmodified test engine are given in
table 1. The schematic of the experimental setup is shown in figure 1.
Fuel injection system of this engine was changed to CRDI fuel injection system. Extensive
modifications on the engine cylinder head were carried out for installation of a high pressure
solenoid injector and a piezoelectric pressure transducer. The modified CRDI fuel injection sys-
tem (figure 1) includes a high pressure fuel pump, a common rail, a solenoid fuel injector, a
fuel filter, a high pressure fuel-line and a custom-made injection driver (controller) circuit
(figure 1(b)). This circuit contains two transformers (12 V/12 amp and 12V/2 amp) and IC 555 for
signal generation. The output signal from IC 555 is amplified using transistors (SL100, 2N3055).
Fuel injector requires very high current (~6 amp), which cannot be generated directly by these transistors.
Therefore this signal is again amplified using Insulated Gate Bipolar Transistor (IGBT). This
amplified signal drives the injector. This newly developed CRDI system was relatively cheaper
because it uses cheaper high pressure CRDI pumps, injectors and smaller number of sensors (only
TDC sensor, engine speed sensor and exhaust gas sensor), which give their input to the injec-
tor driver circuit, which is relatively cheaper compared to an ECU. Using this architecture, the
cost of the system drastically reduced for this niche application, where there were very limited
operational challenges because the engine always operates at a constant speed of 1,500 rpm.
Engine load was varied by loading the alternator (figure 1). Volumetric fuel flow rate and
intake air flow rate were also measured. Raw exhaust gas composition was measured by using
exhaust gas emission analyzer (AVL, 444). The exhaust opacity was measured using smoke
opacimeter (AVL, 437). This instrument qualitatively determines the particulate present in
the engine exhaust. For in-cylinder pressure measurement, a piezoelectric pressure transducer
(Kistler Instruments, 6613CQ09-01) was mounted flush with the cylinder head. This pressure
transducer operates on a 7–32 V DC power supply and it can measure in-cylinder pressure in
the range of 0–75 bar (25 bars/volt). Cylinder pressure curve was pegged at 1 bar at the end of
suction stroke (−180
◦
CA). An inductive proximity sensor (Transducers and Allied Products,
GLP18APS) was used for TDC detection. A metallic strip was mounted on the camshaft such
that it passes in close proximity to that of proximity sensor while piston comes to TDC in
compression stroke, once in every cycle. An optical shaft encoder was mounted on the engine
Table 1. Technical specifications of the test engine.
Engine characteristics Specifications
Make/model Kirloskar/DM 10
Bore/stroke 102/115 mm
Power output 7.4 kW @ 1,500 rpm
Compression ratio 17.5
Displacement 975 cc
Inlet valve opening 4.5
◦
BTDC
Inlet valve closing 35.5
◦
ABDC
Exhaust valve opening 35.5
◦
BBDC
Exhaust valve closing 4.5
◦
ATDC

Development of low cost CRDI single cylinder diesel engine 1941
4
8
152
TDC sensor
7
6
LED
3
220 V AC
D1
D1
D2
D2
C1
C2
Transformer 1
Transformer 2
12 V DC
12 V DC
10
0
K
33 K
33 K
IC 555
Ground
1 nF
SL 100
2N 3055
IGBT
1 K
100 ohm
300 ohm
c
C
B
E
B
E
E
G
C
Injector signal
1 uF
LED
(a)
(b)
Figure 1. (a) Schematic of the experimental setup. (b) Circuit diagram of injector driver circuit.
1942 Avinash Kumar Agarwal et al
camshaft, which gives three output signals (A, B and Z). A and B signals were two pulses per
crank angle degree with 90
◦
phase shift. Z signal was one pulse per revolution of the engine
camshaft. A high speed combustion data acquisition system (Hi-Techniques, Synergy) was used,
which has eight channels (2MS/s, 16 bit digitizers for each channel), and it provides enough
bandwidth for engine combustion diagnostics.
For an unmodified engine with mechanical FIE system, ‘start of injection (SOI)’ was 30
◦
BTDC and the nozzle opening pressure was 200–205 bar, as per the manufacturer’s recommen-
dations. Keeping this in mind, test engine was operated at a constant speed of 1,500 rpm, with
280 bar fuel injection pressure at different loads in this study. Modified engine’s performance
and emissions were evaluated for varying SOI of 25
◦
,28
◦
,31
◦
,34
◦
,37
◦
, and 40
◦
CA BTDC at
different engine loads at 1,500 rpm engine speed. The results are present in the following section.
3. Results and discussion
3.1 Combustion characteristics
Combustion analysis is extremely important for engine design and analysis because it directly
affects the engine performance and emission characteristics, noise, vibrations and durability.
For the combustion characterization, in-cylinder combustion data was acquired vis-à-vis engine
crank shaft position using high speed data acquisition system for 100 consecutive engine cycles
and analysis was performed on an average data set obtained from data of these 100 cycles in
order to eliminate the effect of cycle to cycle variations. In-cylinder pressure, pressure rise rate,
heat release rate, cumulative heat release rate, mass burn fraction and combustion duration were
then calculated and all these parameters were compared for different SOI conditions.
3.1a In-cylinder pressure: The measurement of in-cylinder pressure is an important parameter
for understanding engine combustion. The analysis of in-cylinder pressure is used in finding
various engine combustion parameters such as heat release rate, cumulative heat release and
pressure rise rate. The in-cylinder pressure vs. crank angle for various SOI timings are shown in
figure 2 for different engine loads varying from no load to full load.
From these graphs, it is generally observed that advancing the SOI leads to higher in-cylinder
pressures at all engine loads. This trend is seen for most of the engine loads consistently except
1.5 and 2.1 kW, where highest in-cylinder pressures are seen for 30
◦
BTDC SOI. Advanced
SOI results in more time available for formation of premixed charge. Therefore, relatively larger
fraction of fuel is burnt in the premixed phase. Earlier SOI also leads to longer ignition delay due
to relatively colder conditions (lower pressures and temperatures) prevailing in the combustion
chamber at the time of start of fuel injection. Therefore higher fuel quantity is injected before the
start of combustion (SOC). Once combustion starts, higher in-cylinder temperature is attained
because of higher premixed heat release, which also leads to relatively higher peak in-cylinder
pressure. The peak in-cylinder pressure largely depends upon the fuel fraction burnt during the
premixed combustion phase.
Figure 3 shows variation in peak in-cylinder pressure and its crank angle position at various
SOI timings for different loads. It can be seen from figure 3 that peak cylinder pressure is higher
for advanced SOI timings compared to retarded ones. Peak in-cylinder pressure increased from
45.6 bar at no load to 46.9 bars at 3 kW load at 25
◦
BTDC SOI timing, whereas it increased from
51.3 bars at no load to 62.3 bars at 3 kW load at 40
◦
BTDC SOI timing. With increasing engine
load, peak cylinder pressure increased and its position shifted away from TDC due to higher

Development of low cost CRDI single cylinder diesel engine 1943
0
10
20
30
40
50
60
70
-45 -30 -15 0 15 30 45 60
Cylinder Pressure (bar)
Crank Angle (deg.)
0 kW
25˚ BTDC
28˚ BTDC
31˚ BTDC
34˚ BTDC
37˚ BTDC
40˚ BTDC
0
10
20
30
40
50
60
70
-45 -30 -15 0 15 30 45 60
Cylinder Pressure (bar)
Crank Angle (deg.)
1.5 kW
25˚ BTDC
28˚ BTDC
31˚ BTDC
34˚ BTDC
37˚ BTDC
40˚ BTDC
0
10
20
30
40
50
60
70
-45 -30 -15 0 15 30 45 60
Cylinder Pressure (bar)
Crank Angle (deg.)
2.1 kW
25˚ BTDC
28˚ BTDC
31˚ BTDC
34˚ BTDC
37˚ BTDC
40˚ BTDC
0
10
20
30
40
50
60
70
-45 -30 -15 0 15 30 45 60
Cylinder Pressure (bar)
Crank Angle (deg.)
2.7 kW
25˚ BTDC
28˚ BTDC
31˚ BTDC
34˚ BTDC
37˚ BTDC
40˚ BTDC
0
10
20
30
40
50
60
70
-45 -30 -15 0 15 30 45 60
Cylinder Pressure (bar)
Crank Angle (deg.)
3.3 kW
25˚ BTDC
28˚ BTDC
31˚ BTDC
34˚ BTDC
37˚ BTDC
40˚ BTDC
0
10
20
30
40
50
60
70
-45 -30 -15 0 15 30 45 60
Cylinder Pressure (bar)
Crank Angle (deg.)
3.8 kW
25˚ BTDC
28˚ BTDC
31˚ BTDC
34˚ BTDC
37˚ BTDC
40˚ BTDC
Figure 2. In-cylinder pressure vs. crank angle diagram for different SOI at varying engine loads.
fuel quantity being burnt, which results in longer combustion duration therefore the pressure
peak appears relatively later in the expansion stroke.
3.1b Rate of pressure rise: The rate of pressure rise is a parameter, which gives information
about the rate of force transfer due to in-cylinder combustion pressure exerted by burning and
expanding gases onto the mechanical linkages of the engine and has a direct bearing on engine’s
structural safety. Figure 4 shows the rate of pressure rise for different SOI timings at various
engine loads.
The rate of pressure rise reaches its maxima during premixed combustion phase due to rapid
combustion and very fast premixed heat release (figure 4). After attaining the maxima, it reduces
in the expansion stroke due to mixing controlled combustion, where the combustion is relatively
1944 Avinash Kumar Agarwal et al
40
45
50
55
60
65
70
0 0.5 1 1.5 2 2.5 3 3.5 4
Max Pressure (bar)
Brake Power (kW)
25˚ BTDC
28˚ BTDC
31˚ BTDC
34˚ BTDC
37˚ BTDC
40˚ BTDC
0
1
2
3
4
5
6
7
8
0 0.5 1 1.5 2 2.5 3 3.5 4
Crank Angle Position (deg)
Brake Power (kW)
25˚ BTDC
28˚ BTDC
31˚ BTDC
34˚ BTDC
37˚ BTDC
40˚ BTDC
Figure 3. Peak in-cylinder pressure and its position for various SOI timings at different loads.
slower in addition to increase in combustion chamber volume due to movement of piston in
expansion stroke. For advanced SOI timings, rate of pressure rise is much higher than that at
retarded SOI timings. Due to longer ignition delay, larger fuel quantity is accumulated in the
combustion chamber during this delay period. This leads to higher premixed charge available at
the time of beginning of premixed combustion. Combustion of this premixed charge therefore
yields relatively higher heat release rates and consequently higher pressure rise rates.
Figure 5 shows the variation in maximum rate of pressure rise and its crank angle position.
As the engine load increases, relatively higher in-cylinder temperature is seen, which reduces
the ignition delay. This leads to relative earlier ignition of premixed charge; hence, there will
be lesser fuel accumulation in the combustion chamber due to shorter ignition delay, leading to
reduction in pressure rise rate with increasing engine load. Peak of pressure rise rate shifts away
from the TDC (into the compression stroke) because of relatively slower combustion and heat
release in predominantly mixing controlled combustion phase at higher engine loads.
3.1c Heat release rate: Figure 6 shows the heat release rate at various SOI timings for different
loads. The graph indicates two distinct stages of heat release. The first is immediately after the
SOI to a point, where the heat release rate sharply drops. This is due to combustion primarily in
the premixed combustion phase. The second phase starts from the end of first phase (Premixed
combustion) to the end of combustion and this is called ‘mixing-controlled combustion phase’.
This is generally a slower heat release phase among the two, therefore, it spreads over a longer
combustion duration and is essentially controlled by the rate, at which, the fuel and air can mix
together inside the combustion chamber.
Heat release rate curve peak is seen to be higher for advanced SOI timings compared to the
one with retarded SOI timings because relatively higher fraction of the fuel quantity injected
burns in the premixed combustion phase for advanced SOI timings. This also explains the trends
of in-cylinder pressure and pressure rise rate curves observed earlier.
Figure 7 shows the maximum heat release rate and the crank angle position, at which max-
imum heat release rate takes place. At higher engine loads, the fraction of heat release taking
place in the mixing controlled combustion phase is higher because the ignition delay is shorter
for higher engine load. Therefore smaller fuel quantity is available in combustion chamber at
the time of premixed combustion, which lowers the peak and the crank angle position of this
peak of heat release rate also shifts towards TDC. Combustion of diesel is mainly dominated by

Development of low cost CRDI single cylinder diesel engine 1945
-2
0
2
4
6
8
-45 -30 -15 0 15 30 45 60
)ged/rab(etaResiRerusserP
Crank Angle (deg.)
0 kW
25˚ BTDC
28˚ BTDC
31˚ BTDC
34˚ BTDC
37˚ BTDC
40˚ BTDC
-2
0
2
4
6
8
-45 -30 -15 0 15 30 45 60
Pressure Rise Rate (bar/deg)
Crank Angle (deg.)
1.5 kW
25˚ BTDC
28˚ BTDC
31˚ BTDC
34˚ BTDC
37˚ BTDC
40˚ BTDC
-2
0
2
4
6
8
-45 -30 -15 0 15 30 45 60
)ged/rab(etaRes
i
RerusserP
Crank Angle (deg.)
2.1 kW
25˚ BTDC
28˚ BTDC
31˚ BTDC
34˚ BTDC
37˚ BTDC
40˚ BTDC
-2
0
2
4
6
8
-45 -30 -15 0 15 30 45 60
Pressure Rise Rate (bar/deg)
Crank Angle (deg.)
2.7 kW
25˚ BTDC
28˚ BTDC
31˚ BTDC
34˚ BTDC
37˚ BTDC
40˚ BTDC
-2
0
2
4
6
8
-45 -30 -15 0 15 30 45 60
)ged/rab
(etaR
esiRerusserP
Crank Angle (deg.)
3.3 kW
25˚ BTDC
28˚ BTDC
31˚ BTDC
34˚ BTDC
37˚ BTDC
40˚ BTDC
-2
0
2
4
6
8
-45 -30 -15 0 15 30 45 60
Pressure Rise Rate (bar/deg)
Crank Angle (deg.)
3.8 kW
25˚ BTDC
28˚ BTDC
31˚ BTDC
34˚ BTDC
37˚ BTDC
40˚ BTDC
Figure 4. Pressure rise rate vs. Crank angle for various SOI timings at different loads.
mixing-controlled combustion at higher engine loads; however, the HRR is slower for this phase
therefore it is not seen as a peak (Maxima) in these figures.
3.1d Mass burn fraction (MBF) and combustion duration: Mass burn fraction and other
calculations are done based on standard assumptions made for thermodynamic analysis of diesel
engine combustion. Figure 8 shows the crank angle position for 5 and 95% mass burn fractions
(MBF) for various SOI timings at different loads. Advanced fuel injection timings show earlier
combustion (fuel mass burn) compared to retarded SOI timings. Timing for 5% MBF is generally
regarded as ‘start of combustion (SOC)’ and 95% MBF is generally regarded as ‘end of combus-
tion (EOC)’ and the crank angle duration between these two MBFs is considered as ‘combustion

1946 Avinash Kumar Agarwal et al
0
1
2
3
4
5
6
7
8
0 0.5 1 1.5 2 2.5 3 3.5 4
)ged/rab(etaResiRe
russerP
Brake Power (kW)
25˚ BTDC 28˚ BTDC
31˚ BTDC 34˚ BTDC
37˚ BTDC 40˚ BTDC
-11
-9
-7
-5
-3
-1
0 0.5 1 1.5 2 2.5 3 3.5 4
Crank Angle Position (deg)
Brake Power (kW)
25˚ BTDC 28˚ BTDC
31˚ BTDC 34˚ BTDC
37˚ BTDC 40˚ BTDC
Figure 5. Maximum rate of pressure rise and its position for various SOI timings at different loads.
duration’. With increasing engine load, the crank angle position shifts away from TDC due to
increase in fuel quantity injected, leading to longer combustion duration. One can also observe
that with increasing engine load, 5% MBF timing shifts earlier i.e. the combustion starts earlier
during the compression stroke. This is indicated in previous sections also.
Combustion duration for different SOI timings is shown in figure 9. This figure indicates
that the combustion duration increases with increasing engine load. This is primarily because of
relatively higher fuel quantity injected with increasing engine load, which takes longer time to
burn in premixed and mixing controlled phases put together.
Combustion duration is higher for advanced SOI timings, except 40
◦
BTDC SOI. However
for higher engine load (3.8 kW), combustion duration is higher for retarded SOI timings due to
combustion of higher fuel fraction taking place in the expansion stroke.
3.2 Performance characteristics
The engine performance of this newly developed CRDI system is evaluated by performing
experiments and calculating parameters such as brake thermal efficiency (BTE) and exhaust
gas temperature. The experiments are done three times at each load–speed combination and an
average value is reported. Error bars represent accuracy of the reported data calculated from
uncertainty values derived from accuracy of the instruments used in this investigation. BTE
shows the fraction of thermal energy of fuel, which is converted into useful mechanical power
by the engine at given engine operating conditions.
3.2a Brake thermal efficiency (BTE): Brake thermal efficiency of the engine is inversely pro-
portional to the brake specific fuel consumption (BSFC), when a single fuel is being used,
therefore BSFC is not calculated separately in this study. Figure 10 shows the trends for BTE v/s
engine load for varying SOI timings at different engine loads.
BTE increased up to maxima (close to 3.5 kW; figure 10) and then it started to decrease for
all SOI timings. One can note from figure 10 that at 34
◦
BTDC SOI timing, highest BTE for
all engine loads is observed. With retarded and advanced fuel injection timings than 34
◦
BTDC
SOI timing, BTE tends to decrease. Since maximum BTE is obtained at 34
◦
BTDC SOI, this
is an optimum SOI timing for this newly developed single cylinder CRDI engine for all loads
at 1,500 rpm. With retarded injection timings, there is significant fraction of fuel available for
mixing controlled combustion as well as late combustion phase and the combustion extends

Development of low cost CRDI single cylinder diesel engine 1947
-20
0
20
40
60
80
100
120
-45 -30 -15 0 15 30 45 60
m/Jk(etaResaeleRtaeH
3
-deg)
Crank Angle (deg.)
0 kW
25˚ BTDC
28˚ BTDC
31˚ BTDC
34˚ BTDC
37˚ BTDC
40˚ BTDC
-20
0
20
40
60
80
100
120
-45 -30 -15 0 15 30 45 60
Heat Release Rate (kJ/m
3
-deg)
Crank Angle (deg.)
1.5 kW
25˚ BTDC
28˚ BTDC
31˚ BTDC
34˚ BTDC
37˚ BTDC
40˚ BTDC
-20
0
20
40
60
80
100
120
-45 -30 -15 0 15 30 45 60
m/Jk(etaResaeleRtaeH
3
-deg)
Crank Angle (deg.)
2.1 kW
25˚ BTDC
28˚ BTDC
31˚ BTDC
34˚ BTDC
37˚ BTDC
40˚ BTDC
-20
0
20
40
60
80
100
120
-45 -30 -15 0 15 30 45 60
Heat Release Rate (kJ/m
3
-deg)
Crank Angle (deg.)
2.7 kW
25˚ BTDC
28˚ BTDC
31˚ BTDC
34˚ BTDC
37˚ BTDC
40˚ BTDC
-20
0
20
40
60
80
100
120
-45 -30 -15 0 15 30 45 60
m/Jk(etaResaeleRtaeH
3
-deg)
Crank An
g
le (de
g
.)
3.3 kW
25˚ BTDC
28˚ BTDC
31˚ BTDC
34˚ BTDC
37˚ BTDC
40˚ BTDC
-20
0
20
40
60
80
100
120
-45 -30 -15 0 15 30 45 60
Heat Release Rate (kJ/m
3
-
deg)
Crank An
g
le (de
g
.)
3.8 kW
25˚ BTDC
28˚ BTDC
31˚ BTDC
34˚ BTDC
37˚ BTDC
40˚ BTDC
Figure 6. Heat release rate for various SOI timings at different loads.
well into the expansion stroke. This leads to effective reduction in the pressure force exerted
by the combusting gases on the engine piston pushing it downward during the expansion stroke
because of increased combustion chamber volume. Therefore this effectively reduced the BTE.
With advanced SOI timings, combustion occurs relatively earlier, and the pressure exerted by
combusting gases actually opposes the piston motion upwards (towards the TDC) during the
compression stroke, which effectively leads to reduction in engine power output therefore it
reduces the BTE.
3.2b Exhaust gas temperature: The exhaust gas temperature for different SOI timings for
varying engine loads is shown in figure 11.

1948 Avinash Kumar Agarwal et al
25
50
75
100
125
150
0 0.5 1 1.5 2 2.5 3 3.5 4
m/Jk(es
aeleRtaeHxaM
3
-deg)
Brake Power (kW)
25˚ BTDC 28˚ BTDC
31˚ BTDC 34˚ BTDC
37˚ BTDC 40˚ BTDC
-9
-8
-7
-6
-5
-4
-3
-2
-1
0
1
0 0.5 1 1.5 2 2.5 3 3.5 4
Crank Angle Position (deg)
Brake Power (kW)
25˚ BTDC 28˚ BTDC
31˚ BTDC 34˚ BTDC
37˚ BTDC 40˚ BTDC
Figure 7. Maximum heat release rate and its crank angle position for various SOI timings at different
loads.
-12
-10
-8
-6
-4
-2
0
0 0.5 1 1.5 2 2.5 3 3.5 4
)ged(elgnAknarCFBM%5
Brake Power (kW)
25˚ BTDC 28˚ BTDC
31˚ BTDC 34˚ BTDC
37˚ BTDC 40˚ BTDC
25
30
35
40
45
50
00.5 11.522.533.54
95% MBF Crank Angle (deg)
Brake Power (kW)
25˚ BTDC 28˚ BTDC
31˚ BTDC 34˚ BTDC
37˚ BTDC 40˚ BTDC
Figure 8. Five and 95% MBF timings for various SOI timings at different loads.
35
38
41
44
47
50
53
0 0.5 1 1.5 2 2.5 3 3.5 4
Combustion Duration (deg)
Brake Power (kW)
25˚ BTDC 28˚ BTDC
31˚ BTDC 34˚ BTDC
37˚ BTDC 40˚ BTDC
Figure 9. Combustion duration for various SOI timings at different loads.
Exhaust gas temperature increases with increasing engine load. This is because higher fuel
quantity is injected at higher engine loads. Injection duration for higher fuel quantity is longer
because the fuel is injected at constant pressure from the high pressure fuel rail. For longer

Development of low cost CRDI single cylinder diesel engine 1949
0
5
10
15
20
25
30
0 0.5 1 1.5 2 2.5 3 3.5 4
Brake Thermal Efficiency (%)
Brake Power (kW)
25˚ BTDC
28˚ BTDC
31˚ BTDC
34˚ BTDC
37˚ BTDC
40˚ BTDC
Figure 10. BTE of the engine for various SOI timings at different loads.
fuel injection duration, premixed combustion phase shortens and mixing controlled combustion
phase elongates as seen earlier, and large amount of heat is released in mixing controlled and
late combustion phases. It can be seen from figure 11 that by retarding the SOI timings, major
part of combustion takes place in mixing controlled combustion phase therefore the combustion
duration becomes longer, leading to the higher temperatures of the exhaust gases at the engine
exhaust gas outlet.
3.3 Emissions characteristics
Emissions characteristics of the newly developed CRDI FIE system can be assessed by mea-
suring the raw emissions of oxides of nitrogen (NO
x
), unburnt hydrocarbons (HC), carbon
monoxide (CO) and Smoke opacity and reporting them as mass emissions.
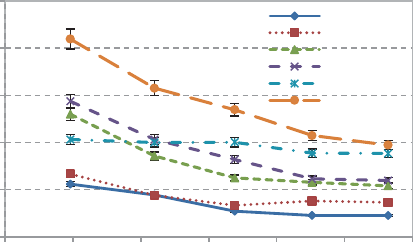
3.3a BSNO
x
emissions: The formation of NO
x
in CI engines is largely dependent on the
overall oxygen concentration in the combustible mixture, peak cylinder temperatures, and the
residence time of the combusting mixture at the peak cylinder temperature. The variation in mass
0
100
200
300
400
500
600
0 0.5 1 1.5 2 2.5 3 3.5 4
Exhaust Gas Temperature (
o
C)
Brake Power (kW)
25˚ BTDC
28˚ BTDC
31˚ BTDC
34˚ BTDC
37˚ BTDC
40˚ BTDC
Figure 11. Exhaust gas temperature for various SOI timings at different loads.
1950 Avinash Kumar Agarwal et al
emission of NO
x
for different SOI timings in this newly developed CRDI engine is shown in
figure 12. The results showed that there is overall reduction in the mass emission of NO
x
with
increasing engine loads. There are several factors responsible for reduction in mass emission
of NO
x
with increasing engine load namely: (i) reduction in oxygen concentration in the com-
bustible mixture because of higher fuel quantity being injected; (ii) increase in turbulence level
at higher engine loads, resulting in lower residence time for NO
x
specific reactions; and (iii) rela-
tively lower combustion temperatures for richer fuel–air mixtures because of longer combustion
durations and heat release rates. Advanced SOI timings result in relatively higher BSNO
x
emis-
sions due to higher heat release rate in premixed combustion phase, which leads to very high
peak combustion pressures and temperatures.
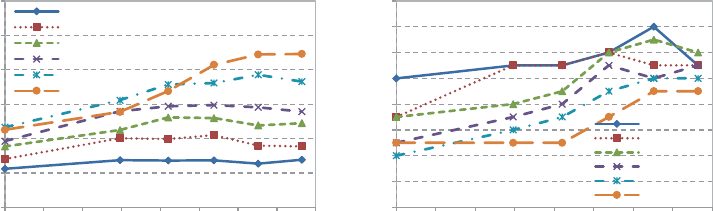
3.3b BSHC emissions: HC emissions from the engine are mainly because of incomplete com-
bustion of fuel in the combustion chamber and partial combustion of lubricating oil being thrown
into the combustion chamber because of piston and ring dynamics. Richer as well as leaner
fuel–air mixtures, both lead to hydrocarbon emissions, due to lesser availability of oxygen in the
combustion zone and misfires respectively. Variations in BSHC emissions at different SOI tim-
ings for varying engine loads are shown in figure 13. At lower engine loads, BSHC emissions are
relatively higher for all SOI timings due to lower engine output power (which is a denominator,
while calculating the brake specific mass emissions). With increasing engine load, BSHC emis-
sions wither remain constant or decrease. They start increasing again, at further higher engine
loads. At higher engine loads, more fuel quantity is injected into the combustion chamber with
a constant mass of intake air (because of constant engine speed). As a result, the fuel–air mix-
ture becomes richer in various zones in the combustion chamber with increasing engine load,
leading to higher HC emissions. Figure 13 also suggests that with retarded SOI timings, mass
emission of HC is higher in comparison to advanced SOI timings. This happens due to delayed
SOC and relatively slower heat release rates for the combustible charge at retarded SOI timings.
Inconsistent HC emissions for 37
◦
SOI timings are observed in figure 13 because of beginning
of knocking combustion in these conditions.
0
5
10
15
20
25
1 1.5 2 2.5 3 3.5 4
BSNOx (g/kWh)
Brake Power (kW)
25˚ BTDC
28˚ BTDC
31˚ BTDC
34˚ BTDC
37˚ BTDC
40˚ BTDC
Figure 12. BSNO
x
emissions for various SOI timings at different loads.

Development of low cost CRDI single cylinder diesel engine 1951
0
2
4
6
8
1 1.5 2 2.5 3 3.5 4
BSHC (g/kWh)
Brake Power (kW)
25˚ BTDC 28˚ BTDC
31˚ BTDC 34˚ BTDC
37˚ BTDC 40˚ BTDC
Figure 13. BSHC emissions for various SOI timings at different loads.
3.3c BSCO emissions: CO is an intermediate combustion product formed due to incomplete
combustion of hydrocarbon fuels. CO emissions are largely affected by the stoichiometry. Mass
emissions of CO at varying engine loads for different SOI timings are shown in figure 14.
Figure 14 shows that at lower engine loads, BSCO emissions were lower. BSCO emissions
increase with increasing engine loads sharply towards the higher loads. As engine load increases,
relative fuel–air ratio also increases, resulting in richer heterogeneous combustion, which leads
to inefficient mixing of fuel and air, resulting in higher CO emissions under high engine load con-
ditions. There is no significant effect of SOI timings on BSCO emissions in this newly developed
CRDI system.
3.3d Smoke opacity: The variation of smoke opacity for different engine operating conditions
for all SOI timings is shown in figure 15. There is an overall increase in smoke opacity with
increasing engine load, which indicates that the exhaust stream is having higher particulate
emissions. Increasing engine load results in an increase in fuel–air equivalence ratio and longer
mixing controlled combustion phase, which results in higher combustion temperatures as well
0
20
40
60
80
100
120
1 1.5 2 2.5 3 3.5 4
BSCO (g/kWh)
Brake Power (kW)
25˚ BTDC
28˚ BTDC
31˚ BTDC
34˚ BTDC
37˚ BTDC
40˚ BTDC
Figure 14. BSCO emissions for various SOI timings at different loads.

1952 Avinash Kumar Agarwal et al
0
20
40
60
80
100
120
0 0.5 1 1.5 2 2.5 3 3.5 4
Smoke Opacity (%)
Brake Power (kW)
25˚ BTDC
28˚ BTDC
31˚ BTDC
34˚ BTDC
37˚ BTDC
40˚ BTDC
Figure 15. Smoke opacity for various SOI timings at different loads.
as lower oxygen concentration in the engine combustion chamber, therefore the smoke opac-
ity increases. It is evident from the figure that SOI timings play a vital role in smoke opacity
i.e. soot formation. Retarded SOI timings increase smoke opacity due to lower in-cylinder com-
bustion temperatures and reduction in the time available for oxidation and re-burning of soot
already formed during expansion stroke. Advanced SOI timings lead to more complete combus-
tion at relatively elevated in-cylinder temperatures, resulting in lower soot opacity. These trends
are exactly opposite to the ones observed for BSNO
x
emissions.
4. Conclusions
In this study, a simple and cheaper version of CRDI FIE system for single cylinder, constant
speed engines was successfully developed. The ECU and large number of sensors of conven-
tional CRDI system were replaced by simpler electronic circuits and basic sensors in order to
control the cost of the system. Effect of SOI timings on this new engine’s performance, emis-
sions and combustion characteristics was experimentally investigated. Advanced SOI timings
showed higher in-cylinder pressures, higher pressure rise rates and higher heat release rates, pri-
marily due to relatively longer ignition delays. As the engine load increases, relative contribution
of premixed combustion phase to the total heat release decreases due to reduction in ignition
delay and mixing controlled combustion phase starts to dominate the engine combustion and
total heat release process. Maximum heat release rate and peak cylinder pressure shifts away
from TDC. For retarded SOI timings, due to the late combustion, peak pressure occurs later in
the expansion stroke of this CRDI engine. 34
◦
BTDC SOI gives best thermal efficiency. Any
variation in SOI timings in either direction leads to a fuel penalty. The exhaust gas temperatures
were found to increase at retarded SOI timings. For advanced SOI conditions, lower BSHC and
higher BSNO
x
emissions were observed. There is no significant effect of SOI timings on BSCO
emissions. Smoke opacity increases with retarded fuel injection due to reduction in combustion
chamber temperatures. Overall, a simpler CRDI system for single cylinder engines with sim-
pler control strategies is effective in getting the desired emissions and fuel economy benefits for
cheaper engine application niche markets.
Development of low cost CRDI single cylinder diesel engine 1953
Acknowledgements
Financial support from CSIR through their grant Sanction Letter No. 37(1505)/11/EMR-II
dated 22 December 2011 for conducting this investigation is gratefully acknowledged and
appreciated.
References
Block B, Westphal H, Oppermann W, Hentschel W, Henning H and Kutschera I 2002 Optical detection of
the combustion produced by the pre-injected fuel in a DI diesel engine, SAE Paper 2002-01-2667
Cheng W T, Sub H J, Xie X, Chia L M, Henein N A, Schwarz E and Bryzik W 1999 Direct visualization
of high pressure diesel spray and engine combustion, SAE Paper 1999-01-3496
Desantes J M, Arregle J, Lopez J J and Garcia A 2007 A comprehensive study of diesel combustion and
emissions with post-injection, SAE Paper 2007-01-0915
Eblen E and Stumpp G 1978 Beitrag des Einspritz systems zur Verbesserung des Diesel motors, Bosch
Techn. Berichte Band 6, Heft 2
Endres H, Dumholz M and Frisse P 1994 Pre-injection: A measure to optimize the emission behavior of
DI-diesel engines, SAE Paper 940674
Henein N A, Lai M C, Singh I, Wang D and Liu L 2001 Emissions trade off and combustion characteristics
of a high speed direct injection diesel engine, SAE Paper 2001-01-0197
Ishiwata H, Ohishi T, Ryuzaki K, Unoki K and Kitahara N 1994 A feasibility study of pilot injection in
TICS, SAE Paper 940195
Kohketsu S, Mori K, Kato T and Sakai K 1994 Technology for low emission, combustion noise and fuel
consumption on diesel engine, SAE Paper 940672
Kong S C and Karra P K 2008 Diesel emission characteristics using high injection pressure with converging
nozzles in a medium-duty engine, SAE Paper 2008-01-1085
Koyanagi K, Oing H, Renner G and Maly R 1999 Optimizing common rail-injection by optical diagnostics
in a transparent production type diesel engine, SAE Paper 1999-01-3646
Miyaki M, Fujisawa H, Masuda A and Yamamota Y 1991 Development of new electronically controlled
fuel injection system ECD-U2 for diesel engines, SAE Paper 910251
Nakakita K, Kondoh T, Ohsawa K, Takahashi T and Watanabe S 1992 Optimization of pilot injection
pattern and its effect on diesel combustion with high-pressure injection. JSME Int. J. Series B – Fluids
Thermal Eng. 37: 966–973
Riaud J C and Lavoisier F 2002 Optimizing the multiple injection settings on an HSDI diesel engine. In:
THIESEL conference on Thermo and Fluid Dynamic Processes in Diesel Engines
Rinolf R, Imarisio R and Buratti R 1995 The potential of a new common rail diesel fuel injection system for
the next generation of DI diesel engines, 16 Internationales Wiener Motoren symposium, VDI- Verlag
Reihe 12 Nr. 239
Robert Bosch 2006 GmbH, Diesel-engine management. John Wiley and Sons Inc., UK, 72 Pages
Schubiger R, Bertola A and Boulouchos K 2001 Influence of EGR on combustion and exhaust emissions of
heavy duty DI-diesel engines equipped with common-rail injection systems, SAE Paper 2001-01-3497
Shimada T, Shoji T and Takeda Y 1989 The effect of fuel injection pressure on diesel engine performance,
SAE Paper 891919
Shundoh S, Komori M, Tsujimura K and Kobayashi S 1992 NOx reduction from diesel combustion using
pilot injection with high pressure fuel injection, SAE Paper 920461
Thirouard M, Pacaud P, Ambrazas D, Chmielarczyk V, Mendez S, Garsi C, Lavoisier F and Barbeau 2009
Potential to improve specific power using very high injection pressure in HSDI Diesel engines, SAE
Paper 2009-01-1524
Tow T, Pierpont D A and Reitz R D 1994 Reducing particulates and NOx emissions by using multiple
injections in a heavy duty DI diesel engine, SAE Paper 940897
1954 Avinash Kumar Agarwal et al
Tsurushima T, Zhang L and Ishi Y 1999 A study of unburnt hydrocarbon emissions in small di diesel
engine, SAE Paper 1999-01-0512
Uchida N, Shimokawa K, Kudo Y and Smimoda M 1998 Combustion optimization by means of common
rail injection system for heavy duty diesel engines, SAE Paper 982679
Zhang L 1999 A study of pilot injection in a DI diesel engine, SAE Paper 1999-01-3493
