
Overview of Evaluation Methods for R&D Programs
Overview of Evaluation
Methods for R&D
Programs
A Directory of Evaluation Methods Relevant to Technology
Development Programs
Prepared for
U.S. Department of Energy
Office of Energy Efficiency and Renewable Energy
March 2007
by
Rosalie Ruegg, TIA Consulting, Inc.
Gretchen Jordan, Sandia National Laboratories
Overview of Evaluation Methods for R&D Programs
Overview of Evaluation Methods for R&D Programs
Acknowledgements
This booklet introducing managers to a variety of methods for evaluating research and
development (R&D) programs was completed for the U.S. Department of Energy (DOE) by
Sandia National Laboratories, Albuquerque, New Mexico, USA under Contract DE-AC04-
94AL8500. Sandia is operated by Sandia Corporation, a subsidiary of Lockheed Martin
Corporation. Jeff Dowd of DOE’s Office of Energy Efficiency and Renewable Energy (EERE),
Office of Planning, Budget and Analysis (OPBA) directed the work. Rosalie Ruegg of TIA
Consulting, Inc. was principal author and she was assisted by Gretchen Jordan of Sandia National
Laboratories. Joe Roop of Pacific Northwest National Laboratories contributed the section on
tracking commercialization of technologies. EERE OPBA also acknowledges the guidance of Sam
Baldwin, EERE Chief Technology Officer in the production of this booklet. OPBA also thanks
Yaw Agyeman of TMS Inc. for his review of the booklet and assistance in preparing it for
publication.
Notice
This document was prepared as an account of work sponsored by an agency of the United States
government. Neither the United States government nor any agency thereof, nor any of their
employees, makes any warranty, express or implied, or assumes any legal liability or
responsibility for the accuracy, completeness, or usefulness of any information, apparatus, product,
or process disclosed, or represents that its use would not infringe privately owned rights.
Reference herein to any specific commercial product, process, or service by trade name, trademark,
manufacturer, or otherwise does not necessarily constitute or imply its endorsement,
recommendation, or favoring by the United States government or any agency thereof. The views
and opinions of authors expressed herein do not necessarily state or reflect those of the United
States government or any agency thereof.
i
Overview of Evaluation Methods for R&D Programs
Preface
The aim of this booklet is to provide a starting point for managers to become aware of and access
the best evaluation methods for their needs.
Technology development programs in DOE extensively and successfully utilize peer review to
evaluate research and development (R&D) activities at the project and program levels. In addition
to peer review, R&D Program Managers are encouraged to use other evaluation methods in order
to obtain information on program effectiveness and realized benefits that cannot be provided using
the peer review method.
The potential benefits of periodically doing systematic studies using other R&D evaluation
methods are considerable. Programs could:
• Generate additional important information for use in continuous program improvement
• Document knowledge benefits that are often unaccounted for when communicating
programs’ value to stakeholders
• Document realized market benefits associated with past research successes
• Better answer questions about cost-effectiveness of the longer term research
This booklet provides an overview of 14 evaluation methods that have proven useful to R&D
program managers in Federal agencies. Each method is briefly defined, its uses are explained, its
limitations are listed, examples of successful use by other R&D managers are provided, and
references are given. The examples are for successful applications of the R&D evaluation
methods taken from evaluation reports by organizations such as DOE’s Office of Energy
Efficiency and Renewable Energy, DOE’s Office of Science, the National Science Foundation, the
National Institute of Standards and Technology, and the National Research Council.
The questions a program could ask and answer and the multiple lines of evidence generated by
using a variety of R&D evaluation methods would improve program planning and implementation
and strengthen the defense of programs with OMB and Congress.
ii
Overview of Evaluation Methods for R&D Programs
Table of Contents
Notice ..................................................................................................................................... i
Preface................................................................................................................................... ii
Table of Contents ................................................................................................................. iii
Part I. R&D Evaluation and Its Benefits ....................................................................................1
1.1 Increasing Program Manager Information on Program Performance.............................1
1.2 How this Booklet Can Help You Get the Information You Need...................................2
1.3 Why Use a Variety of Evaluation Methods?...................................................................2
1.4 Use of Evaluation by Federal R&D Agencies ................................................................3
1.5 Determining Your Specific Evaluation Needs ................................................................3
1.6 A Roadmap for Using this Booklet to Broaden Evaluation ............................................5
1.7 Additional Considerations in Evaluation ........................................................................8
Part II. Overview of Selected Research Evaluation Methods.................................................17
2.1 Peer Review/Expert Judgment .......................................................................................18
2.2 Monitoring, Data Compilation, and Use of “Indicators” ..............................................24
2.3 Bibliometric Methods – Counts and Citation Analysis.................................................32
2.4 Bibliometric Methods – Data Mining ...........................................................................43
2.5 Bibliometrics -- Hotspot Patent Analysis......................................................................48
2.6 Network Analysis..........................................................................................................55
2.7 Case Study Method .......................................................................................................61
2.8 Survey Method ..............................................................................................................66
2.9 Benchmarking Method..................................................................................................72
2.10 Technology Commercialization Tracking Method .....................................................76
2.11 Benefit-Cost Case Study .............................................................................................83
2.12 Econometric Methods .................................................................................................93
2.13 Historical Tracing Method ..........................................................................................99
2.14 Spillover Analysis Using a Combination of Methods...............................................103
iii
Overview of Evaluation Methods for R&D Programs
iv

Overview of Evaluation Methods for R&D Programs
Part I. R&D Evaluation and Its Benefits
1.1 Increasing Program Manager Information on Program Performance
R&D program managers are close to the projects and activities that make up their programs. They
typically are able to relate the ins-and-outs and smallest details to others. They work hard to make
their programs succeed. Yet, they may lack information in the form needed to describe and
document the benefits their programs are producing -- particularly in the interim period after their
direct involvement with projects and other program activities ends and in the longer run when
knowledge and/or market impacts are achieved.
Program managers may need to know,
• If their research is being done right (e.g., has high quality and research efficiency)
• If the program’s R&D efforts are focused on the right research areas.
• How program-created knowledge finds varied applications that generate additional benefits
to the nation.
• How collaborations and other activities stimulated by the program have affected the
nation’s R&D capabilities.
• How their programs are providing benefits to the users of resulting energy-saving and
energy-producing innovations.
• How their programs are enhancing energy security by providing alternative energy sources,
protecting existing sources and having options ready for deployment if warranted by
changing circumstances.
• If their past efforts were worth it and if planned new initiatives will be worth it.
Having this information when it is needed is essential to the long-run success of their programs.
Evaluation can equip program managers with the information needed to improve their programs
and to communicate effectively to others the full range of benefits from R&D efforts. The
inability to fully communicate program impacts translates into too few resources for that program.
“The more that those responsible for research can show that they offer value for money, the more
credible the case for increased resources becomes.”
1
The ultimate goal of a technology development R&D manager is to complete research objectives
that lead to successfully commercialized technologies. In addition to that ultimate goal, two other
goals of a successful program manager are: to continuously improve the program and to
communicate effectively to others the benefits of his or her program. These two goals are
incorporated into an icon that is used in Part 2 of the booklet to remind program managers about
how the various evaluation methods presented can be used to meet their goals.
1
Luke Georghiou (Professor of Science and Technology Policy and Management, University of Manchester), 2006.
1

Overview of Evaluation Methods for R&D Programs
1.2 How this Booklet Can Help You Get the Information You Need
This booklet provides a quick reference guide to evaluation methods for R&D managers in the
U.S. Department of Energy’s Technology Development programs.
2
While peer review is the form
of R&D evaluation most frequently used by R&D managers, there are other evaluation methods
which are also useful—particularly for estimating program outcomes and impacts retrospectively.
This booklet provides an overview of 14 evaluation methods that have proven useful to R&D
program managers in Federal agencies. Each method is briefly defined, its uses are explained, its
limitations are listed, examples of its successful use by other R&D managers are provided, and
references are given.
The aim is to provide a starting point for managers to become aware of, identify, and access the
best evaluation methods for their needs. It is not to provide a comprehensive treatment of the
methods or step-by-step guidance on how to do a study using a given method. Rather, the booklet
serves the first step in evaluation—determining the kind of study and method that will best serve
your needs.
R&D managers interested in pursuing an evaluation study that uses one of the methods described
in this booklet can contact evaluation professionals in their organization to get assistance with
planning and organizing the study and selecting a reliable independent evaluator to conduct it.
3
The booklet is organized in two parts. The remainder of this first part provides context for
understanding how to select among the various evaluation methods. It presents tables and
graphics that together serve as a quick reference roadmap to accessing the methods in the second
part. It also presents background information on R&D evaluation. Then, the second part presents
overviews of 14 evaluation methods. The methods described in Part 2 of this booklet may be
extended at a later time as other new and useful evaluation methods for R&D program managers
are identified.
1.3 Why Use a Variety of Evaluation Methods?
The short answer is that it takes a variety of methods to answer different types of project
management questions. Furthermore, use of a variety of methods provides multiple “lines of
evidence” and multiple lines of evidence often deepen understanding and strengthen arguments.
Evaluation is an essential tool for good management practice. It is a tool that not only helps
measure a program’s success, but also contributes to its success. Evaluation helps managers plan,
verify, and communicate what they aim to do, decide how to allocate resources, learn how best to
modify or redesign programs, and estimate the resulting program outputs, outcomes, and impacts.
Evaluation also provides information for accountability: Did we do what we said we would do?
Peer review/expert judgment, for example, helps a R&D manager answer questions about research
quality, relevance, and management. It helps R&D managers learn how to design and redesign
program elements and processes, to select projects, to decide whether to continue or discontinue
projects, and how best to modify the research direction of the R&D portfolio. Network analysis is
2
For example, applied energy R&D programs. Applied research is defined by OMB as the systematic study to gain
knowledge or understanding necessary to determine the means by which a recognized and specific need may be met.
3
In EERE, dedicated evaluation staff are located in Office of Planning, Budget and Analysis (OPBA).
2
Overview of Evaluation Methods for R&D Programs
useful for answering questions about a program’s impact on collaborative research and the
dissemination of knowledge—particularly tacit knowledge. Surveys are useful in answering a
host of questions, such as how satisfied are the program’s customers and how are customers using
program outputs. Citation analysis helps document the linkages between a program’s outputs and
downstream users. Economic case studies can estimate the benefits and costs of program outputs,
including those measurable in monetary terms and those more difficult to measure such as
environmental effects and energy security effects. Benchmarking can help identify where and
how to make improvements by comparing a program with its counterparts abroad. Econometric
methods can help demonstrate that it was the program that caused an outcome and not something
else. Using these and other methods can help a program manager better understand and manage
his or her program so as to achieve its goals, and obtain results needed to communicate
achievements to others.
1.4 Use of Evaluation by Federal R&D Agencies
Use of research evaluation in R&D programs—including multiple evaluation methods—is
widespread among public science and technology agencies. This was demonstrated in 2002, in a
benchmarking workshop in the U.S sponsored by TEKES, the national technology agency of
Finland, which compared the evaluation efforts of five U.S. science programs or agencies—
National Science Foundation (NSF), National Institute of Health (NIH), the Department of
Energy’s (DOE’s) Office of Science, DOE’s EERE, and the National Institute of Standards and
Technology’s (NIST’s) Advanced Technology Program (ATP)—as well as science programs in
Canada, Israel, and Finland. The workshop compared these R&D programs in terms of drivers of
evaluation, evaluation methods used, obstacles encountered, and other aspects. Table 1-1 shows a
benchmarking comparison of the diversity of evaluation methods reportedly used by these
organizations as of 2002. You may notice there are opportunities for DOE applied R&D programs
to take advantage of the full range of evaluation methods commonly found useful by research
programs in Federal agencies.
1.5 Determining Your Specific Evaluation Needs
The key question to ask yourself is “Who needs to know what about my program and when?”
You and other program staff are one audience. Senior DOE managers and external parties such as
OMB and Congress are among the other audiences. Generally speaking, program managers are
interested in information about progress and how to improve programs, while senior managers,
OMB staff, and members of Congress are more interested in program outcomes and impacts that
can be attributed to a policy and to questions such as “was it worth it?” In DOE’s EERE, the
current multi-year planning guidance suggests that the program manager have an evaluation
strategy that lays out a plan for answering the most important questions for both types of
audiences over a period of years.
3

Overview of Evaluation Methods for R&D Programs
Table 1-1. Methods of Evaluation Used by the Participating Programs
Methods Used NSF NIH DOE/
OS
DOE/
EERE
4
ATP Tekes IRAP
Surveys X X X X X X X
Case Study/Impact
Analysis
X X X X X X X
Expert Panels, Peer
Review, & Focus Groups
X X X X X
Indicator Metrics X X X X X
Bibliometrics X X X X
Historical Tracing X X X
Econometrics X X X
Benchmarking X X X X X
Network Analysis X X
Scorecard X X X
Mission/Outcome
Mapping
X
Options Theory X
Foresighting X
Composite Performance
Rating System
X
Cost-index method X
Market Assessment X
Source: Workshop Proceedings, 2002.
Note: Methods used were not identified for Israel’s MAGNET program, and this tabulation likely understates the use
of methods by Canada’s IRAP.
The big questions that require answers can be shown in a very simple diagram of the logic of
publicly funded R&D programs, such as that shown in Figure 1-1.
Before defining specific questions, we recommend you review your program’s detailed logic with
evaluation in mind (or prepare a logic model if you do not already have one). The review can help
you identify the most pressing questions and the audiences for the answers.
As the high-level depiction of Figure 1-1 suggests, some questions important for program
management occur early in the process, some during the interim period, and others further
downstream. Early in the chain, for example, a program manager may wish to track outputs and
assess the formation of research relationships using bibliometric and network analysis methods.
Later, he or she may wish to conduct a survey to determine industry awareness and use of program
outputs. Descriptive case studies may be useful in understanding better the path by which a
particular program innovation is adapted by industry and identifying specific barriers that may
need to be overcome. A hotspot patent analysis can show whether the patents issued by program
researchers are among those heavily cited by others, indicating a burst of interest in the technology
area. Farther out, a historical tracing study may tie program research to important industry
developments, and an economic cluster study may help quantify dollar benefits of the program’s
research in a given field. Also farther out, an econometric study may be desired to measure the
program’s contribution to improvements in the nation’s fuel efficiency and to the environment. A
DOE’s EERE is primarily an applied research program.
4
4

Overview of Evaluation Methods for R&D Programs
broadly cast benefit-cost study may help to capture a variety of effects, including option benefits
that provide protection in the face of possible future developments.
A program’s “outcomes” and “impacts” are influenced by many factors beyond a program’s
control such as private-sector use of the program’s outputs, domestic and foreign investment in
competing technologies, market prices—such as prices for fuels and other technologies, public
policies, laws, and regulations, as well as other factors. Hence, impact evaluations must consider
the roles of important external factors on a program’s results.
1.6 A Roadmap for Using this Booklet to Broaden Evaluation
The program manager’s questions, such as those identified in short-hand form in Figure 1-1 in the
context of the high-level R&D Logic Model, drive the choice of evaluation methods. In fact, the
variety of recognized evaluation methods have evolved as evaluators have developed ways to
address the principal kinds of questions commonly asked by program managers and policy makers.
The methods provide their answers using different units of measures, and the desired unit of
measure can be an important factor in choosing among the methods. For example, the question
posed may ask for statistical measures, best provided by the survey method. The question may
ask for numbers of publications or patents, best provided by the bibliometrics methods (counts), or
evidence of dissemination of knowledge, best provided by citation analysis or network analysis.
The question may ask for financial measures, such as present-value net benefits or rate of return
on investment, best provided by economic methods. The question may ask for descriptive and
explanatory information or it may probe for understanding of underlying factors, best provided by
case studies.
Table 1-2 summarizes seven sequential steps to help R&D Managers get started answering
important questions to help achieve program technical and management goals, including a step to
guide them to choose the evaluation method(s) to meet their specific needs.
Table 1-2. Summary Steps for Achieving Program Manager Goals through Evaluation
Step 1 Consult the performance logic diagram shown in Figure 1-1 and identify the phase of the
program performance cycle on which you wish to focus.
Step 2 Go to Tables 1-3 through 1-6 and find the one for the selected phase of the program
performance cycle.
Step 3 Find within column 1 of the table a question or questions that you would like to have answered.
Step 4 Within the same table, go to column 2 to identify the recommended evaluation method and note
the number in parentheses. (No.) gives listing order of methods in Part 2 of this document.
Step 5 Within the same table, go to column 3 and confirm that the recommended method will provide a
type of measure that will likely meet your need.
Step 6 Go to Part 2 of the booklet and find the write-up for the recommended method.
Step 7 After learning more about the method, read Section 1-7, “Additional Considerations.” Then
consult with evaluation staff in your organization for further assistance and begin working with
an independent evaluator to proceed with a study.
5

Overview of Evaluation Methods for R&D Programs
A series of four tables — Tables 1-3 through 1-6, used in conjunction with the R&D Logic Model
in Figure 1-1 — guide program managers to choose the evaluation method(s) to meet their specific
needs. The tables correspond to four distinct phases of the program performance cycle.
5
Table 1-
3 starts with Phase 1, the designing/revising, planning, selecting, and budgeting phase of the
program performance cycle. Table 1-4 moves to Phase 2, the phase during which R&D progress
is made, process mechanisms are implemented, and program outputs are achieved. Table 1-5
continues to Phase 3, when the outputs are disseminated, technologies are handed off to potential
user, and knowledge is acquired by others, during which time the program managers watch for
interim outcomes. Table 1-6 shows what happens in Phase 4 and beyond, during which time
longer term outcomes and impacts occur, including energy savings, improvements in energy
supply, environmental effects, energy security benefits, technology options that may be needed
under changing conditions, and knowledge benefits resulting in new and improved products in
other industries.
Each of the four tables lists in its first column questions a program manager is likely to encounter
during the specified phase of the program performance cycle. Though not exhaustive, the
questions listed indicate the kinds of performance questions that are typically asked during each
phase. If you, the program manager, do not find your question phrased exactly as you would word
it, you should find a question sufficiently similar to allow you to proceed through the Roadmap.
Evaluation methods (identified by name and number) that are used to answer each question are
listed in the second column of the tables, linked to the questions. In turn, the types of measures
associated with each method are listed in the third column, linked to the methods and questions.
Several of the methods and measures occur multiple times because they are useful for answering
more than one question. Several of the questions occur more than once because they may need to
be revisited as a program progresses.
Figure 1-2 links the four phases of the program performance cycle back to the program manager’s
goals and lists information provided by different evaluation methods to help meet those goals.
This figure is incorporated into an icon used in Part 2 to assist the program manager in selecting
the right method for his or her purpose.
5
It is recognized that the innovation process is nonlinear, but from the perspective of the program manager, it is
convenient to portray the program performance cycle as having linear elements.
6

Overview of Evaluation Methods for R&D Programs
Figure 1-1. Basic Logic of R&D Programs and Evaluation Questions
Relevant Questions at Each Phase
Phases Key Metrics
Performance Assessment Questions Span the Performance Spectrum
Quality, Relevance
Technical Progress, Technology
Interim/ Diffusion
Ultimate
Management
R&D Infrastructure Output Goal, Hand off
Outcomes
Outcomes
(1)
Design/revise,
plan, select,
fund, manage
R&D
(2) R&D progresses,
processes
reviewed, outputs
achieved
(3) Outputs
disseminated,
interim outcomes
achieved
(4) Industry
commercialization,
knowledge spillovers,
system capacities
Market
acceptance of
technology
Benefits
Program Performance Cycle
(See Tables 1-3 – 1-6 for detailed questions)
Relevance?
Progress?
Users?
Timeliness?
Quality?
Importance of?
Partners?
Participants?
Relationships?
Technologies?
Processes?
Commercialized?
Why these?
Knowledge
Influencing factors?
Alignment?
outputs?
Details of progress?
Risk?
Other outputs?
Spillover indicators?
Why?
Vs. targets?
Cost?
Program
Past cost?
productivity?
Adequacy?
Past benefits?
Expected
benefits?
Processes?
Further commercial progress?
Realized benefits and costs?
Attributed program effects?
Links from noteworthy innovations to R&D?
Spillover effects?
Was it worth doing?
[Source: Gretchen Jordan, SNL]
7

Overview of Evaluation Methods for R&D Programs
Figure 1-2. Program Manager Goals, Phases of Program Performance, and Evaluation Information
Provided by Evaluation Methods.
6
Program Manager Goals:
• Improve Program
• Communicate why the program is worth doing
Four Phases of Program Performance Cycle:
1. Design/revise, plan, select, budget
2. Make R&D progress, review processes, achieve outputs
3. Disseminate outputs, achieve interim outcomes
4. Commercialization, market acceptance, energy savings,
energy security, other outcome s and impacts
Information Provided by Evaluation Methods
a
:
• Planning information
b
• Indicators of interim progress
• Analysis of collaborative and other relationships
• Creation and dissemination of knowledge outputs
• Energy savings, economic, environmental, energy security, option and other
benefits, and benefit-cost measures
c
• Spillover effects
• Comparative standing
d
• Overview – was it worth it?
e
1.7 Additional Considerations in Evaluation
Beyond identifying the questions to be addressed and the evaluation method(s) to be used, there
are additional considerations in undertaking evaluation studies. Important among these are the
level of effort to be employed; the design requirements of the study; whether the focus is an
individual project, a program, a portfolio of projects or programs, a system, or an organization;
whether the evaluation is to be performed retrospectively or prospectively; and identifying the
audiences for evaluation results. Each of these considerations is discussed briefly in turn.
6
Some items in the framework – labeled in alphabetical order – require clarification. The clarifications are as
follows: (a) The types of information listed are broad categories to which a variety of methods typically can
contribute. For example, the survey method has been used to contribute to most, if not all, the informational
categories shown, as has the case study method. Similarly, both methods have been used in all or most phases of the
program performance cycle. However, when the figure is used as an icon in Part II, the purpose is to highlight for
each method the principal type(s) of information it generates and the principal phases in which it is used; (b)
“Planning information” as used here encompasses a wide range of different types of information, including increased
understanding of program dynamics and transformational processes, assessment of technical risks, budget analysis,
estimates of user needs and satisfaction, and other information that bears on the operational design of a program; (c)
“Benefit-cost measures” encompass net present value measures, benefit-to-cost ratio measures, and rate of return
measures, including private returns, social returns, and returns attributed to the public investment; (d) “Comparative
standing” refers to how a program compares with other programs in terms of selected dimensions, for example, the
size and growth rate of their research budgets, the educational attainments of their employees, their R&D outputs, and
their productivity in generating outputs; (e) Overview judgments of a program’s worth generally draw on a larger
body of information compiled through the use of a variety of evaluation methods.
8

Overview of Evaluation Methods for R&D Programs
Level of Effort: The amount of time and resources to be put into an evaluation study can vary
depending on the analytical challenges faced, the method(s) used, the complexity of the study
design, the data existing and needing to be compiled, the intended use of the results and related
need for the study to be carefully researched, documented, defensible, and publishable, and, of
course, the program resources available for the study. After a program manager has identified the
question(s) to be answered, the intended use of the study, and the audience for the results, a study
plan can be developed and study costs estimated based on the method(s) to be used and the desired
features of the study.
Study Design: How a study is designed is dependent on the type of question asked. Three
common types of questions are (1) descriptive questions, (2) normative questions, and (3) impact
or cause and effect questions.
7
Descriptive questions are generally the easiest to address. These are the what, why, who, how,
and how much or how many questions. For example, we may wish to know how many papers
were published from 1995 through 2005 by a program. The answer requires a simple count of
published papers. Suppose we wish to know what connections exist between a particular
government lab, other government labs, universities, and company labs. A network analysis can
show the linkages among these organizations. Suppose we want to know who developed a
technology and why. The descriptive case study method can tell the story of the developers, their
motivations, and critical aspects of the development.
Normative questions are asked when we have a standard, goal or target and we want to know how
actual outcomes compare against the standard or goal. Answering this kind of question is also
relatively straight-forward. The way the goal or target is expressed determines the method used to
answer normative questions. For example, a program goal may be to achieve at least an 85%
customer satisfaction rating. Thus, the relevant question is did the program meet its goal of
achieving at least an 85% customer satisfaction rating—a question that can be answered using the
survey method.
Impact questions require more attention to study design, because the evaluation needs to show not
only that an effect can be observed but also that the program in question caused it to happen—
although with R&D it is often feasible to show “contribution” rather than strict causality. For a
non-R&D example of the challenge of showing causality, consider a program that aims to increase
jobs. The program is implemented and employment increases. Was it the program or changes in
the business cycle independent of the program that is responsible for the increase? For an R&D
example, suppose a program seeks to increase fuel efficiency by developing a new type of engine.
7
The discussion of types of questions and formulation of study design is based on material from an on-line course on
evaluation described by Bill Valdez, Bill Eckert, Padma Karunaratne, and Rosalie Ruegg in a presentation at the 2005
annual meeting of the American Evaluation Association, Toronto Canada, October 2005.
9

Overview of Evaluation Methods for R&D Programs
Table 1-3. Phase 1 of Program Performance Cycle: Designing/Revising, Planning, Selecting, and Budgeting
Relevant Questions Methods for Answering
Questions
(No.) gives listing order in
Part 2
Types of Measures Given
What are the relevancy and timeliness of this program or initiative? Would it make
sense to delay it until more fundamental work on enabling technologies is
completed? What are the factors that endanger it?
(2-1) Peer review/Expert
judgment in support of
strategic planning,
selecting, and budgeting
Judgment
Critiques
Recommendations
Who are your partners, and how much are they contributing to the effort?
What technologies (or other outcomes) do you expect to deliver, and when?
How did you come to select the technologies/approaches you are using in pursuit of
the program or initiative?
How do planned projects or activities support planned program or initiative
objectives?
Does the innovativeness (technical risk level) of the planned R&D program meet
acceptable levels?
Why do you think the technology will work?
How much will the program/initiative cost? How did you come to this cost estimate?
What is the likelihood that this amount will be sufficient to achieve the goals?
How much has been spent thus far? Does the progress achieved thus far match
expectations based on those expenditures?
(2-11) Benefit-cost analysis
-- retrospective
Economic, knowledge,
environmental, &
security benefits
What additional benefits are expected from the new program or initiative relative to
its additional costs?
(2-11) Benefit-cost analysis
-- prospective
Economic,
environmental, &
security benefits
Are program mechanisms, processes, and activities appropriate to achieve program
or initiative goals? How are resources to be transformed into desired outputs and
(2-1) Peer review/Expert
judgment
Judgment
outcomes? How can the transformational processes be strengthened?
(2-7) Case study Qualitative explanations
(2-12) Econometric studies Quantitative functional
relationships
Why do you think the planned efforts will yield the results you are seeking? What
confidence do you have in our ability to deliver the desired outcome? Why?
(2-1--2-14) All methods Past and predicted
performance results
from multiple studies
(see tables 3-5)
10

Overview of Evaluation Methods for R&D Programs
Table 1-4. Phase 2 of Program Performance Cycle: Making R&D Progress, Reviewing Process Mechanisms and Achieving Outputs
Relevant Questions Methods for Answering
Questions
(No.) gives listing order in Part 2
Types of Measures Given
Are we making technical progress as planned? (2-2) Monitoring: comparing
progress against technical
milestones
Comparison of technical
achievements against targets
Is the program’s research of high scientific quality? Is it relevant,
productive, and well managed?
(2-1) Peer review/Expert judgment Judgment
Who is participating? In what roles? What relationships are
developing? Is the program strengthening the research network?
(2-6) Network analysis
Before-and-after applications are
recommended
Diagram showing connections
among research entities
How are program mechanisms, processes, and/or activities working?
How can they be strengthened?
(2-2) Monitoring activities Indicators
(2-7) Case study --
descriptive/exploratory
Qualitative explanations
(2-12) Econometric studies Quantitative functional
relationships
What are the program’s codified knowledge outputs? 2-3) Bibliometrics – counts Number of papers
Number of patents
What are other outputs of the program?
Do they match
expectations?
(2-2) Monitoring outputs Indicators, e.g.,
Number of research prototypes
Number of processes
Number of algorithms
Number of students trained
Comparisons of achieved
outputs against targets
How does the program’s output productivity compare with similar
programs?
(2-9) Benchmarking Comparison of units of outputs
per resource input among
programs
11

Overview of Evaluation Methods for R&D Programs
Table 1-5. Phase 3 of Program Performance Cycle: Output Dissemination and Achievement of Interim Outcomes
Relevant Questions Methods for Answering
Questions
(No.) gives listing order in
Part 2
Types of Measures Given
Who is using the program’s knowledge outputs? To what extent? (2-3) Bibliometrics – citation
analysis
Citations of publications
Patent citation trees
How noteworthy are the resulting patents? What are the hot trends?
Are there important regional impacts?
(2-5) Hot-spot patent analysis Relative frequency of citations
What role did the program play in initiating research in this area? (2-4) Bibliometrics – data
mining
Growth in use of keywords in
documents over time &
program’s contribution
What additional project-related relationships have developed among
researchers? Among others, such as commercializers and users?
(2-6) Network analysis
Before-and-after applications
are recommended
Diagram showing connections
among related entities
To what extent have the program’s outputs been commercialized?
(2-2) Indicators
(2-10) Technology
commercialization tracking
Number of outputs
commercialized
Stage of commercialization
Extent of commercialization
What factors are influencing industry’s adoption/lack of adoption of the
program’s technologies?
(2-7) Case study --
descriptive/explanatory
Narrative and data
List of factors
How long is it taking to first sales? How much is being realized in annual
revenue? What are related employment effects?
(2-8) Survey Statistics
What are the realized benefits and costs of the technology to date? What
share of net benefits from the technology are attributed to the program?
(2-11) Benefit-cost analysis Net present value benefits
with and without the program
Rate of return
What evidence is there of spillovers from the R&D? (2-14) Spillover analysis Indicators of spillovers
How is the program working thus far? (2-7) Case study –
descriptive/explanatory
Narrative and data
12

Overview of Evaluation Methods for R&D Programs
Table 1-6. Phase 4 of Program Performance Cycle and Beyond: Commercialization, Market Acceptance, Outcomes and Impacts
Relevant Questions Methods for Answering Questions
(No.) gives listing order in Part 2
Types of Measures Given
To what extent has commercialization been achieved? (2-10) Technology commercialization
tracking
(2-8) Survey
Stage of commercialization and
extent of commercialization
Statistics on commercial
achievements
What are the realized benefits and costs of the program or
initiative?
(2-11) Benefit-cost analysis --
retrospective
Economic, knowledge,
environmental, & security
benefits
What effect has the program or initiative had on residential
energy efficiency? On commercial energy efficiency?
(2-8) Survey
(2-12) Econometric method
Correlation results
Production functions
Are there one or more noteworthy innovations that can be
shown to link back directly to the program’s research?
(2-13) Historical tracing (including
citation analysis)
Documented path linking
downstream innovation to
upstream R&D
Is there evidence that knowledge spillovers (use of research
results beyond planned uses) have occurred?
(2-3) Bibliometrics – citation analysis
(2-6) Network analysis
Citations of publications
Patent citation trees
Diagram showing connections
among research entities
What are the spillover effects for consumers and producers in
the target industry and in other industries from the program’s or
initiative’s technologies and knowledge outputs?
(2-14) Spillover analysis Consumer surplus
Producer surplus
Knowledge spillovers
Network spillovers
How does the program compare with counterpart programs? (2-9) Benchmarking Comparisons among programs
on selected parameters
If we had it to do all over again, would we have launched the
program or initiative?
(2-1) Peer review/expert judgment
supported by multiple retrospective
evaluation methods (2-3--2-14)
Comparison of retrospective
evaluation results against
original program/initiative
expectations
13

Overview of Evaluation Methods for R&D Programs
Then fuel efficiency increases. Was it the government research program that caused the efficiency
improvement, or was it something else, such as private-sector R&D?
To establish cause-and-effect conditions, an evaluation study needs, first, a logical theory that
explains why a causal relationship makes sense. Second, it needs the cause and the effect to
follow a logical time order, such that the program precedes the observed outcome. Third, it needs
to ensure that the condition of co-variation is met, i.e., the outcome has the ability to change as the
program’s intervention is applied. And, fourth—and most difficult, the evaluation needs to
eliminate rival explanations for the observed changes.
Approaches to help establish causality include before and after comparisons; use of control groups
with random assignment; application of statistical/econometric techniques to eliminate rival
explanations when comparison groups do not include random assignment; and use of
counterfactual questions of participants to try to assess what would have happened if the program
had not existed.
Study Focus on Project, Program, or Beyond: It should be noted that with the exception of
benchmarking, the methods presented are intended for use within the scope of a given program to
evaluate individual projects, related collections (or portfolios) of projects, or, in some cases, a
program as a whole. At this time the state-of-the-art of evaluating collections of research
portfolios across multiple programs and organizations is limited and under development.
Retrospective versus Prospective Evaluation: Retrospective evaluation takes a look back at
past accomplishments. It is based on empirical data. Prospective evaluation projects what is
expected to happen in the future. Prospective evaluation is performed to forecast results of a
decision too recent to have generated empirical data. Prospective evaluation is characterized by
more uncertainty than retrospective evaluation—uncertainty about the technical outcome of a
project or program, uncertainty about market acceptance of the technical outcome, and uncertainty
about future “states of the world” that may affect demand and supply conditions. Hence, the
results of prospective evaluation tend to be more uncertain than the results of retrospective
evaluation.
Communicating Evaluation Results to Different Audiences: The program manager will be a
prime audience for results of an evaluation study, but there are other “stakeholders” who also may
be interested in evaluation results. To reach other stakeholders, to address their specific needs,
and to communicate to them the relevant findings, the R&D program staff can help develop an
“evaluation results” communications plan.
References
Luke Georghiou, “What Lies Beneath…Avoiding the Risk of Undervaluation,” presentation
presented at the conference, New Frontiers in Evaluation, Vienna, April 24-25, 2006Fteval.
(Available online at www.fteval.at/papers06 by selecting “plenary sessions” and number 3.)
14

Overview of Evaluation Methods for R&D Programs
McLaughlin, John A., and Jordan, Gretchen B., “Chapter 1: Logic Models,” in Handbook of
Practical Program Evaluation, 2
nd
Edition, Wholey, J., Hatry, H., and Newcomer, K., Eds.,
Jossey-Bass, 2004.
Rosalie Ruegg, edited, “Benchmarking Evaluation of Public Science and Technology Programs in
the United States, Canada, Israel, and Finland,” Proceedings of a Workshop, TEKES--National
Technology Agency of Finland, Embassy of Finland, Washington, DC, September 25, 2002.
Rosalie Ruegg and Irwin Feller, A Toolkit for Evaluating Public R&D Investment, NIST GCR 03-
857 (Gaithersburg, MD: National Institute of Standards and Technology, July 2003), “Part I,
Evaluation Framework,” pp. 13-53.
U.S. Office of Management and Budget, “What Constitutes Strong Evidence of a Program’s
Effectiveness?” Supporting Materials/References for Program Assessment Rating Tool (PART
Guidance, 2004), Executive Office of the President, accessed January 2006 at
www.whitehouse.gov/omb/part/2004_program_eval.pdf.
15
Overview of Evaluation Methods for R&D Programs
16
Overview of Evaluation Methods for R&D Programs
Part II. Overview of Selected Research Evaluation Methods
Each of fourteen evaluation methods is described in sections that comprise Part 2, the heart of the
booklet. The treatment of each includes:
a definition of the method and what it has to offer the program manager;
an overview of how the method is organized, conducted, and analyzed;
limitations of the method;
practical uses of the method; and
examples.
The examples are for successful applications of the R&D evaluation methods taken from
evaluation reports by organizations such as DOE’s EERE, DOE’s Office of Science, the National
Science Foundation, the National Institute of Standards and Technology, and the National
Research Council. Note that each example is a brief synopsis taken from a study—in many cases
a quite lengthy and detailed study. In order to adhere to the booklet’s aim of providing a quick
reference and overview, many details of the source studies are omitted. However, references are
provided at the end of the presentation of each method for those who wish to delve further into the
examples. Many of the full reports from which the examples are drawn are available on-line for
easy access.
The methods are presented in the order listed. Their numbers (in parenthesis) refer to the sections
that follow, and they are also keyed to the series of questions presented in Tables 1-3 through 1-6.
As indicated in the tables, most of the methods are used to answer questions in more than one
phase of the cycle. An icon (based on Figure 1-2) at the top of each section alerts the program
manager to the phase or phases of the program performance cycle in which the method will likely
be most useful and highlights the type of information it will provide.
(2-1) Peer Review/Expert Judgment
(2-2) Monitoring, Data Compilation, and Use of Indicators
(2-3) Bibliometrics – counts and citation analysis
(2-4) Bibliometrics – data mining
(2-5) Bibliometrics – hotspot patent analysis
(2-6) Network Analysis
(2-7) Case Study Method – Exploratory, Descriptive, and Explanatory
(2-8) Survey Method
(2-9) Benchmarking Method
(2-10) Technology Commercialization Tracking Method
(2-11) Benefit-Cost Case Study
(2-12) Econometric Methods
(2-13) Historical Tracing
(2-14) Spillover Analysis
Again, it should be kept in mind that the field of R&D evaluation is still developing. Additional
methods and techniques may be added to this booklet as they are developed, tested, and found
useful to R&D managers.
17

Overview of Evaluation Methods for R&D Programs
2.1 Peer Review/Expert Judgment
Program Manager Goals:
• Improve Program
• Communicate why the program is worth doing
Four Phases of Program Performance Cycle:
1. Design/revise, plan, select, budget
2. Make R&D progress, review processes, achieve outputs
3. Disseminate outputs, achieve interim outcomes
4. Commercialization, market acceptance, energy savings,
energy security, other outcome s and impacts
Information Provided by Evaluation Methods:
• Planning information
• Indicators of interim progress
• Analysis of collaborative and other relationships
• Creation and dissemination of knowledge outputs
• Energy savings, economic, environmental, energy security, option and other
benefits, and benefit-cost measures
• Spillover effects
• Comparative standing
• Overview – was it worth it?
[Goals, phases, and information provided by this method are highlighted]
Peer review/expert judgment is a relatively low-cost, fast-to-apply, well-known,
widely accepted, and versatile evaluation method that can be used to answer a
variety of questions throughout the program performance cycle, as well as in
other applications. It is used, for example, for support of strategic planning
decisions, selecting among projects and programs, for in-progress project and
program review, for process assessment, for stage-gate decisions, for merit
review of papers for publications, and for making judgments about diverse
topics, including—when supported by results from application of other
methods—the overall success of a program. It is widely used by industry,
government, and academia. In practice, it ranges from a formal process
conducted according to strict protocol to an informal process.
Definition: Peer Review/Expert Judgment is qualitative review, opinion, and advice from experts
on the subject being evaluated, based on objective criteria. The method combines program
performance information (provided to the experts) with the many years of cumulative experience
of the subject-matter experts, and focuses that informed expertise and experience on addressing
key questions about a program, initiative, project, proposal, paper, topic, or other subject of focus.
While information from other sources, including other methods of evaluation, may provide
influential evidence, the ultimate conclusions about performance are based on the judgment of the
experts.
18
Overview of Evaluation Methods for R&D Programs
EERE’s Peer Review Guide (2004) defines in-progress peer review as:
A rigorous, formal, and documented evaluation process using objective criteria
and qualified and independent reviewers to make a judgment of the technical/
scientific/business merit, the actual or anticipated results, and the productivity and
management effectiveness of programs and/or projects.
How DOE’s EERE in-progress peer reviews are organized, conducted, and analyzed:
The EERE Peer Review Guide sets out minimum requirements for planning, conducting,
and responding to peer reviews. A primary requirement is that the reviews be independent
both in fact and in terms of public perception. This is achieved through having processes
that are transparent and having third parties involved in the selection of reviewers.
To a
large extent, the quality of the results depends upon the choice of qualified and independent
reviewers. In addition to being experts in the subject matter, reviewers should have no real or
perceived conflict of interest. Their judgments should be guided by the objective evaluation
criteria, established prior to the review, and should address the specific questions established for
the review.
When used to review an individual project or a collection of projects, peer review
generally focuses on the question “are we doing it right?” A program-level review will focus on
the broader issue of “is the program doing the right thing?”
Limitations: The quality and credibility of peer/expert evaluation is highly dependent on the
reviewers/experts selected and the evaluation questions and criteria used by those reviewers.
Reviewers must be very knowledgeable about the subject and free of conflict of interests that
could bias their judgment. The sometimes-expressed view that peer review is an “old boys club”
must be avoided. Steps may be needed to calibrate reviewer ratings. Defining appropriate criteria
may be problematic when the work being reviewed is highly innovative. Peer review panels are
dependent on sound and detailed information on which to base their judgments about a program’s
progress or impact, and they are vulnerable to poor and insufficient information. The type of data
needed for retrospective impact assessment cannot be created in an expert review panel format.
For this reason, peer review tends not to be appropriate for evaluating impacts of programs --
except if a peer review panel is provided substantial, reliable results from impact studies based on
other methods, and serves the function of integrating results across multiple studies.
Uses:
To conduct in-progress reviews of scientific quality and productivity.
To help answer questions about the relevancy, timeliness, riskiness and management of
existing program research activities, and resource sufficiency of new program initiatives.
To score and rate projects under review to aid decisions to continue, discontinue, or modify
existing or planned projects, programs, or program initiatives.
To help assess appropriateness of program mechanisms, processes, and activities and how they
might be strengthened.
To integrate across multiple evaluation results and render judgments about the overall success
of a program or program initiative.
19

Overview of Evaluation Methods for R&D Programs
To provide information to help program managers make decisions to design or revise their
program, re-direct existing R&D funds, or allocate new funds.
Examples
: Two examples are given. The first illustrates DOE’s formal use of peer review for in-
progress review of projects and program. The second illustrates a less formal, less rigorous use of
experts convened as a working group and supported by the results of previously completed studies
and specially commissioned papers, to review and discuss several research questions. It is
provided to suggest the wide range of practice in using “peers” or “experts” for evaluation.
Example 1: Using in-progress peer review to assess the performance of projects in DOE
Hydrogen Program
In the EERE Hydrogen, Fuel Cells, and Infrastructure Technologies Program (HFCIT), research
and other activities performed by industry, universities, and national laboratories are evaluated
annually at the Hydrogen Program Merit Review and Peer Evaluation meeting. Independent
expert panels review the project portfolio in accordance with criteria, which helps guide the
program’s Technology Development Managers in making funding decisions for the new fiscal
year. This review of the HFCIT program is conducted using the process outlined in the EERE
Peer Review Guide. In addition to annual peer review at the project portfolio level, external
reviews are conducted every two or three years by the National Academies (e.g. National Research
Council, National Academy of Sciences), or an equivalent independent group.
8
The program
prepares a formal response to the review recommendations.
Table 2-1 illustrates how peer review results were used by the Hydrogen Program to help inform
decisions on whether to continue or discontinue research projects.
9
Table 2-1 shows a sample
subset of a larger collection of summary results for HFCIT program technical areas in 2003.
Many research projects determined to have very low peer review ratings, as established from a
comparable peer review process applied to all projects in a given subprogram, were discontinued.
A summary of scoring results and Program decisions follows the table.
8
See, for example, The Hydrogen Economy: Opportunities, Costs, Barriers, and R&D Needs, prepared by the
National Research Council (NRC) and National Academy of Engineering. February 2004.
9
FY2003 Hydrogen Program Merit Review & Peer Evaluation Report.
20

Overview of Evaluation Methods for R&D Programs
Table 2-1. Results Summary Table from 2003 HFCIT Program Peer Review Report
Project
No.
Project, Performing Organization Avg.
Score
Conti
nued
Disconti
nued
Comp
leted
Summary Content
10 Low Cost H2 Production
Platform, Praxair
2.95 V Emphasize collaboration.
11 Defect-free Thin Film
Membranes for H2 Separation &
Isolation, SNL
2.87 V
12 Maximizing Photosynthetic
Efficiencies and H2 Production
in Microalgal Cultures, UC
Berkeley
3.33 V Focus on program RD&D goals
for 2005.
13 Reformer Model Development
for Hydrogen Production, JPL
2.27 V Model analysis in this area is no
longer a program requirement.
14 Photoelectrochemical H2
Production, University of
Hawaii
3.30 V Emphasize further development
of multi-junction
photoelectrodes to meet program
RD&D goals for 2005.
15 Photoelectrochemical Water
Splitting, NREL
3.23 V Focus on candidate lighting
materials.
16 Encapsulated Metal Hydride for
H2 Separation, SRTC
2.83 V
17 Economic Comparison of
Renewable Sources for
Vehicular Hydrogen in 2040,
DTI
2.90 V
18 Biomass-Derived H2 from a
Thermally Ballasted Gasifier,
Iowa State University
2.70 V
20 Evaluation of Protected Metal
Hydride Slurries in a H2 Mini-
Grid, TIAX
3.20 V
22 Novel Compression and Fueling
Apparatus to Meet Hydrogen
Vehicle Range Requirements,
Air Products & Chemicals Inc.
3.20 V
30 Techno-Economic Analysis of
H2 Production by Gasification
of Biomass, GTI
2.60 V Project completed.
31 Supercritical Water Partial
Oxidation, GA
2.57 V Unlikely that cost barrier can be
overcome.
32 Development of Efficient and
Robust Algal Hydrogen
Production Systems, ORNL
3.47 V Focus on designing new DNA
sequence coding for proton
channel.
34 Water-Gas Shift Membrane
Reactor Studies, University of
Pittsburgh
2.90 V Emphasize feasibility of hi-temp
water-gas shift under realistic
operating conditions.
38 Low Cost, High Efficiency
Reversible FC Systems,
Technology Management Inc.
2.80 V High electrical input
requirement prevents
overcoming energy efficiency
barrier.
39 High-Efficiency Steam
Electrolyzer, LLNL
2.37 V Carbon deposition at anode is a
recurring problem.
Source: FY2003 Hydrogen Program Merit Review & Peer Evaluation Report
21

Overview of Evaluation Methods for R&D Programs
Peer review scoring results for hydrogen research projects:
• In 2003 there were 56 total hydrogen projects that received a review rating.
• Distribution of scores ranged from 2.2 to 3.68 on a 4-point scale (1.0 to 4.0).
• 8 projects were judged to be “completed.”
• 7 projects were discontinued.
• 6 of 7 discontinued projects were at or lower than the 2.8 rating threshold. They were
discontinued for the following stated reasons:
o Model analysis in this area is no longer a program requirement.
o Project funding was terminated due to poor review.
o Carbon deposition at anode is a recurring technical problem.
o It is unlikely that the cost barrier can be overcome.
o Project funding was terminated pending further review of approach.
• A seventh project had a score of 3.23 but was discontinued for the following reason:
o High electrical input requirement prevents overcoming barrier.
Peer review scoring results for fuel cell research projects:
• In 2003 there were 73 total fuel cell projects that received a review rating.
• Distribution of scores ranged from 1.8 to 3.9 on a 4-point scale (1.0 to 4.0).
• 15 projects were judged to be “completed” or “concluding.”
• 5 projects were discontinued.
• 4 of 5 discontinued projects were at or lower than the 2.8 rating threshold. They were
discontinued for the following stated reasons:
o Project was terminated since other approaches to fuel cell humidification appear to
be more effective.
o Project was halted pending go/no-go decision.
o Project funding was terminated in favor of higher priority R&D.
o Project was terminated since technology is unable to meet technical targets.
• A 5
th
project had a score of 3.04 but a decision was made to set project priorities and focus
future continued work only on a critical element of the research.
Example 2: Using expert judgment informed by supporting studies and papers to examine issues
surrounding public support of technology development
Researchers at Harvard University’s Kennedy School of Government in collaboration with MIT’s
Sloan School of Management and the Harvard Business School used elements of expert review in
conducting a study of barriers to private-sector funding of early-stage, high-risk technology
development projects.
10
This study lacked the formality and rigor of the previous example in
running a peer review process; it did, however, rely on a group of experienced practitioners from
business, finance, and government, together with academic experts, convened in two workshops to
discuss commissioned papers, hear presentation, discuss issues surrounding the management of
technical risks and related funding decisions, comment on the results of supporting studies, and
explore answers to the following questions:
How do industrial managers make decisions on funding early-stage, high-risk technology
projects?
10
Branscomb et al., 2000.
22
Overview of Evaluation Methods for R&D Programs
What external factors, especially those controlled or influenced by government, can
sufficiently reduce the risk factor of projects that appear otherwise to be attractive
commercial opportunities for the firm, so that firms will invest in them and seek their
commercialization?
How can a government program better identify projects that would not be pursued or would
be pursued less vigorously without public support and at the same time are likely to lead to
commercial success—with broad public benefits—with that support?
In attempting to address these questions, the study concluded that there is a serious and widening
gap in sources of support for research projects that fall between concept development and the
research needed to reduce a technology to practice.
References
L. Branscomb, K. Morse, and M. Roberts, Managing Technical Risk: Understanding Private
Sector Decision Making on Early Stage Technology-Based Projects, NIST GCR 00-787
(Gaithersburg, MD, April 2000.)
National Research Council (NRC), The Hydrogen Economy: Opportunities, Costs, Barriers, and
R&D Needs, prepared by the National Research Council (NRC) and National Academy of
Engineering, February 2004.
U.S. DOE EERE, EERE Peer Review Guide: Based on a Survey of Best Practices for In-Progress
Peer Review, August, 2004.
U.S. DOE EERE, FY2003 Hydrogen Program Merit Review & Peer Evaluation Report, 2003.
23

Overview of Evaluation Methods for R&D Programs
2.2 Monitoring, Data Compilation, and Use of “Indicators”
Program Manager Goals:
• Improve Program
• Communicate why the program is worth doing
Four Phases of Program Performance Cycle:
1. Design/revise, plan, select, budget
2. Make R&D progress, review processes, achieve outputs
3. Disseminate outputs, achieve interim outcomes
4. Commercialization, market acceptance, energy savings,
energy security, other outcome s and impacts
Information Provided by Evaluation Methods:
• Planning information
• Indicators of interim progress
• Analysis of collaborative and other relationships
• Creation and dissemination of knowledge outputs
• Energy savings, economic, environmental, energy security, option and other
benefits, and benefit-cost measures
• Spillover effects
• Comparative standing
• Overview – was it worth it?
[Goals, phases, and information provided by this method are highlighted]
Monitoring a program as it is carried out, collecting resulting data, and
generating selected indicator metrics from the data are integral to evaluation.
Pairing monitoring with evaluation is considered good practice. Continuous
monitoring and data collection support evaluation and provide useful interim
indicators of change in key program functions that can guide program
managers in making mid-course corrections.
Definition: Monitoring is a continuous assessment of key program functions organized internally
by program management and carried out on an on-going basis. Monitoring entails setting up a
data collection system for compiling key data on program activities, participants, interim
achievements and outputs. The resulting data can be used to develop interim performance metrics
or “indicators” of program progress, outputs, and outcomes, and are helpful in keeping a program
on track and for guiding mid-course corrections. The data also contribute to evaluation studies.
How monitoring and data collection are organized and conducted: Developing a monitoring
system with data collection and construction of indicators starts with review of the program’s
detailed logic model. From the logic model, it is possible to identify key activities, expected
program participants, expected outputs, and, perhaps, some expected outcomes that are conducive
to monitoring, such as number of technologies under commercialization. A closer look at projects
or research activities that comprise a program or initiative reveals the technical goals, against
which progress can be tracked. After deciding what to monitor, the next step is to establish the
24

Overview of Evaluation Methods for R&D Programs
supporting data collection strategies, databases, and information technology framework. It is
necessary that program management identify which indicator metrics will best provide interim
guidance. Often graphical depictions of the selected indicators are helpful in revealing trends in
key program functions, and in guiding mid-course corrections. When evaluation studies are
launched, the data collected through program monitoring tend to be invaluable. For example,
records of publication and patent outputs are needed to support citation studies. Records of
program participants are a starting point for network studies. Records of funded projects are a
starting point for carrying out case studies. Records of commercial progress are helpful in
organizing economic studies.
Limitations: The success of monitoring depends on appropriate selection of what is monitored.
Moreover, interim indicators of progress are just that; they are not measures of ultimate, achieved
outcomes and impacts. A further complicating factor is that a program often has multiple goals
and it may be difficult to know how multiple indicators inform the multiple goals.
Uses:
To track interim program progress.
To guide mid-course corrections; provide information to help program managers make
decisions to design or revise their program, re-direct existing R&D funds, or allocate new
funds.
To support evaluation studies.
Example: Two examples are given. The first illustrates DOE and EERE performance
monitoring systems that serve as reporting and analysis tools to support EERE R&D planning and
management. The second illustrates a monitoring system used by the National Institutes of Health
(NIH) called the Program Performance Monitoring System (PPMS).
Example 1: EERE CPS, DOE Joule and EERE EIS performance monitoring systems
DOE and EERE have the performance monitoring systems that cover parts of the program
performance spectrum – The EERE Corporate Planning System (CPS), the DOE Joule
Performance Measurement Tracking System, and the EERE Executive Information System (EIS).
The CPS is a reporting system that collects and tracks information about milestone achievements
as well as financial performance (e.g., cost and obligation data). This information is collected and
reported at the project and contracts levels. The CPS provides quarterly detailed tracking of
achievement of project level goals, which are primarily output measures of research/technology
development accomplishments.
Joule is the name of a program performance tracking system that DOE uses to track and validate
programs’ performance measures. Joule tracks progress toward program goals and important
accomplishments that are stated as official program R&D targets in the reports to Congress and
the OMB. Joule performance measures for R&D (and non-R&D activities, as well) are
incorporated in the annual Congressional budget justifications because doing so encourages
budget and performance integration (required by the Presidential Management Initiative, PMI).
25

Overview of Evaluation Methods for R&D Programs
Joule performance measures tend to be annual output measures and sometimes include interim
outcomes. The measures are defined at the project or project portfolio levels. Table 2-1 provides
an example of annual Joule performance targets reported at the project portfolio level for
Photovoltaic R&D in the EERE Solar Energy Program.
Table 2-1. Joule Performance Measures for Solar Photovoltaic Energy Systems Research
FY 2002 Results FY 2003 Results FY 2004 Results
Photovoltaic Energy Systems
Reduce the manufacturing
cost of PV modules to $2.25
per Watt (equivalent to a
range of $0.20 to $0.25 per
kWh price of electricity for
an installed solar system).
[MET]
Reduce manufacturing cost of
PV modules to $2.10 per
Watt (equivalent to a range of
$0.19 to $0.24 per kWh price
of electricity for an installed
solar system). [MET]
Verify, with standard
laboratory measurements,
U.S.-made commercial
production crystalline
silicon PV modules with
12.5 percent conversion
efficiency.
Verify, with standard
laboratory measurements,
U.S.-made commercial
production thin-film PV
modules with 10 percent
conversion efficiency.
[MET]
FY 2005 Results FY 2006 Targets FY 2007 Targets
Photovoltaic Energy Systems
Verify, using standard
laboratory measurements, a
conversion efficiency of 13.5
percent of U.S.-made,
commercial crystalline silicon
PV modules. Production cost
of such modules is expected
to be $1.95 per Watt. [MET]
Develop thin-film PV
modules with an 11.0-percent
conversion efficiency that are
capable of commercial
production in the U.S. [MET]
Verify, using standard
laboratory measurements, a
conversion efficiency of
13.8 percent of U.S.-made,
commercial crystalline
silicon PV modules.
Production cost of such
modules is expected to be
$1.90 per Watt.
Develop thin-film PV
modules with an 11.2-
percent conversion
efficiency that are capable
of commercial production
in the U.S.
Verify, using standard
laboratory measurements, a
conversion efficiency of
14.5 percent of U.S.-made,
commercial crystalline
silicon PV modules.
Production cost of such
modules is expected to be
$1.80 per Watt.
Develop thin-film PV
modules with an 11.8-
percent conversion
efficiency that are capable
of commercial production
in the U.S.
Each DOE program submits quarterly and annual Joule targets into a centralized database.
Progress toward their target achievement is monitored throughout the fiscal year by an
independent DOE Office.
26
Overview of Evaluation Methods for R&D Programs
Joule includes an external auditing mechanism. A set of randomly-selected program targets are
chosen by DOE for auditing which may include, for example, the review of completed technical
reports to verify that a stated target has been met according to defined criteria. Joule also provides
color ratings (green, yellow, and red) to give a quick look display of its overall assessment results
– green (100 percent of a target or goal is met), yellow (80-99 percent is met) and red (unmet if
(<80 percent is met), Programs’ progress against its Joule performance measures is publicly
reported in the annual DOE Performance and Accountability Report.
The EIS is a performance reporting and analysis tool. It is a central repository that provides
integrated project and program level information to EERE Senior Management and program staff.
The EIS integrates many separate databases containing performance information. It aligns key
financial, portfolio, schedule and other information. Its design enables it to have analysis
capability for use in creating quick and ready performance reports and for analysis of performance
trends (at program level or across the entire EERE portfolio). Figure 2-1 shows a screen shot of
the EIS Dashboard – the portal to entry to the EIS system.
The CPS, Joule and EIS monitoring systems contain data exchange and transfer functionality.
Together they serve as a useful ‘early-warning’ device for assessing performance of R&D and
other activities in DOE. DOE and EERE are making further enhancements to these performance
monitoring systems at this time.
27

Overview of Evaluation Methods for R&D Programs
Figure 2-1. Screen Shot of EIS Dashboard
Source: EERE’s Executive Information System, presentation by Thomas Palmer Jr. (DOE, 2006)
Example 2: NIH’s Program Performance Monitoring System (PPMS)
The example given here is of an advanced, state-of-the-art centralized program performance
monitoring system developed for use by the National Institutes of Health, called the Program
Performance Monitoring System (PPMS).
11
The example demonstrates that Information
Technology (IT) tools are foundational to the management of information and of programs.
The example PPMS achieves both the connection of information contributors and the collection of
the information within an organizational knowledge infrastructure. The system consolidates
information, makes it readily available to users throughout the organization, and provides tools for
organizing and displaying the data needed for management support and to meet ongoing internal
and external reporting requirements. Although other programs have developed program
monitoring systems, none have the IT sophistication of the illustrative system. However, the
system is limited in that it collects performance data only for a relatively small number (70) of
representative projects.
11
This description of NIH’s centralized performance monitoring system is based on a paper and presentation by
Duran, 2006.
28

Overview of Evaluation Methods for R&D Programs
The focus of the NIH information system is data from its extensive and complex biomedical
research portfolio arising from 27 institutes and centers. To be responsive to new medical
information, emerging scientific opportunities, and public health needs, it is critical that NIH
management have a monitoring system of its research programs. For annual planning and
budgeting, management needs timely information on performance goals, progress, and budgets
across the entire organization. To comply with government reporting requirements, NIH needs a
systematic approach for collecting performance and budget information across these institutes and
centers. The new IT-driven monitoring and repository system is far more efficient than the old
system which required extensive manual activities, meetings, and working groups over
considerable time to gather and consolidate paper-based information—which immediately became
dated. The new system with its emphasis on visual support is also more effective in delivering
information in formats that enhance user understanding.
The website for the PPMS, http://nihperformance.nih.gov
, comprises two Web-based serves. One
enables public access to publicly released performance monitoring information, reports and news.
The other is secured for authorized NIH user-participants. The designation of user classes
supports general public inquiries, researcher needs, in-house data entry and report generation, and
senior management access to reports and supporting graphics and the capability to generate
analytic reports.
Built into the application software is a project performance monitoring questionnaire that
facilitates display of performance information for each project. System filters allow users to look
at selected area of consolidated data, and to view progress against targets. A performance scoring
tool in the system provides, for example, comparisons of actual performance to the target for Key
Performance Indicators (KPI). This tool enables navigation through the system to assess progress
in different areas and highlights those areas needing improvement. The system can be used to
assess performance against core criteria—in the case of NIH, scientific risk (low/medium/high),
time horizon (short-, mid-, and long-term), intramural versus extramural science, annual targets
and budgets, and other criteria. Figure 2-2 shows a screen from the monitoring system showing
the number of goals classified as basic or clinical or both, and classified by risk level.
It is important to note that the results of evaluation studies are not generated by the PPMS, but
results from evaluation studies can be entered into the information system. The data in the system
are used to produce analytical reports for performance monitoring and analysis. At the click of a
button, the system generates performance reports for GPRA, PART, scorecard, and other required
reports based on the stored data, reportedly saving many staff hours in report preparation.
12
With input from NIH’s Systemic Assessment Branch, an email alert notification system
automatically and routinely alerts users to due dates, incomplete submissions, late submissions,
items requiring approval or verification, and needs for revisions. Further, when the emails are
referencing a particular place in the system that needs attention, the email is hyperlinked to the
referenced page in the system.
Program officers are able to analyze data within the system in a variety of ways and from different
perspectives. They can drill down to greater detail, identifying specific problem areas as well as
12
The budget module of the system is under development and slated for deployment later in 2006.
29

Overview of Evaluation Methods for R&D Programs
areas of potential opportunity. They are able to see trends and comparisons of trends. They have
available to them a variety of options for changing and customizing graphical displays. A user
satisfaction survey is built into the system, and updates to the software are regularly conducted to
respond to user inputs and recommendations for improvements. An online evaluation tool is also
used to identify the frequency with which content is accessed, the type of activities performed
most often, and other dimensions of the effectiveness of user experiences with the system.
Figure 2-2. Illustrative Screen from NIH’s Program Performance Monitoring System
Compare Dimension
Compare Dimensions
No. of Goals compared by Goal Classification across Risk
No. of Goals compared by Goal Classification across Risk
(Core Criterion: Scientific Risk)
Source: Duran, 2006.
In summary, the NIH has established a state-of-the-art online performance monitoring system that
enables recording and tracking science content, science advances, and research progress against
prospective annual targets, and provides a centralized resource for performance information for
planning, analyzing, and reporting on performance. According to NIH staff that oversees the
system, it is highly successful. A note of caution is offered, however: critical to success is the
close alignment of knowledge management with the organization’s specific needs for performance
monitoring.
30

Overview of Evaluation Methods for R&D Programs
References
Deborah Duran, “Program Performance Monitoring System: Tools for Decision Makers.” New
Frontiers in Evaluation Conference, April 24-25, 2006, Vienna, Austria. (Duran’s paper and
presentation are available online at http://www.fteval.at/papers06. Go to Session C, “Portfolio
Evaluation,” and select Duran.)
Thomas Palmer Jr., “EERE Executive Information System,” presentation at Cognos 4
th
Annual
Government Forum, May 2006
31

Overview of Evaluation Methods for R&D Programs
2.3 Bibliometric Methods – Counts and Citation Analysis
Program Manager Goals:
• Improve Program
• Communicate why the program is worth doing
Four Phases of Program Performance Cycle:
1. Design/revise, plan, select, budget
2. Make R&D progress, review processes, achieve outputs
3. Disseminate outputs, achieve interim outcomes
4. Commercialization, market acceptance, energy savings,
energy security, other outcome s and impacts
Information Provided by Evaluation Methods:
• Planning information
• Indicators of interim progress
• Analysis of collaborative and other relationships
• Creation and dissemination of knowledge outputs
• Energy savings, economic, environmental, energy security, option and other
benefits, and benefit-cost measures
• Spillover effects
• Comparative standing
• Overview – was it worth it?
[Goals, phases, and information provided by this method are highlighted]
Bibliometric methods are used to show that knowledge has been created and
disseminated, and to show emergence of new ideas and development of
relationships and patterns. These methods use text and text-related materials
to evaluate R&D programs
13
They are particularly relevant to R&D
evaluation because the output of research typically is knowledge, and
knowledge is often expressed at least in part in reports, publications, and
patents. Bibliometric methods include counting publication and patent
outputs, analysis of citations of publication and patent outputs, and data
mining of textual materials. The focus of this section is on counts and citation
analysis which are used to show knowledge creation and dissemination, and to
identify users of a program’s knowledge.
Definition: Counts of publications and patents are often used by R&D programs as indicators of
program knowledge outputs. Citation analysis of publications and patents is used to reveal
relationships and linkages between a program’s knowledge outputs and efforts undertaken by
others. Citations demonstrate the dissemination of knowledge, creating conditions for knowledge
spillover benefits. The frequency of citations may signal the importance of a program’s
13
A recent extension of bibliometrics, called “webmetrics” or “cybermetrics” widens the scope to analysis of
relationships among different web sites, identifying those that are most useful or influential based on the frequency of
hyperlinking to other web sites. This extension could become relevant to evaluation of Federal R&D programs if
programs increasingly use web sites to disseminate non-published program outputs.
32
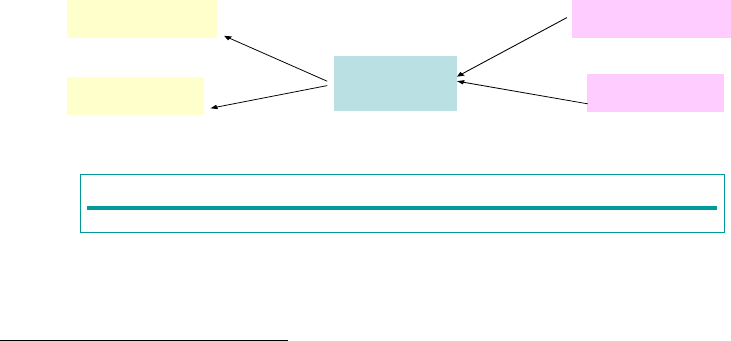
Overview of Evaluation Methods for R&D Programs
knowledge outputs to others. Counts of publications and patents filed are often included among
an R&D program’s outputs, and measures of patents granted and citations of publication and
patents are often used in assessing an R&D program’s outcomes. Evaluators are increasingly
using patents and their citations as indicators of innovation, information flow, and value
creation.
14
How biliometric studies of publication and patent counts and citations are organized,
conducted, and analyzed: Tabulating counts of publications and patents is relatively
straightforward. These records are often routinely compiled by R&D organizations in their
publication review and approval and patent filing processes and captured in program performance
monitoring systems. Search engines may also be helpful in compiling data on publications and in
making comparisons.
15
Citations analysis is generally performed as a forward search in time from
an initial publication or patent program output to downstream publications or patents which cite
that produced by the program, but it may also be performed backward to attribute current work to
knowledge generated in the past by your program or organization.
Figure 2-3 illustrates looking both forward and backward in time for citations of either
publications or patents. In the center is the publication or patent of interest.
Figure 2-3. Diagram Showing Forward and Backward Citations of Publications and Papers
Backward Citations
Forward Citations
(References)
Patent or
publication
of Interest
Identification
of publications
Identification
of patents
Identification
of publications
Identification
of patents
Time
1985-95 1995 1995-2005
14
In addition to using citation analysis for program evaluation, researchers have investigated citation-based patent
measures to develop financial market valuation of firms owning the patents, and at least one company is now using
citation-based valuation to provide stock investment services. (See, as an example of the research on this topic, Hall,
Jaffe, and Trajtenberg, 2001; and see, as an example of an investment service based on this method, ipIQ, formerly
CHI Research.).
15
Among the multiple search engines is Thomson Scientific’s “Web of Science” (WOS), an electronic search engine
for accessing more than 8,500 research journals, and “Web of Knowledge,” an electronic search engine for accessing
multiple citation indices (including Science Citation Index, Social Sciences Citation Index, and Arts & Humanities
Citation Index, and over 100 years of backfiles). These may be accessed by annual subscription or on a pay-as-you-
go basis, and the company also offers to build “custom information solutions” for a fee. Many institutions have
existing access to these services, and more information about them can be found at http://scientific.thomson.com.
33

Overview of Evaluation Methods for R&D Programs
Performing citation analysis requires compilation of sufficient details of individual publications
and patents—not just counts—to provide accuracy and completeness of records needed to permit
searches. Attention typically is needed to ensure proper matching in database searches, e.g., to
determine if J. E. Smith is the same as Joe Smith.
After the pool of program-related publications or patents is identified, computerized tools can be
used to track subsequent publications or patents that refer as prior art to each of those that derive
from the program, and the links can be recorded. This process is repeated in turn for each of the
publications or patents that cite the originals until the chain of references is complete. The results
can be displayed in graphic format.
For patent citation analysis, the U.S. Patent Office now makes it possible for anyone to search
patent data on-line. And there are also special databases and search services which can facilitate
patent citation searches.
16
Patent Weasel: The Patent Weasel, developed by Pacific Northwest National Laboratory
(PNNL), is a data system for ferreting out trends and relationships in the DOE’s patent portfolio.
The system contains over 11,000 DOE patents and over 41,000 citing patents, reflecting over
61,000 citations. The Weasel allows users to identify, locate, and retrieve potentially interesting
technologies that have been developed and patented through DOE funded R&D efforts. Patent
Weasel Beta V1.2 can be ordered.
17
The examples section includes an example using this tool.
Limitations: There are several limitations of the method of counting and citation analysis. Issues
arise in terms of what to count. Quality issues arise in using counts of publications and patents as
output indicators, or counts of citations as an outcome indicator, because simple counts do not
distinguish differences in quality and in purpose. In publication analysis, weighting schemes have
been used to control for quality differences among journals in which publications and citations
appear. Citations counts have also been improved by adjusting for self-citing and for the practice
of citing work for which there is no real intellectual link. However, calibrating for quality
differences among scientific works remains imperfect, often inadequate, and time consuming.
Furthermore, problems with incomplete references and lack of attribution to program funding may
frustrate, limit, and bias counts and citation analysis and/or require data cleaning and additional
research before proceeding. A further limitation in comparing publishing and patenting rates
across different fields, specialties, and institutions is that publication and citing policies and
practices may vary by intention. Organization or country size, of course, influences publication
and patent outputs, and, hence, comparisons across organizations or countries of different size
16
For example, the National Bureau of Economic Research (NBER) provides detail information on about 3 million
U.S. patents granted from 1963-1999, all citations made to these patents from 1975-1999, and a broad cross-match to
firm data in Compustat, free for use by researchers (see www.nber.org/patents/
. Thomson supports patent citation
analysis using the Derwent World Patent Index, as a subscription service (see
http://scientific.thomson.com/support/patents/swpiref/reftools/search
). Previously CHI Research performed citation
analysis for a number of government R&D programs; since it refocused its business, several of its researchers have
formed a new company, 1790 Analytics LLC, which offers citation analysis in support of science program
assessments (see www.1790analytics.com).
17
Patent Weasel Beta V1.2 can be ordered using information at the WREN website, http://www.wren-
network.net/resources.htm.
34

Overview of Evaluation Methods for R&D Programs
require some form of standardizing, such as papers or patents per dollar of research budget.
Despite efforts to standardize, cross-discipline comparisons of outputs remain problematic—for
example, how does a paper in photonics compare with a paper in tissue engineering? Finally,
while counts show publication or patenting activity and an analysis of citations suggest the
popularity, and, by implication, the relative importance of underlying R&D to others, neither
provide an explicit measure of value to downstream users.
Uses:
To provide measures of program knowledge outputs and evidence of outcome in the form of
knowledge dissemination and knowledge spillovers.
To reveal linkages from Federal R&D to downstream outcomes.
To identify users of a program’s knowledge and technology, defined as those who cite its
papers and patents—a critical step in attempting to quantify the value of knowledge spillovers.
Examples: Four examples are provided. The first example illustrates the use of counts of patents
to compare the patent outputs over time of three R&D organizations, and it also shows annual
publication output for one of the organizations against its targeted output level. The second
example shows the use of DOE’s Patent Weasel to gain insight into the breadth of intellectual
property development in various technical areas funded by DOE and EERE. The third example
illustrates the use of two forms of “patent trees” to identify use of a project’s knowledge outputs
by others. The fourth example shows how publication citation analysis can reveal the influence of
Federal research on downstream, private-sector innovation.
Example 1: Using counts of publications and patents as outputs and performance indicators
The Department of Commerce (DOC) issues an Annual Report on Technology Transfer for the
National Institute of Standards and Technology (NIST), the National Oceanic and Atmospheric
Administration (NOAA), and National Telecommunications and Information Administration
(NTIA) that includes tables spanning several years with counts of multiple program outputs,
including patents from its three Scientific and Technical units (Table 2-3), and a table spanning the
same period with counts of technical publications produced by NIST (Table 2-4). These program
outputs are routinely compiled and made publicly available by DOC to show technology transfer
by these components of the agency.
Table 2-3. Counts of Patent Granted for NIST, NOAA, and NTIA, FY 1999-2001
1999 2000 2001
Patents Issued in the FY for Laboratory Inventions, total
NIST
NOAA
NTIA
28
26
2
0
16
14
2
0
22
20
1
1
Source: DoC Annual Report on Technology Transfer, FY 2001, June 3, 2002.
35

Overview of Evaluation Methods for R&D Programs
Table 2-4. NIST Publication Outputs, FY 1999-2001
Technical
publications
produced
1999
2,270
2000
2,250
2001
2,207 Annual number of technical publications generated by
NIST’s technical staff. The number is a direct count of the
number of technical publications cleared for publication by
the NIST Editorial Review Boards at the Gaithersburg and
Boulder sites. Over time, NIST expects a relatively
constant level of high quality publications (2,000-2,200 per
year) produced by its technical staff. Of the publications
produced annually, approx. 80% are approved for external
publication (such as in scientific journals); the other 20%
are NIST reports and special publications.
Source: DoC Annual Report on Technology Transfer, FY 2001, June 3, 2002.
Example 2: Using the Patent Weasel to identify patents and compare patent outputs resulting from
DOE-funded research with other patent output data
The analysis of patents showed that if DOE had retained the rights to all the patents issued to its
laboratories and contractors between 1976 and 2003, it would rank fourth in comparison with
American companies, ranking behind only IBM, GE, and Eastman Kodak.
18
Table 2-5
summarizes the DOE patent data uncovered by the Patent Weasel analysis.
Table 2-5. A Summary of DOE Patent Data Uncovered by the Patent Weasel
DOE Pate
te
nt an
a
a
n
d Ci
i
i
tation
n
on
Breakou
ut
DOE Pa nt
nt
d C tatio Bre
Bre
ak
a
o
ko
ut
DOE Pate nd C tati
Parameter EERE* SC FE Other Total
Total Patents 651 4,982 749 7,643 14,025
Percent of DOE Patents 4.6% 35.5% 5.3% 54.5% 100%
Total Citations 4,168 33,847 4,219 51,527 93,761
Percent of Total DOE Citations 4.4% 36.1% 4.5% 55.0% 100%
Average Cites per Patent 6.4 6.8 5.6 6.6 6.7
Avg Yrs to First Citation for Cited Patents 2.9 3.5 2.9 3 3.4
Total Non-DOE Citations 3,690 29,203 3,461 46,251 82,605
Average Non-DOE Cites per Patent 5.7 5.9 4.6 6.1 5.9
*EERE Patents were defined as originating from work conducted at NREL
or containing “EE” or “CE” in the reference contract.
Source: Eike, 2005.
18
This example of data generated by the Patent Weasel and conclusions drawn are based on a presentation by David
Eike, PNNL, 2005.
36
6
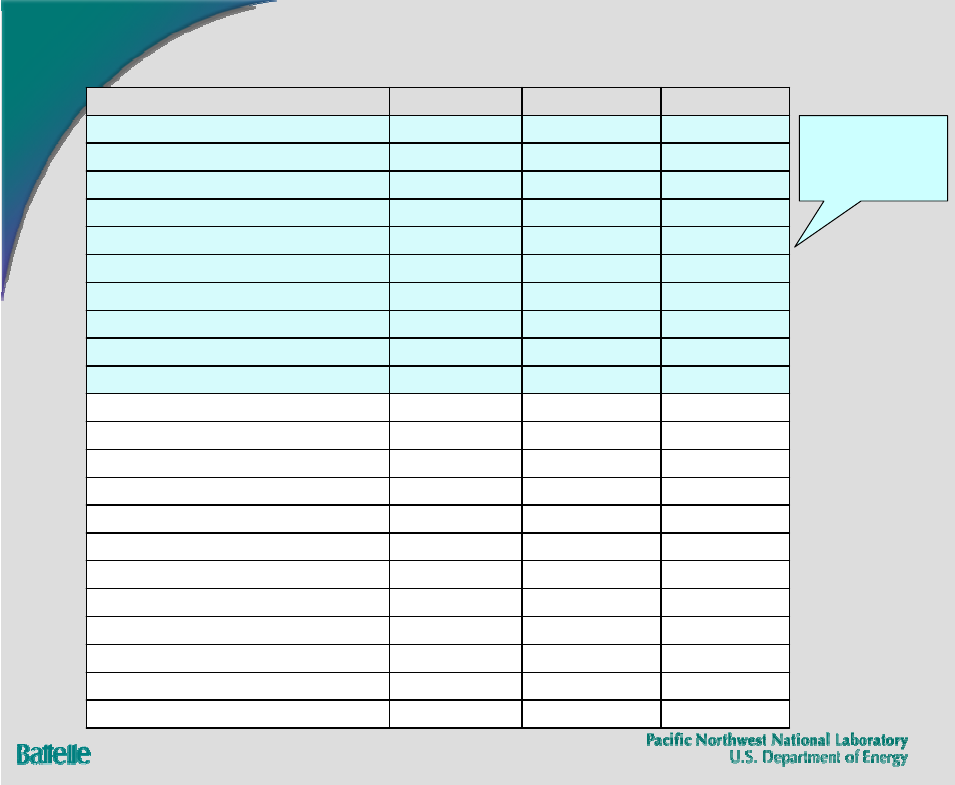
Overview of Evaluation Methods for R&D Programs
Table 2-6 shows the EERE patents by technology classification as a percentage of all DOE patents,
and indicates those areas in which EERE patents are a greater percentage than predicted. Figure
2-4 shows all citations of DOE patents by technology area.
Table 2-6. A Summary of EERE Patents by Technology Area and as a Percent of All DOE Patents
EERE Patents by
t
EER
ents by
E Patents by
Class as Percent of All DOE Patent
a
a
ss as Percent of All DOE Patents
ss as Pe ent of All E Patents
EERE Pa Cl
Cl rc DO
USPTO Classification All DOE EERE EERE %
Semiconductors 202 44 22%
Crystals 98 13 13%
Fluid handling 153 19 12%
Electricity and electrical devices 1118 128 11%
Coating processes/apparatus 310 31 10%
Active solid-state devices 98 9 9%
Engines, motors & pumps 413 28 7%
Power plants 169 10 6%
Chemistry 2738 155 6%
Heating & heat exchange 509 28 6%
Optics & optical systems 708 26 4%
Materials 1084 38 4%
Other 1760 57 3%
Computers & data processing 385 11 3%
Liquid purification or separation 235 6 3%
Refrigeration 164 4 2%
Metal working 608 14 2%
Gas separation 159 2 1%
Wells 86 1 1%
Radiant energy 696 8 1%
Measuring and testing 562 6 1%
Communications 218 2 1%
EERE %
greater than
predicted
Source: Eike, 2005.
37
14

8
Overview of Evaluation Methods for R&D Programs
Figure 2-4. Citations of Patents Funded by DOE by Technology Area
Source: Eike, 2005.
Example 3: Using project patent trees to show use of a project’s knowledge outputs by others
“Patent tree” diagrams can be used to show forward citations of patents from a program’s research.
Figure 2-5 shows two patents attributed to funding by the Advanced Technology Program (ATP)
of a single project carried out by Diamond Semiconductor Group (DSG). The two boxes in the
lower part of the illustration represent the patents granted to DSG and attributed to ATP funding.
The “balloons” linked to these boxes show subsequent patents (and the organizations holding the
patents) that cited the patents from the ATP-funded project. The lighter the shade of balloon, the
further removed is the citing patent from the original patent, moving from dark (first generation) to
lightest (fifth generation). With the passage of additional time, there are likely new branches that
have emerged as outgrowths of the earlier patents. To the extent that the later occurring patents
are dependent on the earlier ones, the patents in the patent tree represent developments in
knowledge that would likely not have occurred in the same timeframe, had the ATP not stimulated
the creation and dissemination of the underlying knowledge platform.
38

Overview of Evaluation Methods for R&D Programs
Figure 2-5. Illustrative Patent Tree for an ATP-funded Project Carried out by the Diamond Semiconductor
Group, LLC (DSG)
Source: ATP, Performance of 50 Completed ATP Projects, Status Report-Number 2, December 2001, Diamond
Semiconductor Group, LLC (DSG).
39

Overview of Evaluation Methods for R&D Programs
Figure 2-6 illustrates the use of a different graphical portrayal of the pattern of post-project patent
citations for an ATP-funded project conducted by Ingersoll Milling Company. In contrast to the
previous case, in this case the company went bankrupt, truncating the direct path to commercial
benefits. Nevertheless, this graph shows that the project generated knowledge in the form of a
single project-derived patent that was cited over the following years by multiple organizations.
Hence, the project’s long-run benefits in the form of knowledge spillovers may make the project
worthwhile even though the funded company went under, but the patent citation analysis alone is
merely suggestive of this and not conclusive.
Figure 2-6. Patent Tree for Ingersoll Milling Company – Patent 5,392,663 – Showing “Indirect” Project
Impact though the ATP-funded Innovator Went Bankrupt
Source: ATP, Performance of 50 Completed ATP Projects, Status Report Number 3, 2006, p. 11, Ingersoll
Million Company.
Patent trees can be valuable for showing knowledge spillovers from a program’s funded projects.
ATP, for example, used patent trees to demonstrate progress along an “indirect path” of program
impact–i.e., via knowledge flows–in supplement to benefits realized by the program through its
“direct path,” i.e., through commercialization of technologies developed by direct program
participants and their partners.
40

Biotechnology
Biotechnology
Chemicals
Chemicals
Chemicals
Overview of Evaluation Methods for R&D Programs
Example 4: Using publication citation analysis to show broad influence of Federal research on
downstream, private-sector innovation
An early study sponsored by NSF and conducted by CHI Research, Inc. (now ipIQ) used citation
analysis (enhanced by tracing institutional ties of authors) to provide strong evidence that
“publicly financed scientific research plays a surprisingly important role in the breakthroughs of
industrial innovation in the United States…”
19
The study found that 73% of the main science
papers cited by U.S. industrial patents in a two-year period were based on domestic and foreign
research financed by government or nonprofit agencies. The study called publicly financed
science the “fundamental pillar” of industrial advance, and “strongly suggested that publicly
funded science lies at the heart of most commercial innovation.”
20
DOE has furthered the art of citation analysis and sponsored its use to study the impact of DOE
science on emergent S&T areas. For example, as illustrated in Figure 2-7, DOE has used citation
analysis to show that DOE science is cited by others in a variety of S&T areas.
Figure 2-7. Illustration of patents citing DOE publications and patents in multiple emergent technical areas,
1985-2000
DOE science has value for a range of technologies
0 1000 2000 3000 4000
19
Number of citations from patents to technology area.
Patents 1985-2000 citing papers in 10 year, 2 year lagged window
Technology-science combinations with >200 citations are shown
328
233
206
3324
986
653
1465
1263
562
1626
489
391
349
255
244
201
Industrial Process Equipment
Plastics, Polymers And Rubber
Pharmaceuticals
Agriculture
Semiconductors And Electronics
Measuring And Control Equipmen
Miscellaneous Manufacturing
Computers And Peripherals
Fabricated Metals
Power Generation And Distribut
Office Equipment And Cameras
Chemicals
Biotechnology
Physical
Sciences
Life
Sciences
Chemistry
Source: Diana Hicks, Indicators of Knowledge Value, Conference on Estimating the Benefits of
Government
Sponsored Energy R&D, March 2002.
19
William J. Broad, “Study Finds Public Science is Pillar of Industry,” New York Times, May 13, 1997, Science Desk,
quoting from a study sponsored by NSF and conducted by CHI Research, Inc. (now ipIQ).
20
Ibid.
41

Overview of Evaluation Methods for R&D Programs
References
Advanced Technology Program, Performance of 50 Completed ATP Projects, Status Report-
Number 2, December 2001.
Advanced Technology Program, Performance of 50 Completed ATP Projects, Status Report-
Number 3, March 2006.
William J. Broad, “Study Finds Public Science is Pillar of Industry,” New York Times, May 13,
1997, Science Desk, quoting from a study sponsored by NSF and conducted by CHI Research,
Inc. (now ipIQ), and then under review.
David Eike, “From Lab to Market Place; Mapping DOE’s Intellectual Property,” presentation on
June 16, 2005.
Brownwyn H. Hall, Adam B. Jaffe, and Manuel Trajtenberg, “Market Value and Patent Citations:
A First Look,” NBER Working Paper 7741, National Bureau of Economic Research, Inc., 2001.
Diana Hicks, “Indicators of Knowledge Value,” Conference on Estimating the Benefits of
Government Sponsored Energy R&D, Crystal City, March 2002.
U.S. Department of Commerce, Annual Report on Technology Transfer, FY 2001, June 3, 2002.
U.S. Department of Energy, Office of Energy Efficiency and Renewable Energy, “EERE Joule
Guidelines”, Draft October 2006.
U.S. Department of Energy, Pacific Northwest National Laboratory (operated by Battelle
Memorial Institute), Information Visualization, URL: www.pnl.gov/infoviz/index.html.
The visualization software is described and published papers which provide more information on
visualization tools are referenced and abstracted.
U.S. Department of Energy, Pacific Northwest National Laboratory (operated by Battelle
Memorial Institute), Patent Weasel description.
42

Overview of Evaluation Methods for R&D Programs
2.4 Bibliometric Methods – Data Mining
Program Manager Goals:
• Improve Program
• Communicate why the program is worth doing
Four Phases of Program Performance Cycle:
1. Design/revise, plan, select, budget
2. Make R&D progress, review processes, achieve outputs
3. Disseminate outputs, achieve interim outcomes
4. Commercialization, market acceptance, energy savings,
energy security, other outcome s and impacts
Information Provided by Evaluation Methods:
• Planning information
• Indicators of interim progress
• Analysis of collaborative and other relationships
• Creation and dissemination of knowledge outputs
• Energy savings, economic, environmental, energy security, option and other
benefits, and benefit-cost measures
• Spillover effects
• Comparative standing
• Overview – was it worth it?
[Goals, phases, and information provided by this method are highlighted]
Data mining is a bibliometric method which searches texts for keywords to
identify the origin of important ideas and concepts. It is also used in
evaluation to identify the emergence of relationships among research
organizations and disciplines.
Definition
: Data mining is the extraction of key concepts or relationships from large quantities of
digitized natural language text. The method has also been called “literature-based discovery”
(LBD), a descriptive name. As in the case of the other bibliometric methods, this approach
focuses on written documents--a major output of research, and may include reports, publications,
and textual components of patents or other documents. Data mining enables the efficient and
effective management and use of large volumes of R&D texts by making it possible to integrate
across document collections and to discover new information from existing sources.
How data mining studies are organized, conducted, and analyzed:
Data mining studies are organized to automate searches of large volumes of information in order
to identify relationships and patterns of interest that would be slow, and difficult or impossible to
find by human analysts working without specialized tools. Conducting a data mining study starts
with the availability of subject texts in digital form; proceeds with computer processing using
various search and analysis algorithms to extract useful information, and finishes with human
analysis and interpretation of the results. Databases of technical reports, such as a program’s
database of its own reports and the many others that now exist (including, for example, Science
43

Overview of Evaluation Methods for R&D Programs
Citation Index, Engineering Compendex, Medline, NTIS Technical Reports, and RAND’s
RaDiUS database) can provide sources of text. Specialized data mining tools, developed and
supplied by a variety of vendors, facilitate the processing step; examples include WORDSTAT a
data mining module for SIMSTAT, SPSS tools for data mining, SAS data mining tools, among
others. Information visualization support, such as that provided by PNNL, added to data mining
serves as a valuable assist in gaining insight from the results.
Limitations: Data mining has its primary applications in commerce, e.g., to identify what
products are likely of interest to a given customer, and how to promote them; in homeland security
and national defense, e.g., to uncover patterns in communications of terrorists and military groups.
The method has been less used by most Federal agencies for R&D evaluation--probably because
of its emphasis on supporting future decisions rather than assessing the results of past investments.
Yet, several agencies, including DOE, have used the method for evaluation and have developed
supporting tools. An early barrier to using the method was the large resource requirement, but this
has been overcome by highly efficient automated data mining systems, the availability of large
amounts of computing power, and the digitization of text.
Uses:
21
To show the origin of important ideas and concepts; more specifically to show that past
investments in an R&D program contributed to emergent fields and technologies.
To show relationships among research organizations and disciplines.
To influence public S&T policy by providing decision makers insight into how cutting-edge
technologies develop from combinations of diverse research efforts over time.
To gather technical intelligence that may alert evaluators to developments in precursor, rival,
or complementary technologies affecting the impact of a technology of interest.
To provide information to help program managers make decisions to design or revise their
program, re-direct existing R&D funds, or allocate new funds.
To help guide investment decisions in R&D in emergent areas.
Examples:
Three examples are presented. The first uses data mining and data visualization in
combination to uncover relationships among research supported by the National Science
Foundation (NSF) and by the National Institutes of Health (NIH). The second example combines
data mining and data visualization to show how specific DOE publications and patents are linked
to the emergence of nanotechnology as a technical field. The third example, from the Navy,
shows the use of data mining to uncover technical intelligence that may be useful for evaluation.
Example 1: Using data mining with data visualization to uncover research relationships
21
The uses featured here are those that relate most directly to evaluation. Additional uses in S&T include extracting
useful pieces of information from text that may lead to further discovery and innovation, and to uncover connections
between seemingly unconnected disciplines and research fields in order to accelerate potentially radical discovery and
innovation.
44

Overview of Evaluation Methods for R&D Programs
Figure 2-8 shows the coupling of data mining with data visualization to assess interagency and
multidisciplinary S&T relationships at two NSF research units—Directorate for Biological
Sciences (BIO) and Directorate for Social, Behavioral & Economic Sciences (SBE), and two NIH
research units—National Cancer Institute and National Institute of Mental Health). PNNL’s
“Galaxies” software is used to accomplish the display.
22
Areas where the research comes together
may be seen by adjacent color combinations. The software supports “visually going into the data”
to take a closer look at areas of interest.
Figure 2-8. Data mining with Data Visualization Showing Relationships among
Research Documents Produced by Two NSF Units and Two NIH Units
Source: Roberts et al, 2005
Example 2: Using data mining with visualization to show emergence of a field, with DOE papers
and patents superimposed to show specific DOE contributions
Analysts at PNNL used data mining to analyze the emergence of the field of nanotechnology by
uncovering the use of variants of the term “nano” in the open literature from 1988 forward.
23
As
illustrated in Figure 2-9, they used data visualization software to depict this emergence as an ever-
widening river over time as use of the term grew. Then, they superimposed specific DOE papers
and patents over the flow, indicating their time of occurrence relative to the emergent field.
It should also be noted that among the DOE-contributed papers overlaid on the chart are several
which have been identified by the Institute for Scientific Information as among the top 25 highly
22
In addition to galaxy displays of information, topics or themes of interest within a set of documents can be
displayed in other ways, such as a relief map of natural terrain or as a river that widens or narrows to depict changes in
time-related patterns.
23
Eike, 2004.
45

Overview of Evaluation Methods for R&D Programs
cited papers in the field of nanotechnology. This information reinforces the role of DOE research
in development of the field.
Figure 2-9. Data Mining with Visualization to Show Emergence of Nanotechnology
Source: Eike, 2004.
Example 3: Using data mining to develop a larger picture and technical intelligence perspective of
selected technical fields
As described by Kostoff, the Office of Naval Research (ONR) has used data mining to derive
technical intelligence from the published literature on fullerence science and technology, including
the theory, experimentation, computations, and applications related to large ordered carbon atom
clusters.
24
Kostoff describes the use of the method also to obtain technical intelligence on aircraft
S&T, power sources, and other applications of science and technology. He explains how the
method has been used to identify what is state-of-the-art in a given technology area, identify the
most active and prolific researchers and organizations in a technical area, identify closely related
themes to a given technology, and develop program investment strategies.
Using textual mining to gain technical intelligence similarly could be helpful in evaluation to
identify prerequisite, rival, and complementary technologies whose successful development and
24
Kostoff (undated).
46

Overview of Evaluation Methods for R&D Programs
deployment might change the expected impact of technologies under development or planned by a
U.S. R&D program.
References
David Eike, Battelle--Pacific Northwest National Laboratory, “Visualizing the Flow of
Knowledge from Laboratory to Marketplace,” presentation at the AAAS Annual Meeting, Seattle,
February 14, 2004.
Ronald N. Kostoff, Office of Naval Research, Science and Technology Metrics. (Available on-
line at www.onr.navy.mil/sci_tech/special/354/technowatch/docs/050510_metrics_main_text.pdf
.
Robert E. Roberts, Pamela Ebert Flattau, and Bhavya Lal, “Quantitative Models for Guiding
Complex S&T Investment Strategies,” presentation at the International Workshop on the
Evaluation of Publicly Funded Research, Berlin, September 26, 2005.
U.S. Department of Energy, Pacific Northwest National Laboratory (operated by Battelle
Memorial Institute), Information Visualization, URL: www.pnl.gov/infoviz/index.html.
The visualization software is described and published papers are referenced and abstracted which
provide additional information on combining data mining and visualization.
47

Overview of Evaluation Methods for R&D Programs
2.5 Bibliometrics -- Hotspot Patent Analysis
Program Manager Goals:
• Improve Program
• Communicate why the program is worth doing
Four Phases of Program Performance Cycle:
1. Design/revise, plan, select, budget
2. Make R&D progress, review processes, achieve outputs
3. Disseminate outputs, achieve interim outcomes
4. Commercialization, market acceptance, energy savings,
energy security, other outcome s and impacts
Information Provided by Evaluation Methods:
• Planning information
• Indicators of interim progress
• Analysis of collaborative and other relationships
• Creation and dissemination of knowledge outputs
• Energy savings, economic, environmental, energy security, option and other
benefits, and benefit-cost measures
• Spillover effects
• Comparative standing
• Overview – was it worth it?
[Goals, phases, and information provided by this method are highlighted]
A recently developed, specialized application of patent analysis in
bibliometrics is “Hotspot Patent Analysis,” which looks at patenting frequency
to identify patents that appear to be having a particularly large impact on
innovation and also “Next Generation Patents,” which are building on
“Hotspot Clusters.” This analysis helps to assess the relative importance of a
program’s patents to technological innovation.
Definition: Hotspot patent analysis identifies patents that are highly cited by recently issued
patents. The technique offers an unobtrusive and unbiased way to uncover technological “hotspot
clusters,” i.e., patented technologies that are currently having a large impact on innovation.
According to recent studies, approximately 2% of recent patents are designated hotspots. Old
patents can also be hotspots if there is a recent big spike in citations of them. (These are
distinguishable from a “citation classic,” a patent consistently cited over many years.)
Related are “next generation patents” which are the current patents citing the hot-spot patents.
According to recent studies, approximately 24% of recent patents have been designated next
generation patents. For a Federal R&D program, generating a high percentage of patents that are
rated as “hot-spot patents” signals strong inventive activity by the program; conversely, spawning
few high-spot patents may suggest that the program’s inventions are offering incremental
improvements or concepts with little perceived current value. Generating a high percentage of
“next-generation patents” suggests that a program is funding applications that are building on hot-
48

Overview of Evaluation Methods for R&D Programs
spot clusters. The hot-spot and next-generation methodology arises out of bibliometric work with
patents and offers new patent metrics.
How hot-spot patent studies are organized, conducted, and analyzed:
Hot-spot analysis is a specialty method developed by researchers formerly at Chi Research, Inc.
The several studies that have been conducted for Federal R&D programs using the technique have
been organized, conducted, and analyzed by researchers then with Chi Research.
25
The analysis
requires preliminary patent data analysis and cleaning. The approach is suitable for assessing
multiple technology areas and large programs, but can also be carried out for a given technology
area or for a sub-group of related technologies. Such an analysis, for example, could be used to
highlight important organizations and regions contributing to a field, and to identify those doing
the high-impact research.
A hot-spot patent was defined in past studies as having at least 10 or more recent citations, and
recent citations as a proportion of total citations was set proportional to the age of the cited patent.
To be considered a hotspot patent, an old patent had to have at least 25% of its citations to be
recent. The patents recently citing hot-spot patents—i.e., “the next generation patents”—are those
building on the hotspot patents and are an important aspect of the analysis, because they may
signal applications developing around generic technology platforms or widely applicable science
concepts. Highly cited patents granted to businesses have been found to correlate well with
inventor awards, increases in sales, profits, rise in stock prices, patent licensing, and successful
products. Because it provides a means of identifying high-impact technology among companies
and other organizations, the approach is relevant to competitive technical intelligence for
businesses and governments. It is also relevant to public policy as a tool for identifying trends in
innovation and for assessing an R&D program’s contribution to emerging “hot” technology areas.
Additionally, the analysis can show who is citing whom and where the companies with the hotspot
patents and second-generation patents are located. Thus, the analysis can be useful in analyzing
collaboration and regional influences, as well as assessing the appropriateness and effectiveness of
the outreach activities of public programs.
Limitations: Whenever patent data are used, there tends to be issues with the completeness and
accuracy of data records, requiring preliminary attention to data cleaning. In the case of hotspot
analysis, experience with applying the method and interpreting the results is limited, the number
of experienced practitioners is limited, and familiarity of stakeholders with the concept is also
limited. Interpretation of results and their implications for different Federal R&D programs with
their differing objectives may be subject to debate and may require further reflection and
refinement. For example, will a given program prefer to generate hot-spot technologies or next-
generation patents? Is it reasonable that the positioning of some R&D programs will direct them
towards incremental technological improvements and away from both hotspot and next generation
technologies? Additional use, analysis, and discussion of the method will help to clarify these
issues.
25
CHI Research was bought by ipIQ and now operates as ipIQ. The developer of the hot-spot method, Anthony
Breitzman, and the two other researchers who applied the method for DOE and ATP, Patrick Thomas and Diana
Hicks, all formerly with CHI Research have relocated. Anthony Breitzman and Patrick Thomas are now at 1790
Analytics, and Diana Hicks is now at the Georgia Institute of Technology.
49

Overview of Evaluation Methods for R&D Programs
Uses:
To identify current clusters of intensive innovative activity and developing “hot” trends in
technology.
To assess the positioning of an R&D program’s output (as measured by patents and citations of
the agency’s publications by patents) relative to new and developing clusters of innovative
activity.
To identify the regional impact of a public R&D program in order to better organize the
program’s outreach activities.
To analyze the organizational and collaborative characteristics of identified clusters of
innovative activity.
To analyze hotspots in a selected technology area (e.g., fuels, alternative vehicles, etc.) in order
to assess how these hotspots and next generation patents are linked to an R&D program (e.g.,
EERE).
To gather competitive technical intelligence for R&D organizations.
To provide information to help program managers make decisions to design or revise their
program, re-direct existing R&D funds, or allocate new funds.
Examples: Both DOE’s Office of Science and DOC’s ATP have sponsored studies using the hot-
spot method. Examples are given for both.
Example 1: Hot-Spot technology analysis for DOE’s Office of Science
Building on work done in the private sector to identify investment opportunities in undervalued
companies through valuations of company intellectual property portfolios and identification of
“hot” technology areas, DOE sponsored use of the technique to assess and compare hot-spot
results for the Office of Science and several other agencies.
Figure 2-10 shows the technology areas with the largest number of hotspot patents from all patents.
Figure 2-11 shows the technology areas with the largest number of hot-spot patents that cited
papers funded by DOE, NASA, NSF, and NIH.
The study found a linkage between hotspot patents and publicly funded science as indicated by
funding acknowledgements in papers cited in the patents. It concluded that patents citing papers
funded by publicly funded science agencies were more likely to become hotspot technologies than
other patents. It found that DOE, NASA, NSF, and NIH all have strong links to hotspot patents in
different technology areas, but that DOE led NASA, NSF, and NIH in the percentage of patents
citing the agency’s papers that became hotspot patents. Patents that cited papers funded by
multiple agencies were found to be even more likely to become hotspot patents. The study also
found that patents citing public science were more likely to be next generation patents than other
patents.
50

Overview of Evaluation Methods for R&D Programs
Figure 2-10. Technologies with the Largest Number of Hotspot Patents
Source: Valdez presentation of March 2005, using material from a study performed by CHI Research.
Figure 2-11. Technologies with the Largest Number of Hotspot Patents Citing Papers
Funded by DOE, NASA, NSF, and NIH
Source: Valdez presentation, March 2005, using material from a study by CHI Research.
In addition, the study performed geographical analysis of hotspot patents. Figure 2-12 shows the
states with the largest number of hot-spot patents linked to DOE-funded science.
51

Overview of Evaluation Methods for R&D Programs
Figure 2-12. States with the Largest Number of Hotspot Patents Linked to DOE-funded Science
California
Massachusetts
New Mexico
New York
Tennessee
New Jersey
Connecticut
Pennsylvania
Texas
Arizona
Washington
Oregon
0 40 80 120 160 200
Number of Patents
Source: Patrick Thomas, 1790 Analytics
Example 2: Hotspot Technology Analysis for ATP
Researchers conducted a hotspot study for ATP that analyzed hotspot technologies for two time
periods: 1998 and 2002. For the 1998 period, the study identified total hotspot patents numbering
10,038, next generation patents numbering 43,223, and next generation clusters numbering 2,071.
For the 2002 period, the study identified 16,451 hotspot patents, 66,216 next generation patents,
and 5,455 next generation clusters. Figure 2-13 shows the regional distribution of hotspot patents
in 2002.
The study, conducted by researchers Anthony Breitzman and Diana Hicks, examined patents
attributed to ATP funding within the context of hotspot and next generation patents. Roughly
twice the number of ATP patents was found in the next generation set than would be predicted
based on a similar sized sample from the general population of patents. Forty-four percent of
ATP-related patents were found in the 1998 next generation cluster and 47 percent were found in
the 2002 next generation cluster, as compared with 24% in the total population.
The study’s conclusion was that the association between ATP-related patents and next generation
clusters is higher than would be statistically expected were not ATP’s funding of technology
differentiated from the norm. Clusters of next generation patents containing ATP-related patents
were found to have higher than expected science linkages meaning that the ideas are closer to
basic science, a high degree of public sector participation, and a high degree of multiple prior art
references.
Figure 2-13. Regional Distribution of Hotspot Patents in 2002
52

Overview of Evaluation Methods for R&D Programs
Figure 2-13. Regional Distribution of Hotspot Patents in 2002
Source: ATP Advisory Committee presentation by Chang, May 2004, using a graph
developed by Breitzman and Hicks.
References
Patrick Thomas, principal, 1790 Analytics LLC, East Gate Center, Suite 200, 309 Fellowship
Road, Mount Laurel, NJ 08054 (www.1790analytics.com
), provided background information on
application of the hotspot method.
U.S. Department of Energy, Office of Science, PowerPoint presentations by Bill Valdez,
“Evaluation Research Policy Development,” March 2005, and an untitled presentation, September
2005.
53
Overview of Evaluation Methods for R&D Programs
U.S. Department of Commerce, Advanced Technology Program, Advisory Committee, National
Institute of Standards and Technology, Minutes of the Committee, May 13, 2004, Gaithersburg,
MD. (Material on the Hotspot Technology Study, performed by Breitzman and Hicks, drawn
from a presentation by Connie Chang to the Advisory Committee); and “New Method for
Identifying Early-Stage Technologies via Patent Analysis,” a fact sheet prepared by Connie Chang,
Highlights from ATP’s Economic Studies, Factsheet 1.C.7. (The fact sheet provides highlights in
advance of ATP’s publication of the hotspot research report (in press), by Anthony Breitzman
and Diana Hicks.)
54

Overview of Evaluation Methods for R&D Programs
2.6 Network Analysis
Program Manager Goals:
• Improve Program
• Communicate why the program is worth doing
Four Phases of Program Performance Cycle:
1. Design/revise, plan, select, budget
2. Make R&D progress, review processes, achieve outputs
3. Disseminate outputs, achieve interim outcomes
4. Commercialization, market acceptance, energy savings,
energy security, other outcome s and impacts
Information Provided by Evaluation Methods:
• Planning information
• Indicators of interim progress
• Analysis of collaborative and other relationships
• Creation and dissemination of knowledge outputs
• Energy savings, economic, environmental, energy security, option and other
benefits, and benefit-cost measures
• Spillover effects
• Comparative standing
• Overview – was it worth it?
[Goals, phases, and information provided by this method are highlighted]
Network analysis, which shows linkages among researchers or organizations
and how they develop over time, is useful in assessing a program’s impact on
collaboration and emerging roles and positions of influence of researchers and
organizations. While bibliometric methods show how knowledge is
disseminated via citing publications and patents, network analysis shows how
knowledge—particularly tacit knowledge—is disseminated via a variety of
communication flows. Development of research networks is significant
because it is expected to increase research capabilities, progress, and impacts.
Definition: Known variously as “Social Network Analysis” (SNA), “Organizational Network
Analysis,” (ONA), or just “Network Analysis” (NA), this is a method of visually mapping and
measuring relationships and linkages among researchers, groups of researchers, laboratories, or
other organizations. Network analysis is relevant to evaluation of R&D programs because it
identifies routes of interactions by which ideas, knowledge, and information flow among
participants in R&D, thereby possibly influencing the nature, quality, quantity, and speed of
research and innovation, as well as the dissemination of created knowledge through the network.
The underlying concept is that the conduct of science is a social activity collectively performed
and resulting in “communities of practice.” Advances in knowledge stem from knowledge sharing
and knowledge combining activities. Networks can link researchers to a rich flow of ideas and
information. A network of researchers creates a knowledge system that may yield much more
than the individuals acting independently. The network analysis method, which examines flows of
55
Overview of Evaluation Methods for R&D Programs
knowledge into and through the social network, is seen as a promising approach to understanding,
predicting, and improving knowledge outcomes. Network shape, size, and density can serve as
indicators of the strength of communities of practice and signal relative roles and relationships.
How network analysis studies are organized, conducted, and analyzed: Researchers, research
groups, and other entities in a network are denoted as nodes. The relationships or flows between
entities are called links, denoted as lines linking the nodes. Arrows show the direction of the
relationship (incoming arrows show that the node is a source of information and outgoing arrows
show the node seeks information from the linked node). Characteristics of the communication
flow or outputs such as e-mails, face-to-face contacts, papers and patents generated can be
indicated on the lines linking the nodes. A sequence of links from one node to another is called a
path. Data for diagramming networks are collected in a variety of ways, such as by conducting
interviews or surveys, tracking e-mail flows, observing interactions, assessing co-authorship, and
analyzing resumes of researchers. To analyze results of network analysis, several measures are
used. One measure is of centrality, based on the number of direct links one node has to other
nodes. Another measure indicates the extent of influence a node has over flows in the network to
other nodes. A third measure indicates how closely linked a nodule is both directly and indirectly
to all other nodules in the network. An entity in a network may be a “hub,” i.e., a node with a high
degree of centrality and also important as a link to other parts of the network. An entity may be a
“peripheral player,” a node on the periphery of an identified network. It may be a “boundary
spanner,” a node connecting one network cluster to another. “Clusters” may develop within
networks, i.e., groups within the network connected through multiple links. Analysis of networks
can reveal areas of potential failure, such as the vulnerability of a highly centralized network to the
departure of a key researcher. It can also reveal areas of strength, such as clusters with connection
redundancies that make them less vulnerable to removal of single links or nodes. The density of a
network that develops around research entities may signal their relative importance. Network
software packages are available for assisting with the drawing of network diagrams and
computation of measures.
Limitations: While a network diagram and analysis can reveal the extent of collaboration and
may suggest the importance of a program’s R&D to others, it does not provide a quantitative
measure of its value. A network diagram may be time limited: it shows the relationships as of a
specific point in time, such that repeating the process after a time interval is necessary to reveal
changes in the network over time. Costs can be a limiting factor in the use of network analysis
because determining networks can require many interviews or time-consuming analysis of
resumes, or the like to trace the network, particularly if the evolution of a network is traced across
time and takes into account both formal and informal connections..
Uses:
To analyze the impact of R&D policies on collaborative activity.
To reveal dominant researchers or research organizations, and/or to assess the openness of
networks to new members.
To improve understanding of how and why collaborations develop, what form they take, and
their dynamics.
56

Overview of Evaluation Methods for R&D Programs
To investigate and demonstrate the impact of an R&D program on applications by examining
the flow of knowledge among researchers, groups of researchers, and users.
To identify and foster emergent knowledge systems; to assess their strengths and weaknesses.
To highlight the importance to participants of intangible asset development, and to assess more
fully knowledge spillovers.
To provide information to help program managers make decisions to design or revise their
program, re-direct existing R&D funds, or allocate new funds.
Examples: Two examples of network analysis are provided below. The first example illustrates
primarily the first and second listed uses. The second example illustrates primarily the third and
fourth listed uses. To some extent, both examples also illustrate the other uses listed.
Example 1: Using network analysis to examine the impact of R&D policy on collaborative
activity and to assess network access by new members
The European Commission’s Sixth Framework Programme (FP6, 2002-2006) had a goal of
promoting denser and more diverse research collaborations. Although it will be years before the
impact of FP6 on economic growth is known, and many months before outcomes such as patents
granted, products, papers, and participation can be assessed, it is possible now to examine patterns
of collaboration and evaluate the impact of FP6 on research networks in Europe. A recent paper
describes an evaluation of research networks created by FP6 calls 1 and 2.
26
The study was conducted to gain insights into the degree to which Information Society (IST)
researchers were collaborating and the impact of the new FP6 Instruments on the integration of
IST research. The study also developed and refined tools and datasets for the analysis. It assessed
six research areas, known as “Strategic Objectives,” within the European Commission’s research
IST Thematic Priority, using three types of analysis: network structure analysis, content analysis
of the types of participants in the network, and value analysis based on survey data to understand
the motivations of participants for joining the networks.
The study found that the Framework Programme (FP) has provided a major integrating function
and has created an intensely linked network of IST research collaborations in Europe. The
funding has helped to connect universities and businesses, connect researchers in different sectors
and disciplines, integrate new member states into collaborations, integrate key patent-holders, and
integrate small businesses. The study found that FP6 resulted in increasing the interconnectedness
of network participants more than the previous FPs did. The study raised the concern that large
institutes and companies act as “gate-keepers” to Framework participation, and, that while
providing stability over time, this may have had a crowding-out effect on small and medium
establishments. The study also found that a strong motive for participation in the F6 networks was
to obtain improved capabilities, tools, methods, or techniques, relationships, and access to world-
class knowledge, i.e., intangible asset development, rather than to develop new products and
services.
26
Cunningham and Wagner, October 2005 and November 2005.
57

Overview of Evaluation Methods for R&D Programs
Example 2: Using network analysis to understand the dynamics of collaborative activity and to
investigate and demonstrate the impact of science on applications
The Department of Energy sponsored social network analysis conducted by researchers at the
University of Southern California to investigate the flow of knowledge through networks of DOE
scientists in order to pursue the following three research questions: (1) what approaches to
modeling a network are useful for displaying and analyzing the flow of value within and from the
network, (2) what are the attributes of a research network that facilitate the flow (leverage) of
value through the network, and (3) what organizational features facilitate forms of network?
27
Of two studies conducted to date, one examined a research network that evolved over 16 years,
beginning in 1987. The research aimed at developing and evolving the capacity to use Massively
Parallel Processing (MPP) to do large-scale scientific and engineering modeling and simulation.
Early, multi-disciplinary work on MPP involving break-through research in mathematical
computations and computer science demonstrated that MPP could be used to solve complex
scientific problems. The work was centered at Sandia National Laboratories.
The study’s data collection methods included a survey to define collaborations, identify sources of
knowledge, and define the value of knowledge flowing through links. Data collection methods
also included interviews to compile qualitative data to inform the history of and activities in the
subject network, the nature of collaborations, and organizational features. In addition, the study
analyzed archival material (resumes) to assess demographic attributes. Beyond network depiction
and measurement, the study used qualitative case analysis and multivariate analysis as
complementary methods to deepen the analysis.
In addition to the standard knowledge/communication network questions, i.e., who gets
knowledge from whom and who talks to whom, the study focused on the extent and kinds of
collaboration in the network, as well as the type of knowledge passed among members of the
network, its value as judged by the recipient, and how critical the knowledge was to the work of
the survey respondent. Respondents were asked to choose among answers a-c: The knowledge
was (a) helpful learning but did not contribute directly to their solving the problem; (b) provided
content information and/or methodological information that influenced the way they approached
the problem and/or expedited the process of moving to solution; or (c) was critical in determining
the way they approached and solved the problem and/or was able to be incorporated into their
work.
Figure 2-14 shows the “sources of knowledge” network -- one of many network diagrams
produced by the study. The colored lines indicate the multiple kinds of knowledge flowing across
the same link: 1) mathematical theoretical knowledge; 2) MPP methodological knowledge; 3)
knowledge from a different basic discipline; and 4) knowledge about the application.
Study findings centered on identifying the dynamic networks, the organizational conditions for
self-forming networks, and the organizational conditions facilitating the flow of knowledge.
Among the MPP case study’s findings, the following are illustrative of those concerning dynamic
networks: (1) Network connections were found to be self-forming. (2) Network connections
stretched across multiple labs within Sandia, across multiple national laboratories across the
27
Mohrman, Galbraith, and Monge (2004).
58

Overview of Evaluation Methods for R&D Programs
country, and across multiple universities and corporations. (3) The networks followed lateral lines,
and had little operational contact with the hierarchical dimension of the organizations. (4) As the
work proceeded through phases, the nature of the knowledge and structure of the knowledge
network changed to fit the task.
Figure 2-14. Examining Network Connections in Four Phases of Activity of The Development: (1) The
First Test Adopter, (2) Early Adopters, (3) Wide-spread Adoption, and (4) Focus on Capability
Development.
Sources of Knowledge: Multiplexity of Types of Knowledge
Note: MICS is the Applied Math Directorate in the DOE Office of Science.
Source: Mohrman, Galbraith, and Monge, 2004.
59

Overview of Evaluation Methods for R&D Programs
References
Frank Cunningham and Caroline Wagner, “Evaluating Research Dynamics Using Network
Analysis (in the context of EU funded R&D)” presentation at the American Evaluation
Association Annual Conference, October 2005. View at www.wren-network.net under AEA 2005.
Susan A. Mohrman and Jay R. Galbraith, Dynamics of the Adaptive Mesh Refinement (AMR)
Network: The Organizational and Managerial Factors that Contribute to the Stream of Value
from the Basic Research Funding of the Office of Science, 2005. (Another study example)
Susan A. Mohrman, Jay R. Galbraith, and Peter Monge, Network Attributes Impacting the
Generation and Flow of Knowledge within and from the Basic Science Community, funded by
Sandia National Laboratories and the Office of Science, 2004.
Caroline S. Wagner and Frank Cunningham, “The Critical Link: Evaluating Research Dynamics
Using Network Analysis,” APPAM Meeting, November 2005. View at
www.appam.org/conferences/fall/dc2005/sessions/downloads/0642.doc.
60

Overview of Evaluation Methods for R&D Programs
2.7 Case Study Method
Program Manager Goals:
• Improve Program
• Communicate why the program is worth doing
Four Phases of Program Performance Cycle:
1. Design/revise, plan, select, budget
2. Make R&D progress, review processes, achieve outputs
3. Disseminate outputs, achieve interim outcomes
4. Commercialization, market acceptance, energy savings,
energy security, other outcome s and impacts
Information Provided by Evaluation Methods:
• Planning information
• Indicators of interim progress
• Analysis of collaborative and other relationships
• Creation and dissemination of knowledge outputs
• Energy savings, economic, environmental, energy security, option and
other benefits, and benefit-cost measures
• Spillover effects
• Comparative standing
• Overview – was it worth it?
[Goals, phases, and information provided by this method are highlighted]
Case studies use narratives supported by data to describe, explain, and explore
phenomena and events. Case studies are a particularly useful strategy for
addressing how and why questions within a real-life context. For example,
case studies can be used to shed light on how innovation occurs, why certain
decisions are made, and why some processes work better than others.
Definition: The case study method presents information through a narrative about the subject,
often with supporting data displayed in tables and graphs. Case study is a method widely used by
R&D programs for evaluation—both to describe programs and how they work and to investigate
underlying functional relationships. One reason for its widespread use is that the narrative can
often capture the richness of detail and complexities of scientific research and development—
particularly for a non-scientific audience, while quantitative results can be often be provided with
little additional effort. Another, related reason is that case studies put meat on the bones of
statistics and deepen stakeholder understanding of the subject of inquiry. The case-study
narrative provides context and explanation for accompanying quantitative findings. Case studies
for evaluation are distinguishable from “success stories” used by most programs in a public
relations mode in terms of their comprehensive treatment of all aspects of their topic—both
positive and negative.
How case studies are organized, conducted, and analyzed: Case studies may be conducted as
single, stand-alone products, or as a body of work consisting of multiple cases. The information
61

Overview of Evaluation Methods for R&D Programs
used to develop a case study often comes from multiple sources, such as interviews, direct
observations, existing databases, and literature searches. In addition, results from studies using
other evaluation methods may inform case studies, just as case studies may inform studies using
other evaluation methods. When conducting a body of comparable case studies, analysts typically
look for common themes and emergent trends, patterns, and explanatory factors. Analyses of
cases often lead to the identification of potential issues or the formulation of theories or
hypotheses about program or process dynamics that can be formulated for further testing using
other, more quantitative methods. Emphasis in a case study is typically on the narrative, with
quantitative results in a supporting role, but there is often a strong mix of the two.
As with applying the other methods, undertaking a case study requires a research design. A useful
starting point is to define the proposition(s) of interest and an initial set of questions to be asked
and answered to identify the relevant information. The next step is to identify the unit(s) of
analysis, such as a person, company, program, organization, or groups of persons, companies,
programs, and organizations. The next step is to develop an action plan for collecting, analyzing,
and interpreting observations. Development of an interview guide is recommended for conducting
interviews, particularly when multiple cases are to be undertaken, to help stay focused on the
topics of interest and to replicate topical information. Case studies that are exploratory in nature
will generally be less structured than cases that are descriptive or explanatory, but a hallmark of all
case studies is to take advantage of unexpected opportunities while keeping firmly in mind the
issues under study. Carrying out the information collection phase and writing case-study results
demand an experienced investigator and writer. The case study investigator and writer should
have a good grasp of the issues being studies and should be unbiased—equally responsive to
supportive and contradictory evidence regarding the issues being studied.
28
There is no single format, rather there are a variety of formats or structures which may be used for
writing case-studies. One format is the chronological structure, reflecting cases that cover events
as sequences over time. Descriptive case studies are often presented using key areas of
information as subtopics, such as the origin of a research idea, the source of technology, the role of
government, estimated sales, etc. Exploratory and explanatory case studies may present a series of
hypotheses, followed by what the case or cases show. A linear-analytical structure is one of
several other alternatives, whereby the purpose of the study is followed by the methodology, the
findings from information collected and analyzed, and then by conclusions.
Limitations: A principal limitation of the case study method is that to the extent that it provides
anecdotal evidence rather than quantitative evidence, it is generally considered less persuasive
than, for example, more comprehensive statistical approaches. Furthermore, it may be difficult to
generalize from descriptive case study results; other cases may show other results. However, if
sufficient representation of a population is provided through case study and through supporting
quantitative results, it may be possible to draw common themes from case studies that can be
generalized to a population.
Uses:
To explore the genesis of research ideas and their consequences.
28
Yin, 1994.
62

Overview of Evaluation Methods for R&D Programs
To tell the stories of the people, organizations, projects, and programs involved in
scientific pursuit.
To investigate underlying theories and explore process dynamics.
To answer specific what, why, and how questions.
To provide illustrative examples of how a program works.
To provide information to help program managers make decisions to design or revise
their program, re-direct existing R&D funds, or allocate new funds.
Examples: Examples of use of case study by agencies and other organizations as a component of
evaluation abound. Three examples are given to illustrate three different uses of case study,
emphasizing the versatility of the method. The first example demonstrates the use of case study
primarily for exploration—in this case to search for factors underlying success in research
collaborations. The second example demonstrates the use of case study primarily for
description—in this case to describe the short-run outcome status of a set of publicly funded
projects after government funding has completed. The second example also demonstrates that
case study can combine narrative and data collection. The third example demonstrates the use of
case study primarily for explanation—in this case to explain how a sample of firms use Small
Business Innovation Research (SBIR) grants to develop their businesses through innovation and
commercialization.
Example 1: Using case study to explore factors important to collaborative relationships
Researchers performed cases studies of 18 joint ventures co-funded by the Advanced Technology
Program and undertaken in the automotive industry between 1991 and 1997. The purpose of the
case study was to explore determinants of success in the collaborative activities.
29
Two measures
of joint venture success were defined: (1) whether the project achieved its technical objectives,
and (2) whether it produced a commercializable technology or product. The cases were performed
using informal interviews with participants in each of the joint ventures.
Among the case study findings were the following: (a) Increased trust and information sharing
among joint venture members was associated with joint venture success. (b) Experience working
together prior to the formation of the joint venture was associated with success of the joint venture.
(c) Vertically structured joint ventures in which members provide complementary goods and
services appear easier to manage than horizontally structured joint ventures whose members
provide competitive goods and services. (d) Joint ventures can have too many or too few
members for effective collaboration. (e) Stability of joint venture participants increases the
likelihood of success. (f) Co-location increases the likelihood of success.
The evaluators also looked at the contribution of the government program to collaborative success.
The program’s contribution took several forms, such as by requiring more commitment from top
management of joint venture participants upfront, by using the program’s application process to
29
Dyer and Powell, 2001.
63

Overview of Evaluation Methods for R&D Programs
foster goal-directed and well organized joint-venture projects, and by helping to overcome specific
barriers to collaboration.
The case studies also suggested that collaborations organized in response to the government
program are fostering expanding networks of experts with technical skills and know-how that
appear to be leading to improvements in products or processes outside the context of the
government-funded projects.
Example 2: Using case study to describe the outcome status of a set of publicly funded projects,
including systematic collection of supporting data
The selected example illustrates the extensive use of descriptive case study (in combination with
the systematic collection of indicator data) to provide progress reports on all completed R&D
projects funded by the Advanced Technology Program about four years after completion of each
research project. Each case study, which is approximately 3-5 pages in length, captures in
narrative form a funded technology and its development, the role played by ATP, technical and
business accomplishments to date, and the outlook for future progress. Data for key project inputs,
outputs and outcomes are systematically collected and aggregated to provide interim performance
metrics for use by the program. These include numbers of publications, patents, prototypes,
commercial products in the market and expected soon, employment effects, and awards received
from third-parties in recognition of scientific accomplishment and business acumen.
One hundred of these descriptive cases for ATP’s completed projects in a variety of technology
fields had been completed at the time of this report. They can be viewed online at
www.atp.nist.gov/eao/eao_pubs.htm, by selecting “Status Reports” at the top selection bar. The
set of project case studies includes all levels of project performance, ranging from poor to
outstanding based on success criteria. A four-star rating system,
30
based on the collected case-
study metrics, is used to score the performance of each project and to show the distribution of
project performance across the portfolio of completed projects. In this way, the system bridges
from project case study to portfolio management.
Example 3: Using case study to explain how firms use Small Business Innovation Research
(SBIR) grants to develop their businesses through innovation and commercialization
The National Research Council (NRC) included a large set of descriptive case studies as part of its
assessment of the SBIR program at five U.S. government agencies having the largest SBIR
programs, namely the Department of Defense, National Institutes of Health, Department of Energy,
National Aeronautics and Space Administration, and National Science Foundation. A set of case
studies was prepared for each agency’s SBIR program to supplement survey results and other
methods used to assess the program.
The case studies help to explain how small companies use the SBIR program to obtain early seed
capital to launch technologies—and often their businesses—and expand innovative capacity and
intellectual property portfolios. The case studies discuss company financing and
commercialization strategies, the outcomes of sample SBIR-funded projects, and summarize the
30
For an explanation of the 4-star rating system, see Ruegg, 2006.
64

Overview of Evaluation Methods for R&D Programs
views of company officials on the SBIR program. They help explain variations among the SBIR
program at these agencies.
These case studies will be presented as an important component of each of a series of five reports
the NCR is preparing on the SBIR program at each of the five agencies listed above. These
reports are expected to be published late in 2006.
References
Advanced Technology Program, Performance of 50 Completed ATP Projects, Status Report
Number 2, NIST SP 950-2 (Gaithersburg, MD: National Institute of Standards, December 2001);
update available on-line at www.atp.nist.gov/eao/sp950-2/chapter6-1.htm.
Jeffrey H. Dyer and Benjamin C. Powell, Determinants of Success in ATP-Funded R&D Joint
Ventures: A Preliminary Analysis Based on 18 Automobile Manufacturing Projects, GCR 00-803
(Gaithersburg, MD: National Institute of Standards Gaithersburg, MD, December 2001), and
Factsheet 1.E2 , December 2002 to present highlights of the Report.
National Research Council, The Small Business Innovation Research Program (SBIR) -- An
Assessment of the Department of Defense Fast Track Initiative, ed. Charles W. Wessner
(Washington, DC: National Academy Press); and also a forthcoming series of agency reports on
SBIR scheduled for release in 2006.
Rosalie Ruegg, Bridging from Project Case Study to Portfolio analysis in a Public R&D Program;
NIST GCR 06-891 (Gaithersburg, MD: National Institute of Standards and Technology, April
2006).
Robert K. Yin, Case Study Research; Design and Methods, Applied Social Research Methods
Series, Volume 5 (Thousand Oaks: Sage Publications, 1994).
65

Overview of Evaluation Methods for R&D Programs
2.8 Survey Method
Program Manager Goals:
• Improve Program
• Communicate why the program is worth doing
Four Phases of Program Performance Cycle:
1. Design/revise, plan, select, budget
2. Make R&D progress, review processes, achieve outputs
3. Disseminate outputs, achieve interim outcomes
4. Commercialization, market acceptance, energy savings,
energy security, other outcome s and impacts
Information Provided by Evaluation Methods:
• Planning information
• Indicators of interim progress
• Analysis of collaborative and other relationships
• Creation and dissemination of knowledge outputs
• Energy savings, economic, environmental, energy security, option and
other benefits, and benefit-cost measures
• Spillover effects
• Comparative standing
• Overview – was it worth it?
[Goals, phases, and information provided by this method are highlighted]
A survey collects information by asking people questions—the answers to
which can be expressed in terms of statistics. This method is particularly
useful for characterizing a program’s progress, learning more detailed
information about that progress, assessing customer satisfaction, and
answering a variety of stakeholder questions.
Definition: Survey is a method of obtaining information directly from people about their ideas,
opinions, attitudes, beliefs, preferences, concerns, plans, experiences, observations, and virtually
any other issue. A survey collects information by asking people questions and recording their
responses. Surveys are often used when the desired data are not available through other sources,
but could be obtained by asking people. Surveys are used in R&D evaluation for a variety of
purposes, such as learning about a program’s progress and effects; discovering the opinions of
those participating in a program or using its outputs; addressing stakeholder questions; and
gathering information to supplement other sources of information.
How survey studies are organized, conducted, and analyzed: Given that surveys obtain
information from people, it is necessary to decide which people and how many people to ask; what
to ask; how to structure the questions; when and how often to ask; and how to submit the
questions—all aspects of survey design. Using samples reduces study costs, but if a sample is too
small, it may not adequately represent the population of people it is intended to represent. A
survey may be administered just once to a given group to obtain data as they exist at that time, in
66
Overview of Evaluation Methods for R&D Programs
which case it is “cross-sectional.” Alternatively, a survey may be administered to the same group
of people at different times to assess changes over time within the group, in which case it is
“longitudinal.” Alternatives for administering a survey include paper copies or computer disks,
electronic copies sent via e-mail or web-based, questions asked by an interviewer face-to-face or
by telephone. If a survey is administered in person or by phone, a decision must be made about
who will conduct it. Questions asked may be open-ended or may have forced choices. A balance
must be struck between collecting needed data and avoiding being overly intrusive or imposing
too much burden. Survey data are commonly analyzed using descriptive statistics, such as counts,
percentages, averages, ranges, and measures of central tendency and measures of variation.
Survey data may also be analyzed to show relationships, to compare groups, and to determine
trends and changes over time. Fortunately, there are many text books and references that provide
detailed guidance on all aspects of survey design and there are many experienced practitioners of
this method.
Limitations: Limitations—such as failure to adequately reflect the target population or biases in
the results—typically arise from weaknesses in survey design. To help eliminate these
weaknesses up front, detailed review of all aspects of a survey’s design, together with pilot
testing—i.e., administering the proposed survey to a small sample of people who are the same as
those who would be included in a full-scale survey—are advised. Still, low response rates may
limit the reliability of results and may require extra steps to increase responses. Costs can be an
issue, in that a survey not only imposes costs on the sponsor of the survey, but also on those
surveyed. This potential burden is recognized in Federal government by the Federal Paperwork
Reduction Act which limits the ability of a Federal program to administer surveys to 10 or more
people without prior OMB approval, which can be a lengthy procedure. It is also worth noting
that the survey method is a means of obtaining, analyzing, and releasing aggregate responses;
individual responses are understood to be treated as confidential without the explicit agreement of
the respondent to the contrary.
Uses:
To describe a program statistically.
To assess customer satisfaction.
To answer stakeholder questions about a program and its effects.
To support evaluation studies.
To provide information to help program managers make decisions to design or revise their
program, re-direct existing R&D funds, or allocate new funds.
Examples: Survey is a mainstay of evaluation for many Federal programs, as well as many other
organizations, and potential examples abound. Four examples of how organizations use the
survey method follow. The first illustrates descriptive program data. The second illustrates
customer or user satisfaction data. The third and fourth examples both illustrate the use of survey
to provide evidence that a Federal R&D program caused observed impacts and did not merely
67

Overview of Evaluation Methods for R&D Programs
substitute taxpayer money for private sector funding, but with an essential difference in the two
examples: One uses counterfactual questions to find out what participants would have done if
they had not received program funding. The other uses a comparison group to find out what
actually happened to those that did not receive program funding. The latter example is considered
to provide stronger evidence of impact than the former.
Example 1: Using survey for statistical description of a program’s knowledge outputs
The National Academy of Sciences has recently used survey extensively in its congressionally
mandated assessment of the SBIR program at five agencies. In support of the study, cross-
sectional surveys were conducted for a sample of projects funded by Phase I and Phase II grants
and of grant recipients. (A series of agency reports that include survey results is forthcoming from
NAS press.
31
) Table 2-7 shows, for illustrative purposes only, preliminary descriptive survey
results for just one of the many questions included in the survey, and for just one of the agencies
for which survey data were obtained.
32
Table 2-7. Survey Results on Intellectual Property Generated by a Sample of 151 Phase II SBIR-Funded
R&D Projects: Sample Averages
Type Average Number Applied
for/Submitted
Average Number
Received/Published
Patents 1.05 0.67
Copyrights 0.32 0.28
Trademarks 0.28 0.22
Scientific Publications 1.76 1.66
These descriptive survey statistics indicate that scientific and technical knowledge was generated
by the sample of SBIR projects, and they show various forms in which the knowledge was
disseminated. Average knowledge outputs per project may be useful for making comparisons
against those of other, similar R&D programs.
Example 2: Using survey to find out what customers/users want
The second illustration, shown in Table 2-8, is from a user satisfaction survey conducted annually
by the DOE National Energy Research Scientific Computer Center (NERSC). The survey aims to
“provide feedback about every aspect of NERSC's operation, help us judge the quality of our
services, give DOE information on how well NERSC is doing, and point us to areas we can
improve.” A 7.00 point rating scale was used to assess user satisfaction. The average satisfaction
scores from the 2003 survey ranged from a high of 6.61 (very satisfied) to a low of 4.67
(somewhat satisfied). The upper part of the table shows areas of highest user satisfaction and the
lower part, areas of lowest user satisfaction.
31
See, for example, Committee on Capitalizing on Science, Technology, and Innovation: An Assessment of the Small
Business Innovation Research Program, Project Methodology.
32
The data are preliminary and used only to illustrate the survey method; further identification of the source is not
provided pending publication by NAS of study results.
68

Overview of Evaluation Methods for R&D Programs
Table 2-8. NERSC User Survey, 2003, Illustrative Results
Areas with the highest user satisfaction:
Topic Avg Score No. of Responses
HPSS reliability
6.61 126
Consulting - timely response
6.55 207
Consulting - technical advice
6.54 200
HPSS uptime
6.54 126
Local Area Network
6.54 114
Areas with the lowest user satisfaction:
Topic Avg Score No. of Responses
Access Grid classes
4.67 27
Escher visualization software
4.75 8
Visualization services
4.81 97
NERSC training classes
4.88 24
Training
5.04 94
According to the survey report, the results trigger changes at NERSC that are intended to improve
performance and raise user satisfaction. Yearly changes are tracked.
Example 3: Using survey supported by counterfactual questions to provide evidence that a
government program has impact
One survey design approach sometimes used to provide evidence of program impact is a non-
experimental design with counterfactual questions to learn from participants what they think
would have happened had the government program not existed. Counterfactual questions
typically entail asking survey respondents several hypothetical questions: Would they have
proceeded with their research project had they not received government funding for it? If they
would have proceeded without government funding, would the project have been different? Table
2-9 shows responses to these questions for the first 50 completed projects funded by the Advanced
Technology Program (ATP). The results were used as one line of evidence of program impact.
69

Overview of Evaluation Methods for R&D Programs
Table 2-9. Survey Responses to the Counterfactual Question, “What would have happened without the
ATP award?”
Alternatives
Percent Reporting
the Effect (%)
Without the ATP funding:
- We would not have proceeded with the project 59%
Without the ATP funding we would have proceeded but with a delay:
41%
- 6 months 2
- 18 months 9
- 21 months 7
- 24 months 11
- 5 years or more 9
- unspecified 2
Source: ATP, Status Report No. 2, 2001.
Example 4: Using survey supported by a comparison group to provide evidence that a
government program has impact
A later ATP survey used a quasi-experimental design with a comparison group. This approach
was used to test if non-winners (of ATP R&D funding) continued with their proposed research
projects, and, if so, what was changed from the plan submitted to ATP. In other words, rather than
ask winners the counterfactual question, “what would they have done if they had not won,” this
approach asked a group of applicants who did not win what they actually did. Table 2-10 shows
the extent to which the non-winners said they actually pursued the proposed R&D. The question
was asked a year after they failed to receive the award while the experience was still relatively
fresh and could more likely be recalled by respondents.
Table 2-10. Survey Responses Indicating What Companies Who Did Not
Receive Federal Funding Actually Did Regarding the Proposed Project
Did not proceed with the project, at any scale 62%
Began project on a much smaller scale than that proposed 17%
Began project on a somewhat smaller scale than proposed 12%
Began project at about the same scale as proposed 5%
Began project on a somewhat larger scale than proposed 3%
Began project on a much larger scale than proposed 1%
Number of Cases 168
While both survey studies sought essentially the same kind of information about the role played by
program funding, the second approach, which included a comparison group, is considered more
rigorous than the approach that relied on counterfactual questions. ATP program management
used the results of the comparison group study to inform an NAS assessment of the program and
to provide stronger evidence for PART of the program’s impact.
70

Overview of Evaluation Methods for R&D Programs
References
Advanced Technology Program, Performance of 50 Completed ATP Projects, Status Report –
Number 2, NIST S) 950-2 (Gaithersburg, MD, National Institute of Standards and Technology,
2001).
Feldman and Kelley, “Leveraging Research and Development: The Impact of the Advanced
Technology Program,” in the National Research Council report, The Advanced Technology
Program: Assessing Outcomes, (Washington, DC: National Academy Press, 2001).
Fowler, F.J., Survey Research Methods, 3rd Edition (Newbury Park: Sage Publications, 2001.)
National Research Council, Committee on Capitalizing on Science, Technology, and Innovation:
An Assessment of the Small Business Innovation Research Program, Project Methodology
(Washington, DC: The National Academies Press, 2004.) Other reports on The Small Business
Innovation Research Program that include survey results are expected to be forthcoming in 2006.
U.S. Department of Energy, National Energy Research Scientific Computer Center (NERSC), FY
2003 Survey Results, available on-line at www.nersc.gov/news/survey/2003/.
71

Overview of Evaluation Methods for R&D Programs
2.9 Benchmarking Method
Program Manager Goals:
• Improve Program
• Communicate why the program is worth doing
Four Phases of Program Performance Cycle:
1. Design/revise, plan, select, budget
2. Make R&D progress, review processes, achieve outputs
3. Disseminate outputs, achieve interim outcomes
4. Commercialization, market acceptance, energy savings,
energy security, other outcome s and impacts
Information Provided by Evaluation Methods:
• Planning information
• Indicators of interim progress
• Analysis of collaborative and other relationships
• Creation and dissemination of knowledge outputs
• Energy savings, economic, environmental, energy security, option and other
benefits, and benefit-cost measures
• Spillover effects
• Comparative standing
• Overview – was it worth it?
[Goals, phases, and information provided by this method are highlighted]
Benchmarking means making comparisons to see how people, programs,
organizations, regions, or countries compare in terms of some aspect of their
performance—to identify where and how to make improvements.
Definition: Benchmarking is the systematic comparison of practice, status, quality or other
characteristics of programs, institutions, regions, countries, or other entities using a selected set of
performance measures. It serves to compare the performance of R&D labs with counterpart labs
in selected fields and sub-fields, across sectors and across national borders. Organizations use
benchmarking to measure and compare various aspects of their practices, such as costs,
productivity, resource allocation, staffing levels, skill sets, R&D management practices, R&D
leadership, and evaluation practices against those of other organizations and against established
standards.
How benchmarking studies are organized, conducted, and analyzed:
Benchmarking requires deciding what entities are to be compared, what aspects of those entities
are to be compared, and how the comparison will be made. Variation among Federal R&D
programs and among agencies means that an agency that wishes to use benchmarking will need to
tailor its approach. For some limited comparisons, one or more performance indicators may be
used, such as budgets to compare the size of R&D programs. For broader comparisons, such as
72

Overview of Evaluation Methods for R&D Programs
research leadership, quantitative performance indicators alone may be inadequate and the
judgment of experts may be needed.
33
Limitations: Determining how programs, agencies, or countries compare in R&D typically
involves a great deal of data, as well as judgment. If benchmarking is performed on broader topics,
such as scientific leadership, but based on limited quantitative indicators, such as papers cited,
problems may arise because the indicators are inadequate to measure performance at the level
desired. Benchmarking provides a time-dependent snapshot of performance of an R&D area; at
the same time, changes are likely to occur too slowly to detect by frequent (annual) benchmarking.
Uses:
To determine how a program’s/agency’s/region’s/country’s performance compares with that of
others.
To determine the leadership status of a program/agency/region/country in one or more fields or
sub-fields of science.
To identify best practices used by others in order to improve one’s own performance.
To provide information that may help guide administrators, policy makers, and funding agencies
to make Federal research decisions.
Example:
The example illustrates benchmarking in the first three uses listed above. It is for a
landmark study conducted by the National Academies Committee on Science, Engineering and
Public Policy (COSEPUP) to test the benchmarking method for comparing U.S. leadership with
the rest of the world in selected research fields. (For an example of a much more modest
benchmarking effort—comparing evaluation methods among programs, see Table 1-1 in Part 1 of
this booklet and accompanying reference.)
To conduct the study, the committee first established an oversight group including people with
broad backgrounds who selected three fields for the R&D benchmarking experiment:
mathematics, immunology, and materials science and engineering. The oversight group also
preliminarily defined sub-fields and selected expert panels in each field. Panel members included
U.S. experts in the research field, experts in related fields of research, non-U.S. experts in the field
and related fields, users of research results, and, for each panel, an expert in policy analysis. Each
panel was asked to answer the following three main questions: 1. What is the position of U.S.
research in the field relative to that in other regions or countries? 2. On the basis of current
trends in the U.S. and world-wide, what will be the relative position of the U.S. in the near and
longer-term future? 3. What are the key factors influencing relative U.S. performance in the field?
The panels of experts revisited the sub-fields and were free to modify them. They divided sub-
fields into sub-sub-fields, e.g., the field of immunology was divided into four major sub-fields,
33
In the context of the Government Performance and Results Act (GPRA), the National Academy of Sciences
Committee on Science Engineering, and Public Policy (COSEPUP) recommended that agencies whose missions
include the goal of world leadership in a scientific field consider using international benchmarking with expert panels
to judge research quality, relevance, and leadership status.
73

Overview of Evaluation Methods for R&D Programs
and each of the sub-fields into four-to-10 sub-sub-fields. The panels used a variety of methods to
assess each sub-field, including the following: The virtual congress method, citation analysis,
journal-publication analysis, quantitative data analysis, prize analysis, and international congress
speakers.
The virtual congress method had the panel identify the “best of the best” researchers in the world
in each sub-field, and then asked these researchers to imagine themselves as organizers of a
session in their field and to furnish a list of desired speakers. Citation analysis compared each
country’s citation rate for a field to the worldwide citation rate for that field. Journal publication
analysis had the panel identify leading journals in the field, scan their table of contents, and
perform a quantitative comparison of publications by U.S. and non-U.S. researchers. Quantitative
data analysis had the panels attempt to locate unbiased information for comparing major features
of the scientific enterprise—reportedly a problematic effort. The prize analysis method had the
panel identify the key international prizes in its field and analyze the numbers of U.S. and non-U.S.
recipients of these prizes in terms of their current residence status. The international congress
speakers method had the panel analyze actual representation at topical international conferences
by U.S. and non-U.S. speakers. Reportedly, they were able to determine which measures worked
best for comparison for each field.
Each panel issued a report benchmarking its field. Each panel identified sub-fields in which the
U.S. lagged the world leaders, but concluded that the U.S. was at least among the world leaders in
each of the broader fields.
As summarized in Tables 2-11 and 2-12, the panels identified institutional and human-resource
factors critical to maintaining leadership status in a field. Panel members also concluded that the
benchmarking approach was “rapid and inexpensive compared with evaluation procedures that
rely solely on the assembly of a huge volume of quantitative information.”
34
Table 2-11. Factors Influencing U.S. Leadership Performance
Factors considered most important Fields in which the factors were deemed most important
Mathematics Materials Immunology
Human resources and graduate
education
X X X
Funding X X X
Innovation process and industry X X
Infrastructure X X
34
National Academy of Sciences, 2000. .
74

Overview of Evaluation Methods for R&D Programs
Table 2-12. Factors Expected to Influence the Future Position of U.S. in Research
Factors expected to be most important Fields in which the factors are expected to be most
important
Mathematics Materials Immunology
Intellectual quality of researchers and
ability to attract talented researchers
X X X
Ability to strengthen interdisciplinary
research
X X
Maintenance of strong research-based
graduate education
X X X
Cooperation among government,
industrial, and academic sectors
X
References
Diana Hicks, Peter Kroll, Francis Narin, Patrick Thomas, Rosalie Ruegg, Hiroyuki Tomizawa,
Yoshiko Saitoh, and Shinichi Kobayashi, Quantitative Methods of Research Evaluation Used by
the U.S. Federal Government, NISTEP Study Material, No. 86, May 2002, available on-line at
www.nistep.go.jp/achiev/ftx/eng/mat086e/idx0863.html.
National Academy of Sciences, Committee on Science, Engineering, and Public Policy
(COSEPUP), Experiments in International Benchmarking of US Research Fields (Washington,
DC: National Academy Press, 2000), available on-line at www.nap.edu/books/0309068983/html.
U.S. House of Representatives, Science Subcommittee on Basic Research, “What Can It Tell Us?”
Hearing Report, October 4, 2000.
75

Overview of Evaluation Methods for R&D Programs
2.10 Technology Commercialization Tracking Method
Program Manager Goals:
• Improve Program
• Communicate why the program is worth doing
Four Phases of Program Performance Cycle:
1. Design/revise, plan, select, budget
2. Make R&D progress, review processes, achieve outputs
3. Disseminate outputs, achieve interim outcomes
4. Commercialization, market acceptance, energy savings,
energy security, other outcome s and impacts
Information Provided by Evaluation Methods:
• Planning information
• Indicators of interim progress
• Analysis of collaborative and other relationships
• Creation and dissemination of knowledge outputs
• Energy savings, economic, environmental, energy security, option and
other benefits, and benefit-cost measures
• Spillover effects
• Comparative standing
• Overview – was it worth it?
[Goals, phases, and information provided by this method are highlighted]
Technology commercialization tracking involves monitoring technologies
considered to be commercially successful and their associated energy savings,
economic and environmental benefits. Market and cost data is used to estimate
the cumulative net benefits of the program.
Definition: The technology commercialization tracking method tracks the new, energy-efficiency
technologies developed through R&D projects sponsored by the program and that may include
research cost-shared with industry. It classifies those technologies showing a requisite level of
development, such as either “emerging,” “commercially successful,” or “mature.” For example, a
technology could be considered emerging when it is thought to be within approximately one-to-
three years of commercialization. It could be considered commercially successful when full-scale
commercial units of a technology have been made operational in private industry and are available
for sale. It could be considered mature once a commercially successful technology has been in
operation for 10 years or longer. It is considered a historical technology when it is no longer being
sold in the U.S. When a technology is emerging, preliminary information is collected. When a
technology is commercially successful, it is placed on the active tracking list and additional data
are collected, which are used to analyze benefits from program-sponsored R&D. Mature and
historical technologies do not need to be tracked.
How technology commercialization tracking studies are organized, conducted, and analyzed:
To determine the impacts of research and other activities, a program might not only track
76
Overview of Evaluation Methods for R&D Programs
commercial progress associated with completed R&D activities but also periodically review and
analyze benefits from its technology deployment efforts. Technology commercialization and
technology deployment impact information could be combined to provide more complete
documentation of the program’s impacts. A program contacts vendors and users of sponsored
technologies that have been commercialized to collect technical and market data on each
commercially successful technology including details on the following: number of units sold,
installed, and operating in the United States (including size and location); units decommissioned
since the previous year; energy saved; environmental benefits; improvements in quality and
productivity; any other impacts such as employment and effects on health and safety; and
marketing issues and barriers. This information is used to estimate the number of units that have
penetrated the market, conduct engineering analyses to estimate energy savings from the new
technologies, and estimate air pollution and carbon emission reductions. The associated reduction
of air pollutants is based on the type of fuel saved and the pollutants typically associated with
combustion of that fuel using assumed average emission factors. Data collected to estimate
commercialization impacts, when also combined with results from a separate impact evaluation of
program deployment efforts, provide the total energy and cost savings attributed to the program’s
efforts. The cumulative energy cost savings minus the cumulative program costs and industry
implementation costs provide an estimate of the direct net economic benefit of the program.
Limitations: Several factors make the tracking task challenging. Personnel turnover at
developing organizations as well as at user companies makes it difficult to identify commercial
applications. Small companies that develop a successful technology may be bought by larger
firms or may assign the technology rights to a third party. As time goes on, the technologies may
be incorporated into new products, applied in new industries, or even replaced by newer
technologies that are derivative of the developed technology. Because the trail may be lost and
some program-sponsored technologies that reach market may not be identified, documented
program benefits may be thought to be conservative estimates. Furthermore, estimates of program
benefits do not include either derivative effects resulting from other new technologies that spin off
of program-sponsored technologies, or the secondary benefits of the energy and cost savings
accrued in the basic manufacturing industries downstream of the new technologies. Therefore,
actual benefits could be higher than the numbers reported. One challenge in properly applying a
technology commercial tracking method has to do with separating the effects of successful R&D
from the technology deployment effects. Good R&D programs include both R&D and
deployment aspects. It will be necessary to separate the R&D commercialization and the
deployment effects to avoid double counting when estimating the cumulative net benefits of the
program.
Uses:
To identify which projects funded by the program were commercialized and to what extent.
To provide documented evidence of the impact of program-sponsored technology development
and deployment efforts.
To estimate the cumulative net benefits of the program.
77

Overview of Evaluation Methods for R&D Programs
Examples: Pacific Northwest National Laboratory (PNNL) has tracked and classified
commercialized energy-efficiency technologies for DOE’s Industrial Technologies Program (ITP).
The ITP has tracked progress of their sponsored technologies for more than 20 years. The first
example illustrates the first two uses of the method by showing the tracking of two individual
technologies funded by the ITP. The second example illustrates the third use by showing the
calculation of cumulative net benefits of the ITP as of 2004.
Example 1: Tracking information for two ITP-sponsored technologies
Two samples of project tracking information are contained in the two figures shown below, which
are taken from the current version of the tracking document available on the ITP web site. The
first, Figure 2-15, shows tracking information for improved composite tubes for Kraft recovery
boilers. The second, Figure 2-16, shows tracking information for a steel reheating furnace
improved with a new Oxy-Fuel Burner.
Example 2: Calculating net benefits of the ITP
Figure 2-17 shows cumulative net benefits of the ITP estimated as cumulative cost savings minus
cumulative program and industry implementation costs from 1976 through 2004. This measure
takes into account the cumulative energy savings associated with successfully commercialized
ITP-sponsored technology research, including the two projects illustrated in Figures 2-15 and 2-16,
along with savings associated with ITP’s Technology Delivery Subprogram during the period
covered. The costs of industrial energy saved are the average fuel price that would have been paid
to purchase energy multiplied by annual savings. The nominal prices (in dollars per million Btu)
for various fuels are reported in the Energy Information Administration’s Annual Energy Review;
and these prices are appropriately adjusted by applying the BLS producer price index for Number
2 fuel oil, natural gas, coal, and electricity, normalized to a base year (in this example, the base
year is 2000). To obtain the savings in dollars, the prices are multiplied by the respective
quantities of each type of industrial fuel saved by ITP-funded technologies that have been
commercialized and tracked.
The program costs of the ITP include the cumulative Federal funding spent on the program and
the costs of industry of implementing the technologies. Program funds are R&D dollars spent by
ITP each year since the program began, adjusted for inflation. As of FY2004, the cumulative ITP
spending since 1976 more than $2 billion. Because reliable information about the costs of
industry installing the new technologies is not available, an assumption was made to account for
these costs: Industry is assumed to require a two-year payback period on investments. To account
for implementation costs, the first two years of the cumulated energy savings for each technology
are ignored because these saving are needed to “recoup” the capital costs of adopting the new
technology.
78
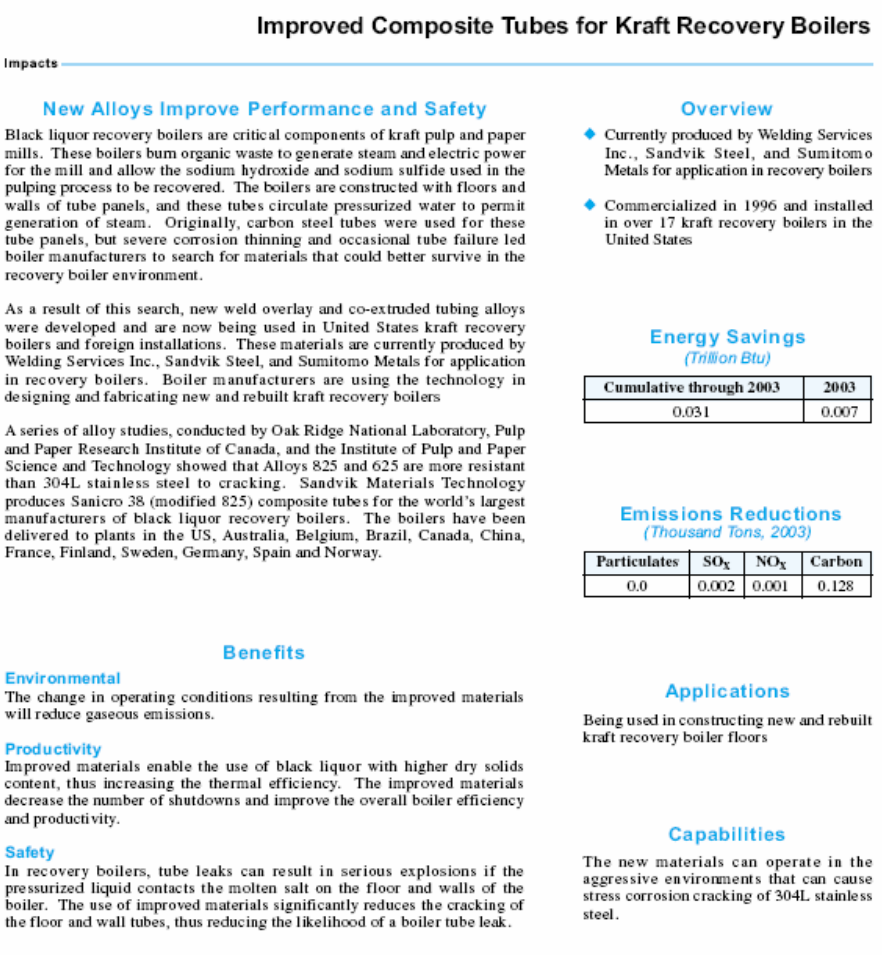
Overview of Evaluation Methods for R&D Programs
Figure 2-15. Tracking Information for Composite Tubes for Kraft Recovery Boilers
79

Overview of Evaluation Methods for R&D Programs
Figure 2-16. Tracking Information for a Steel Reheating using Oxy-Fuel Burners
80
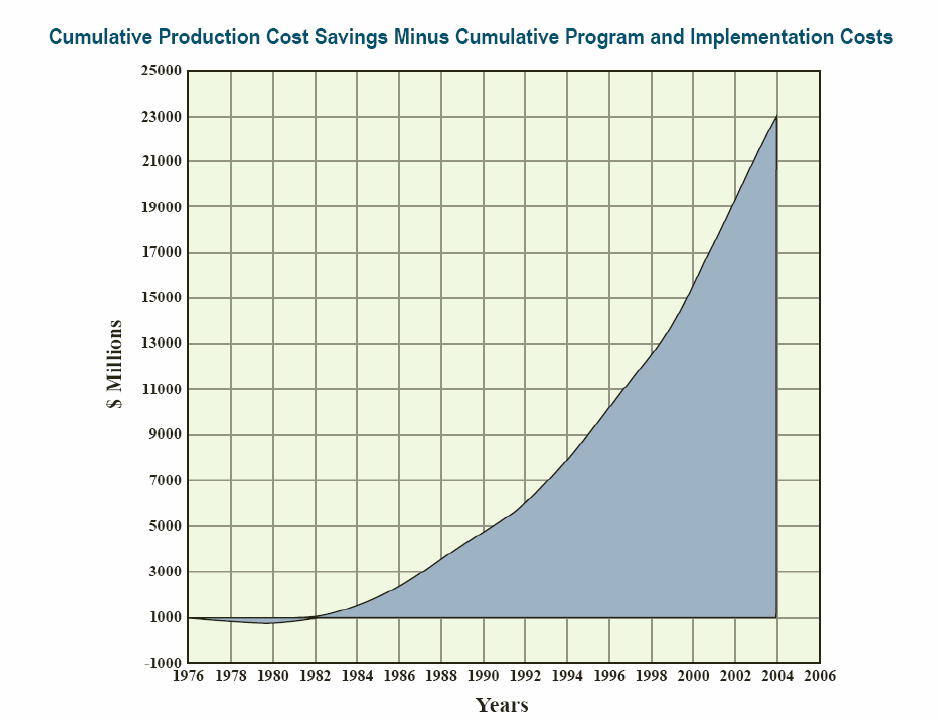
Overview of Evaluation Methods for R&D Programs
The sum of all energy saved times the average energy price yields an estimate of the annual
savings for all technologies in a particular year. The net economic benefits equal the
accumulation of these energy cost savings over time minus the ITP program costs (appropriations)
and the assumed cost of installing the technologies (which is equal to the first two years of
savings). Yearly net benefits are then adjusted for inflation using the annual implicit price deflator
for GDP, as published by the Bureau of Economic Analysis of the U.S. Department of Commerce,
but renormalized to the current year so that all savings are reported in 2004 dollars.
As of 2004, the cumulative value for energy savings of all commercial and historical ITP
technologies (both from program R&D and technology delivery efforts) was 4.7 quads, from 1977
thru. 2004. Cumulative net economic benefits associated with the Program is equal to $23 Billion
(1977 to 2004), as shown in Figure 2-17.
Figure 2-17. Cumulative Net Economic Benefits, 1976-2004
Source: U.S. Department of Energy, Industrial Technologies Program,, “Impacts: Industrial Technologies
Program --Summary of Program Results for CY 2004,” February 2006
Note: This figure includes net total value of energy saved by technology developed in ITP research programs plus the
energy cost savings from ITP’s deployment programs—Industrial Assessment Centers and the Best Practices Program,
minus the cost to industry of using the technologies and minus ITP Program costs.
81

Overview of Evaluation Methods for R&D Programs
Reference
U.S. Department of Energy, Industrial Technologies Program,, “Impacts: Industrial Technologies
Program --Summary of Program Results for CY 2004,” February 2006
U.S. Department of Energy, Industrial Technologies Program, Appendix 6: “Methodology for
Technology Tracking and Assessment of Benefits,” available online at
www.eere.energy.gov/industry/about/pdfs/impacts_appendix6.pdf, and current ITP tracking
documents, downloadable from http://www.eere.energy.gov/industry/about/brochures.html.
82

Overview of Evaluation Methods for R&D Programs
2.11 Benefit-Cost Case Study
Program Manager Goals:
• Improve Program
• Communicate why the program is worth doing
Four Phases of Program Performance Cycle:
1. Design/revise, plan, select, budget
2. Make R&D progress, review processes, achieve outputs
3. Disseminate outputs, achieve interim outcomes
4. Commercialization, market acceptance, energy savings,
energy security, other outcome s and impacts
Information Provided by Evaluation Methods:
• Planning information
• Indicators of interim progress
• Analysis of collaborative and other relationships
• Creation and dissemination of knowledge outputs
• Energy savings, economic, environmental, energy security, option and
other benefits, and benefit-cost measures
• Spillover effects
• Comparative standing
• Overview – was it worth it?
[Goals, phases, and information provided by this method are highlighted]
Benefit-cost case studies quantify positive and negative effects of a project, a
cluster of projects, or a program, and compare benefits against the costs using any
of several measures. An essential feature of this method is accounting for
“additionality,” i.e., benefits and costs with the project, cluster of projects, or
program as compared with the benefits and costs without it. Benefit-cost analysis
has a long history of use in evaluating government projects. More recently, the
method has been extended to evaluate clusters of related projects within a given
technology portfolio. For retrospective assessment of EERE projects, the National
Research Council (NRC) developed a special benefit-cost matrix framework and
procedure. NRC is currently developing a counterpart matrix framework and
procedure for prospective assessment of EERE projects. This section first
summarizes basic principles of benefit-cost analysis, and then gives examples of
(1) a benefit-cost case study of a single project, (2) a benefit-cost case study of a
cluster of projects, and (3) an NRC retrospective benefit-cost analysis of an EERE
project using the matrix framework.
Definition: The benefit-cost case study method begins with a descriptive treatment of the project,
cluster of projects, or program, and adds to it quantification of economic and other benefits and
costs to the extent possible. Effects that cannot be quantified are described qualitatively. This
method is most often used to evaluate applied research and technology programs with well defined
goals that lend themselves to at least partial economic interpretation and analysis, though assessed
83

Overview of Evaluation Methods for R&D Programs
benefits and costs often extend beyond economic effects. In contrast, the method is generally not
used to evaluate basic research programs with pure knowledge goals. A strength of this method is
that, when well executed, it provides a detailed, documented accounting of the benefits and costs
of a government investment, and expresses the results at least partially in financial terms that
allow broad comparisons with the return on other investments. The results of a well-done benefit-
cost case study can be replicated, offering strong evidence of impact.
How benefit-cost case studies are organized, conducted, and analyzed: Once an in-depth
understanding of the subject is developed, the analyst develops an estimation model and gathers
data needed to estimate benefits and costs attributable to the project, cluster of projects, or
program in question. Attributed beneficial effects are often modeled as acceleration in the onset of
benefits as compared with their timing without the project or program, and/or as an increase in the
benefits stream. The analysis takes into account the approximate time of occurrence of effects.
All dollar amounts are discounted to a common time basis so they can be combined. Effects not
expressed in monetary terms are included in the benefit-cost analysis either qualitatively or
quantitatively. Typical economic measures that are used to express overall monetary effects are
net present value, annual value, benefit-cost ratio, and internal rate of return or, better, the adjusted
internal rate of return.
35
Environmental effects are often expressed in terms of reductions in
pollutants. Safety effects may be expressed in terms of life-years saved; the value of avoidance of
various illnesses may be expressed using a technique called quality-adjusted life years. When
used to evaluate a Federal R&D program, the focus is on social benefits and costs, which includes
all program effects identified nationwide. The NRC matrix approach has a prescribed format and
procedure, but it essentially follows these same basis principles.
Limitations: Because benefit-cost case studies are typically quite detailed and carefully
developed and documented, they often require a relatively large resource and time commitment,
limiting the number that most programs can afford to develop and also limiting them to uses that
are not time pressured. A case study of a single project may not provide information about a
sufficiently large part of a program or portfolio to serve as compelling evidence about the overall
performance of the program or portfolio. However, this limitation may be overcome either by
performing a sufficient number of individual case studies, such that their total benefits may be
shown to exceed total program or portfolio costs, thereby demonstrating positive net benefits for
the overall program or portfolio, or by achieving the same goal by performing one or several
cluster studies.
Uses:
To demonstrate the economic effectiveness of a given R&D investment (retrospective
analysis).
To guide R&D investment decisions (prospective analysis).
To provide information to help program managers make decisions to design or revise their
program, re-direct existing R&D funds, or allocate new funds.
35
For guidance on using these measures of economic performance, see Rosalie T. Ruegg, “Economic Methods,” CRC
Handbook of Energy Efficiency, ed. Kreith and West, pp. 101-124.
84

Overview of Evaluation Methods for R&D Programs
Examples: Three examples are given. The first example shows how benefit-cost case study was
used to estimate the economic benefits and costs of a government-laboratory project which
developed cybernetic building systems. The second example shows a cluster study for a set of
projects in composite manufacturing technologies to get at benefits and costs of a portfolio of
projects within a given technology area. The third example shows the use of the NRC matrix to
assess past EERE energy efficiency programs within a benefit-cost framework. All of the cases
take into account “additionality,” i.e., the difference in benefits and costs attributed to the
government. All of them use the techniques of discounted cash flow analysis to treat economic
effects. The NRC matrix example calls out environmental and energy security effects, in addition
to economic effects.
36
Example 1: Benefit-cost case study of a government-laboratory project which developed
cybernetic building systems
This economic case study evaluates potential economic impacts of past, ongoing, and planned
research of the Building and Fire Research Laboratory (BFRL) at the National Institute of
Standards and Technology (NIST) aimed at developing and deploying cybernetic building systems
(CBSs) in office buildings. CBS is “a multi-system configuration that is able to communicate
information and control functions simultaneously and seamlessly at multiple levels.” The CBSs
addressed by the study include building systems for energy management, fire and security, fault
detection and diagnostics, real-time purchasing of electricity, and the aggregation of building stock
for multi-facility operations. Table 2-13 shows the NIST laboratory investment in CBS.
The study describes the key components of the laboratory’s research on CBS. It discusses the
scope and size of the market for CBS products and services. It presents a strategy for identifying,
collecting, and measuring benefits and costs from CBS use in office buildings. The economic
impact assessment was carried out in two stages: First, a baseline analysis was performed with all
input variables used to calculate the economic measures set at the values assumed most likely.
Second, nine input variables were varied to conduct Monte Carlo simulations to assess how
changing the value of the variables affected the calculated values of the economic measures.
Study results put the cost savings from using CBS products and services at more than $1.1 billion
(1997 dollars) to owners, managers, and occupants of office buildings across the nation, based on
a study period extending from 1991 (to include the laboratory’s earlier investments in CBS
research) through 2015. The study examined BFRL’s role as a developer of CBS enabling
technologies and as a facilitator in their deployment. It estimated that without BFRL’s
participation, the commercial introduction of CBS products and services would have been delayed
to 2010, but with BFRL’s participation, they would become commercially available in 2003. Thus
the market penetration curve is shifted forward by NIST participation. The estimated value of not
having to forego cost savings predicted to accrue during the period 2003 to 2010 was taken as the
return on BFRL’s program in CBS. The estimated cost savings attributed to the laboratory’s CBS
research program is $90.7 million, resulting from its investment cost of approximately $11.5
million. Table 2-14 summarizes calculated savings, costs, and other results.
Table 2-13. BFRL Investment Costs in CBS by FY 1991-2004
36
Effects other than economic are also often included in other benefit-cost studies. The point is that the NRC matrix
calls out these other categories of benefits for systematic treatment.
85

Overview of Evaluation Methods for R&D Programs
Source: Chapman, 1999.
Example 2: A cluster study to assess benefits and costs of a portfolio of projects in composite
manufacturing technologies
A cluster study is a grouping of benefit-cost case studies performed for a selection of projects
drawn from a portfolio of projects centered in a common technology with a common broad goal.
A cluster study allows conclusions to be drawn about the cluster and about the portfolio from
which the cluster is drawn. The objective is to combine the methodological advantages of detailed
case study and higher-level portfolio overview. Cluster studies help programs avoid the charge of
“cherry picking” because even though stronger projects may be selected for analysis, they must
bear total cluster costs and, generally, total portfolio costs; other projects in the portfolio are
implicitly assigned zero benefits. Multiple cluster studies may be needed to provide
comprehensive coverage of a portfolio consisting of projects with different technologies and goals.
Using a common set of measures for multiple cluster studies allows them to be rolled up at the
portfolio level.
86

Overview of Evaluation Methods for R&D Programs
Table 2-14. Calculation of Savings, Costs, and Additional Measures
Savings and Costs 1997 Dollars
($ amounts in millions)
Present Value Cost Savings Nationwide:
Sum from 1991 to 2015 of present value of cost savings nationwide by
year
Cost Savings Nationwide:
= $1,175.6 million
$1,175.6
Present value Savings (PVS) Attributable to BRFL:
Sum from 1991 to 2009 of present value of cost savings nationwide by
year
Savings Attributable to
BFRL:
= $90.7 million
PVS $90.7
Present Value Investment Costs (PV Costs) to BFRL:
Sum from 1991 to 2015 of present value of investment cost to BFRL by
year
PV Costs $11.475
= $11.475
PVNS $79.3
Present Value Net Savings (PVNS) Attributable to BFRL:
Difference between present value savings (PVS) attributable to BFRL
and present value of investment costs (PV Costs) to BFRL
= $90.7 - $11.475 = $79.3 million
SIR
AIRR
7.9
16.2%
Additional Measures
SIR of BFRL Contribution:
Savings-to-Investment Ratio on BFRL investment
= $90.7 / $11.475 = 7.9
AIRR of BFRL Contribution:
Adjusted Internal Rate of Return on BFRL investment
= (1 – 0.07) * 7.9
1/25
– 1 = 0.162
Source: Chapman, 1999.
Figure 2-18 diagrams a cluster study for a portfolio of composite manufacturing technologies—
one of four cluster studies funded by the ATP over the past 10 years. The portfolio of composites
manufacturing is composed of 22 projects. A cluster of five projects was selected for analysis.
Detailed quantitative benefits were estimated for two projects in the cluster as indicated by the
solid lines pointing to “combined cash flow estimates.” Possible future benefits from the other
three projects are described but not quantified, as indicated by the dashed lines pointing to
“combined cash flow estimates of public benefits.” The estimated public benefits of the cluster
study provide data for calculating performance metrics for the cluster of five projects, as indicated
87

Overview of Evaluation Methods for R&D Programs
by the downward pointing solid arrow. The larger box to the right represents ATP’s investment in
the portfolio of 22 composite manufacturing projects used in the calculation of portfolio
performance metrics, as indicated by the downward dashed arrow. The smaller box represents
ATP’s investment in the five cluster projects used in the calculation of cluster performance metrics,
as indicated by the downward pointing solid arrow.
ATP has used its cluster studies as evidence to stakeholders that the program is having economic
impact. It has used the results internally to assess and compare net benefits of investments in
different technologies and sectors of the economy.
Example 3: NRC Benefit-Cost Matrix for Retrospective Analysis of EERE Projects and Programs
Appropriations legislation for the U.S. Department of Energy’s energy R&D budget in FY 2000
directed a retrospective evaluation of benefits to the nation from DOE’s energy efficiency and
fossil energy research programs from 1978 to 2000. Conducted by the National Academies’
National Research Council (NRC), the study investigated whether the programs’ benefits justified
the past expenditure. Study findings were reported in Energy Research at DOE; Was it Worth it?
(NRC, 2001)
In the effort to take a comprehensive and consistent approach, the NRC appointed a Committee on
Retrospective Benefits to develop an evaluation framework using the matrix shown in Table 2-15
for summarizing the benefits of each discrete program with a definable technology objective and
outcome. An accompanying “cookbook” gave detailed instructions on how to calculate the
benefits in each cell of the matrix. The effect of the program was considered in comparison with
the situation without the program, but a default assumption was used that the program accelerated
outcomes by five years unless there was strong evidence that an alternative assumption should be
used.
The columns of Table 2-15 were used to reflect three levels of uncertainty about benefits and costs,
captured with the help of Table 2-16, which focused on two sources of uncertainty: technological
uncertainty and uncertainties about economic and policy conditions. The first column of Table 2-
15, “realized benefits and costs,” is for highly certain benefits and costs, i.e., it is assumed that the
technology is developed and the economic policy conditions are favorable for commercialization.
The second column, “options benefits and costs,” is for recording benefits and costs that are less
certain, because though the technologies are developed, the economic and policy conditions are
not yet favorable—though they might become favorable at a later time. The third column,
“knowledge benefits and costs,” is for all other combinations of technology development and
economic/policy conditions. The rows were used to reflect three types of benefits: economic
benefits to producers and consumers, environmental benefits such as reduced emissions, and
security benefits, such as reducing oil imports and improving the reliability of electricity supplies.
The Committee implemented the retrospective evaluation approach in 39 case studies—22 in
fossil energy program and 17 in energy efficiency. The retrospective study concluded that the
benefits of federal applied energy R&D overall had exceeded the costs over the period examined,
but that within the aggregate were “striking successes” and “expensive failures.” It acknowledged
that the retrospective study did not reveal the results of future investment decisions.
88

Overview of Evaluation Methods for R&D Programs
To illustrate, Table 2-17 shows the NRC benefits matrix for the Advanced Refrigerator-Freezer
Compressors Program, with economic benefits far exceeding costs in this case. Economic benefits
are estimated at $7 billion and DOE R&D costs at $1.6 million. Environmental benefits are
identified as substantial emissions reductions from reductions in energy consumption. Security
benefits are identified as improved electric systems reliability. However, neither environmental
nor security benefits are quantified.
The Retrospective Benefits Committee recommended that DOE implement the approach, using
consistent assumptions across programs, and that it adopt procedures to enhance the transparency
of the process.
37
EERE has adopted much of the framework proposed and staff has been working
to add to specificity to that framework.
37
In 2003, Congress asked the NRC to take a direct role in assessing prospective benefits of proposed future
investment in the same set of EERE applied energy R&D program.”(House Report, 2002, p. 125) The NRC
committee is adapting the matrix approach in combination with decisions tree support to assess prospective benefits..
89

Overview of Evaluation Methods for R&D Programs
Figure 2-18. Diagram of a Cluster Study
(Source: Pelsoci, 2004)
90

Overview of Evaluation Methods for R&D Programs
Table 2-15. NRC Benefit-Cost Framework
Retrospective Evaluation Matrix
Realized Benefits
and Costs
Options
Benefits and
Costs
Knowledge
Benefits and
Costs
Economic
Benefits and
Costs
Environmental
Benefits and
Costs
Security
Benefits and
Costs
Source: NRC Report, 2001.
Table 2-16. NRC “Tool” to be used with the Benefit-Cost Matrix
Accompanying Tool for “Loosely” Characterizing Uncertainty in
Retrospective Study
Technology
Development
Economic /
Policy Conditions
Technology
Developed
Technology
Development
in Progress
Technology
Development
Failed
Will be favorable for
commercialization
Realized
benefits
Knowledge
benefits
Knowledge
benefits
Might become favorable for
commercialization
Options
benefits
Knowledge
benefits
Knowledge
benefits
Will not become favorable for
commercialization
Knowledge
benefits
Knowledge
benefits
Knowledge
benefits
Source: NRC Report, 2001.
91

Overview of Evaluation Methods for R&D Programs
Table 2-17. NRC Estimated Benefits and Costs Matrix for the Advanced Refrigerator-Freezer Compressor
Program
Realized Benefits/Costs Options
Benefits/Costs
Knowledge Benefits/Costs
Economic
Benefits/costs
DOE R&D costs: $1.6
million
Substantial benefits:
Approx. $7 billion
Design modifications to
compressor
Facilitated efficiency
standards
Applications software
Minimal: technology
has been
commercialized and
deployed
R&D on system optimization
R&D helped develop and define
future refrigerator efficiency
R&D on energy saving
components and features
Research findings were applied
to air conditioners
Environmental
Benefits/Costs
Substantial emissions
reductions
Reductions in energy
consumption
Minimal: Technology
has been
commercialized and
deployed
Benefits could be large as
technology is disseminated
Security
Benefits/Costs
Improved electric system
reliability
Minimal benefits, since most
of the electric energy saved
displaced fossil, nuclear, or
hydro, and little oil was
displaced
Benefits are relatively
small because little oil
would be displaced
Successful technology transfer
to other nations could
substantially increase
worldwide energy efficiency and
reduce environmental
emissions
Source: NRC, Was It Worth It?, 2001, p. 98.
References
Robert E. Chapman, Benefits and Costs of Research: A Case Study of Cybernetic Building
Systems, NISTIR 6303 (Gaithersburg, MD: National Institute of Standards and Technology,
March 1999), available on-line at http://fire.nist.gov/bfrlpubs/build99/PDF/b99003.pdf.
National Research Council, Energy Research at DOE; Was It Worth It? Energy Efficiency and
Fossil Energy Research 1978 to 2000 (Washington, DC: National Academy Press, 2001)
Thomas M. Pelsoci, Composites Manufacturing Technologies: Applications in Automotive,
Petroleum, and Civil Infrastructure Industries, NIST GCR 04-863 (Gaithersburg, MD: National
Institute of Standards and Technology, June 2004).
Rosalie T. Ruegg, “Economic Methods,” CRC Handbook of Energy Efficiency, ed. Kreith and
West, (Boca Raton: CRC Press).
92

Overview of Evaluation Methods for R&D Programs
2.12 Econometric Methods
Program Manager Goals:
• Improve Program
• Communicate why the program is worth doing
Four Phases of Program Performance Cycle:
1. Design/revise, plan, select, budget
2. Make R&D progress, review processes, achieve outputs
3. Disseminate outputs, achieve interim outcomes
4. Commercialization, market acceptance, energy savings,
energy security, other outcome s and impacts
Information Provided by Evaluation Methods:
• Planning information
• Indicators of interim progress
• Analysis of collaborative and other relationships
• Creation and dissemination of knowledge outputs
• Energy savings, economic, environmental, energy security, option and
other benefits, and benefit-cost measures
• Spillover effects
• Comparative standing
• Overview – was it worth it?
[Goals, phases, and information provided by this method are highlighted]
Econometric methods encompass a number of mathematical and statistical
techniques that are used to increase the rigor of estimation of economic
relationships. Econometric methods are often used to estimate program
impacts.
Definition: “Econometric methods” use a variety of statistical and mathematical tools and
theoretical models to analyze and measure the strength of functional relationships that underpin a
program and to analyze and measure a program’s effects on firms, industries, innovation, and the
economy. Among the numerous models that have been developed, some have been refined for
repeated application, such as the two given here as examples. Because of the rigor offered by
econometric methods where there are good models and data, they are often favored when analysts
are attempting to show cause-and-effect relationships—a challenging task in evaluation.
How econometric studies are organized, conducted, and analyzed:
Econometric studies usually start with a hypothesized relationship to be tested or a cause-and-
effect question to be answered. Examples of evaluation questions that might be answered using
econometric methods are the following: Did Program X increase the formation of collaborative
research ventures? What was the effect of Federal R&D on private-firm R&D productivity?
What are the forecasted national income effects of an R&D program that increases energy
efficiency in buildings by 10%? An econometric study proceeds with construction or adoption of
a study design and theoretical modeling to guide the approach to be followed in testing the
93

Overview of Evaluation Methods for R&D Programs
hypothesized relationship or answering the research question with quantitative rigor. Because
econometric methods are highly quantitative, data compilation is an integral part of the model
building. Developing a workable model, fitting data to it, exercising the model, and interpreting
the results are steps that complete the study. Specialized models and software tools may facilitate
structuring analyses and performing computations.
Limitations: Econometric methods may be complex and difficult for the non-specialist to
understand and interpret, and, hence, difficult for the specialist to communicate to non-specialist
audiences. There may be important effects that can not be captured in a highly quantitative
approach. Considerable effort is typically needed to obtain and prepare the necessary data,
making these data intensive methods often costly and time consuming to implement. Moreover,
the ideal data for implementing a model may simply not be available, causing the analyst to use
proxy data which may produce less accurate results. Econometric methods are generally imperfect
and variable in how well they capture relationships between R&D investment and changing
economic, technological, and social phenomena.
Uses:
To measure the impact on an organization’s productivity of participating in government-
funded research.
To estimate prospective consumer surplus benefits from government-funded technologies
using a cost-index approach.
To estimate retrospective effects of a program-induced change.
To assess the effectiveness of a public policy.
To increase the return on a program’s investment by improving understanding of underlying
relationships and how they may be made more effective.
To predict an output quantity based on an input quantity.
To provide defensible evidence of a program’s impact.
Examples:
The tools of econometrics and statistical analysis are found in many economic studies,
including those that feature other methods. For example, the study by Feldman and Kelley, an
example given in Section 2.8, “Survey Method,” used control groups and statistical and
econometric methods to extract more information and greater rigor from survey results. Here we
provide two additional examples of econometric methods in the first and second uses listed above,
respectively. The first is an econometric analysis of the impacts on research productivity of firms
participating in government-funded research consortia. The second is an econometric analysis that
estimates consumer benefits from government-funded advances in digital data storage.
Example 1: Using a production function to measure the impact on research productivity of
participation in government-funded research consortia
94

Overview of Evaluation Methods for R&D Programs
A goal of the Advanced Technology Program (ATP) is to foster collaboration. One way this is
done is by offering larger funding amounts for projects proposed by research consortia than for
projects proposed by single firms. A research question of interest to the program and its
stakeholders, as well as to others concerned with the impacts of R&D consortia, is whether
participation in research consortia increases the research productivity of participating firms.
To test whether a statistical relationship between consortia participation and an increase in a firm’s
research output can be observed empirically, two economists, Mariko Sakakibara of the University
of California and Lee Branstetter of Columbia Business School, developed an econometric model
for this purpose. The model is a log-linear equation, derived from a knowledge production
function:
ρ
it
= β
o
+ β
1
r
it
+ β
2
C
it
+ Σ
d
δ
d
D
id
+ µ
it
where ρ
it =
natural log of the number of patents generated by firm i in year t; r
it
= the natural log of
firm-level R&D spending; C
it
= the intensity of participation in research consortia, measured as
the count of concurrent projects in which firm i was involved in year t; δ
d
= the coefficients on the
industry dummy variables (Ds); µ = an error term; and δ terms are industry-level differences in the
propensity to patent.
38
Patent data were used as the indicator of firm research productivity. The analysts used data on
Japanese funding of R&D consortia and Japanese firms initially to develop and test the model
because there is a longer history of Japanese funding of research consortia offering greater
availability of data needed to develop, test, and verify the model.
39
Then, in a follow-on effort, the
analysts used panel data (longitudinal data) for firms participating in ATP-funded consortia and
for a control group of U.S. non-participating firms to measure the impact on firms participating in
ATP-funded consortia.
The analysts took steps to rule out the possibility that the chain of causality might run from firms
with high research productivity seeking to participate in ATP research consortia, rather than in the
hypothesized direction, i.e., that participation in consortia leads to higher research productivity.
They obtained information on total R&D spending, sales, and capital investment of participating
and non-participating firms from Standard & Poor’s COMPUSTAT database. They obtained
information on the total patenting of firms from the REI Patent Database developed and
maintained at the Case Western Reserve University Center for the Study of Regional Economic
Issues.
Study findings were that “participation in ATP-funded research consortia led to verifiable and
measurable increases in research productivity of the participating firms.” Findings show a
positive association between the participation in research consortia and research productivity of
the participating firms at all levels of aggregation. The positive impact of participating in
consortia is found to be higher when the average technological proximity of participating firms is
high, i.e., when the similarity of patenting portfolios of participating firms is high. Findings
38
Sakakibara and Branstetter, 2002, p. 6.
39
Developing and testing the model using Japanese patent data allowed more time for ATP patent data to be
compiled.
95

Overview of Evaluation Methods for R&D Programs
provide less clear-cut evidence concerning which kinds of firms benefit most from participation in
research consortia.
Example 2: Using the cost index method for estimating prospective consumer benefits from
government-funded digital technologies
Two economists, David Austin and Molly Macauley, both with Resources for the Future,
developed a new econometric method, the “Cost Index Method,” for estimating potential returns
to consumers from new technologies.
40
The approach is to compare “observed price and
performance for an innovated product against hypothetical, best available price and performance
had the technical advance not occurred.”
41
That is, “the cost index indicates how much more
expensive an equivalent level of services would have been in the absence of the new
technology.”
42
Consumer benefits are estimated net of the baseline defined for the best available
substitute technology which is modeled dynamically, i.e., the substitute is predicted to improve
over time. Benefits to consumers are estimated gross (not net) of R&D costs. The method
provides a partial assessment of market spillovers,
43
but not knowledge spillovers, i.e.,
downstream benefits resulting from the use by others of the publications, patents, and other
knowledge disseminated from a project. The method can be applied at the planning stage to assess
the potential of proposed R&D investments before making an investment decision, or to project
potential benefits for use in evaluation, particularly when a program is too new to have realized
actual results.
At the heart of the Cost Index Method is the estimation of changes in quality-adjusted prices of a
new technology which permits estimating the relevant area under the demand curve for a new
technology without having to estimate the demand curve itself. The method treats innovation as
an intermediate good, and treats the services it provides as the final good. It treats demand for the
innovation as derived from the demand for final goods. According to the researchers, under
competitive conditions in the downstream markets, the cost index will correctly estimate the gain
to consumers, and, if downstream markets are not competitive, the cost index will yield a lower
bound estimate of consumer gain. Figure 2-19 shows schematically the relationships among key
model components.
Austin and Macaulay developed their method in research on space technologies selected for trial
under the auspices of NASA’s New Millennium Program.
44
In the analysis of space technologies,
NASA was both the consumer of the technologies and the producer of the downstream product,
and the performance and prices were already fairly well known.
Shortly after the NASA work, the Advanced Technology Program (ATP) engaged Austin and
Macauley to adapt and apply their method to estimate potential consumer benefits from two digital
40
Austin and Macauley drew on earlier work by Stanford University’s Timothy Bresnahan, whose focus was
retrospective applications, to develop the Cost Index Method with its focus on prospective applications. Bresnahan
pioneered the cost-index approach for estimating the consumer surplus from early advances in mainframe computers
(Bresnahan, 1986).
41
Austin and Macauley, 2000, p. 5.
42
Austin and Macauley, 1998, p. 7.
43
Consumer surplus is the amount that consumers benefit by being able to purchase a good or service for a price that
is less than they would be willing to pay for it. The method does not include producer surplus.
44
Austin and Macauley, 1998
96

Overview of Evaluation Methods for R&D Programs
data storage technologies—optical tape read/write technology and linear scanning of magnetic
tape—developed by firms in ATP-funded projects. The ATP technologies were less far along and
had more uncertainties than the space technologies. Furthermore, in contrast to the NASA
application where the consumers were in-house space scientists, in the ATP application the
consumers were downstream buyers of digital storage in the marketplace. To reflect high
uncertainty about future outcomes, Austin and Macauley incorporated in the model probability
distributions of several parameters, including off-the-shelf nominal prices, quarterly rates of
change in these prices, quality differences between performance attributes of the innovation and
the defender technologies, market size, adoption rates, personal consumption expenditures, and
shadow prices. The ATP analysis reveals the sensitivity of results to these values.
Figure 2-19. Model Inputs, Intermediate Calculations, and Outputs
Both of the ATP technologies were expected to achieve much faster writing and retrieval of digital
data than would be possible with defender technologies, and one of the technologies additionally
offered a large increase in storage capacity. The study estimated expected benefits to consumers
in excess of $1 billion from the optical tape technology, and $2 billion from the linear scanning
technology, both projected over a five year period.
References
David Austin and Molly Macauley, “A Quality-Adjusted Cost Index for Estimating Future
Consumer Surplus from Innovation,” Resources for the Future, Discussion Paper 98-45, July
1998).
97
Overview of Evaluation Methods for R&D Programs
David Austin and Molly Macauley, Resources for the Future, Estimating Future Consumer
Benefits from ATP-Funded Innovation: The Case of Digital Data Storage, NIST GCR 00-790
(Gaithersburg, MD: National Institute of Standards and Technology, April 2000).
Tim Bresnahan, “Measuring the Spillovers from Technical Advance: Mainframe Computers in
Financial Services,” American Economic Review, vol. 76, no. 4, September 1986, pp. 742-755.
Rosalie Ruegg and Irwin Feller, A Toolkit for Evaluating Public R&D Investment, NIST GCR 03-
857 (Gaithersburg, MD: National Institute of Standards and Technology, July 2003), “Chapter 7,
Econometric/Statistical Method,” pp. 217-249.
Mariko Sakakibara and Lee Branstetter, Measuring the Impact of ATP-Funded Research
Consortia on Research Productivity of Participating Firms, NIST GCR 02-830 (Gaithersburg,
MD: National Institute of Standards and Technology, November 2002).
98

Overview of Evaluation Methods for R&D Programs
2.13 Historical Tracing Method
Program Manager Goals:
• Improve Program
• Communicate why the program is worth doing
Four Phases of Program Performance Cycle:
1. Design/revise, plan, select, budget
2. Make R&D progress, review processes, achieve outputs
3. Disseminate outputs, achieve interim outcomes
4. Commercialization, market acceptance, energy savings,
energy security, other outcome s and impacts
Information Provided by Evaluation Methods:
• Planning information
• Indicators of interim progress
• Analysis of collaborative and other relationships
• Creation and dissemination of knowledge outputs
• Energy savings, economic, environmental, energy security, option and other
benefits, and benefit-cost measures
• Spillover effects
• Comparative standing
• Overview – was it worth it?
[Goals, phases, and information provided by this method are highlighted]
The historical tracing method has been successfully used to trace highly
successful commercial products back to earlier DOE research. Showing these
linkages helps to demonstrate the importance of past research and suggests the
potential importance of present research not yet incorporated in commercial
products.
Definition: The historical tracing (or “historiographic”) method traces chronologically a series of
interrelated events either going forward from the research of interest to downstream outcomes or
working backward from an outcome along a path that is expected to lead to precursor research. If
all likely paths are followed, forward tracing can capture a relatively comprehensive view of a
research project’s or programs’ effects, and, because the path leads from the research, the
connection to the research is assured. Backward tracing usually focuses on a single outcome of
importance and follows the trail back through those developments that seem to have been critical
to reaching the identified outcome—which may or may not link back to the research program of
interest.
How historical tracing studies are organized, conducted, and analyzed:
The approach to conducting historical tracing studies has evolved over time. These studies have
most often been organized as backward tracing studies to examine key mechanisms, institutions,
activities, and processes that seemed to play a key role in an observed innovation. Earlier studies
relied mainly on expert opinion solicited by interview to identify and understand key events in the
99

Overview of Evaluation Methods for R&D Programs
development of an innovation. Each interview would often identify earlier events, people, and
organizations to investigate on the backward tracing path. As computerized citation analysis
developed, it was found that citation analysis studies could be helpful in identifying a path of
linkages to follow. The result has been the evolution of a hybrid approach to historical tracing
studies that combines “detective work,” expert opinion solicited by interview, and publication and
patent citation analyses. Results have been presented as roadmaps leading to and from research
programs to successful innovations.
Limitations: Establishing cause and effect is difficult; antecedents to technological innovations
are complex. A given innovation is typically the result of a number of direct and indirect effects,
efforts by multiple people and organizations, and the synthesis of advances in knowledge on
multiple fronts, often occurring over decades prior to the emergence of the innovation of focus.
Hence, historical tracing studies typically require the elapse of considerable time in order for a
history to be established. Substantial judgment is required to assess the comparative significance
of various research events; significant events may be overlooked or dropped from an investigation.
These studies tend to be time consuming and costly.
Uses:
To show the path by which a particular research program led to useful downstream products and
processes.
To increase understanding of the evolutionary processes of R&D and innovation.
To suggest that the benefits of research outweigh its costs by comparing a proven-to-be-valuable
innovation against the costs of a research program shown to underpin the innovation.
Examples: Two examples are provided of using historical tracing to investigate the role of
Federal R&D programs in downstream innovations. The first example is of an early use of the
method in Federal R&D evaluation that relies on interviews. The second example is of a later use
that brings in citation analysis, in addition to interviews with experts. While the method has not
been used extensively, other examples exist.
45
Example 1: Using historical tracing in DOD’s “Project Hindsight”
The earliest example found of historical backward tracing used by a U.S. government research
program is “Project Hindsight,” conducted by the Department of Defense in the early 1960s. The
study traced backwards over 20 years the development of each of 20 major weapons systems
supported by DOD in order to identify the key research outputs that contributed to their realization.
The study used the approach of interviewing experts. It linked the support of research to a variety
of desirable technological outcomes. It examined characteristics of what were identified as critical
R&D events to ascertain whether any general principles could be extracted. A major conclusion
related to the science-technology conversion process was that the results of research were most
45
Project Hindsight was followed by Project TRACES later in the 1960s, which examined key events leading to five
technological innovations. A follow-on study to TRACES investigated significant events leading to 10 innovations.
A study in the mid-1980s investigated research developments that appeared important to advances in cancer research.
A historical tracing study performed in the late 1980s assessed the evolution of a set of DARPA projects.
100

Overview of Evaluation Methods for R&D Programs
likely to be used when the researcher was intimately aware of the needs of the applications
engineer.
46
Example 2: Using historical tracing to examine the role of NSF’s support of engineering in six
innovations
The historical tracing method was later used by SRI International in a two-part study to trace the
impact of NSF research on the development of a group of selected major technological
innovations.
47
The innovations were the internet, magnetic resonance imaging (MRI), reaction
injection molding (RIM), computer-aided design applied to electron circuits (CAD/EC), and
optical fiber for telecommunications and analog cellular phones.
The study approach combined qualitative and bibliometric techniques to trace developments. It
began by forming a technical review panel to help select the innovations, provide background
information on selected cases, and review the cases as they were completed. After the innovations
were selected, the study identified the technologies that underpinned each of the innovations and
which technologies were unique to each innovation. Study analysts performed a search of online
databases to identify references that described the development of the unique underlying
technologies. Using database searches and conducting interviews and informal discussions with
NSF staff, analysts identified the major companies, Federal labs, Federal agencies, universities,
and other organizations that played a significant role in the development of these enabling
technologies. Analysts then conducted interviews with those identified, asking them about the
history of the technologies and NSF’s role. A bibliometric citation study was conducted,
searching on keywords found to be important in each area of innovation to help identify patents
and papers underlying the technologies.
Study findings included the conclusion that in most of the cases government agency support for
R&D was important and that in all of the cases there was government support of graduate
education for the scientists and engineers who made major contributions to these innovations.
NSF’s direct research support was found to be a key factor to successful innovation mainly in the
case of the CAD/EC innovation. In retrospect, the richness of the qualitative work was noted as
being of prime importance in contributing to the quality of the evaluation.
48
Table 2-18 summaries the influences of the following NSF support modes in each of the
technology cases examined: education, direct research support, direct contribution to the
knowledge base, direct contribution to the research infrastructure, direct contribution to supporting
technology, organizational leadership, and facilitation of interaction and communication.
49
46
Sherwin and Isenson, 1967.
47
David Roessner et al., 1997 and 1998.
48
Diana Hicks et al., 2002.
49
David Roessner et al., 1998.
101

Overview of Evaluation Methods for R&D Programs
Table 2-18. Summary Assessment OF NSF Support
Internet High
RIM Moderate
MRI Moderate/Low
CAD/EC High
Fiber Optics Moderate/Low
Cellphone Low
Source: David Roessner et al., 1998.
References
Diana Hicks, Peter Kroll, Francis Narin, Patrick Thomas, Rosalie Ruegg, Hiroyuki Tomizawa,
Yoshiko Saitoh, and Shinichi Kobayashi, Quantitative Methods of Research Evaluation Used by
the U.S. Federal Government, NISTEP Study Material, No. 86, May 2002.
Ronald N. Kostoff and Robert R. Schaller, Paper submitted to IEEE Transactions on Engineering
Management and available on-line at
www.onr.navy.mil/sci_tech/special/354/technowatch/docs/mapieee10.doc.
David Roessner, Barry Bozeman, Irwin Feller, C. Hill, and N. Newman, The Role of NSF’s
Support of Engineering in Enabling Technological Innovation, first year final report for the
National Science Foundation (Arlington, VA: SRI International, January 1997), available on-line
at www.sri.com/policy/csted/reports/sandt/techin/welcome.shtml.
David Roessner, R. Carr, Irwin Feller, M. McGeary, and N. Newman, The Role of NSF’s Support
of Engineering in Enabling Technological Innovation: Phase II, final report to National Science
Foundation (Arlington, VA: SRI International, May 1998), available on-line at
www.sri.com/policy/csted/reports/sandt/techin2/contents.html.
C.W. Sherwin and R.S. Isenson, “Project Hindsight: Defense Department Study of the Utility of
Research,” Science, 156 (1967), pp. 1571-1577.
102

Overview of Evaluation Methods for R&D Programs
2.14 Spillover Analysis Using a Combination of Methods
Program Manager Goals:
• Improve Program
• Communicate why the program is worth doing
Four Phases of Program Performance Cycle:
1. Design/revise, plan, select, budget
2. Make R&D progress, review processes, achieve outputs
3. Disseminate outputs, achieve interim outcomes
4. Commercialization, market acceptance, energy savings,
energy security, other outcome s and impacts
Information Provided by Evaluation Methods:
• Planning information
• Indicators of interim progress
• Analysis of collaborative and other relationships
• Creation and dissemination of knowledge outputs
• Energy savings, economic, environmental, energy security, option and other
benefits, and benefit-cost measures
• Spillover effects
• Comparative standing
• Overview – was it worth it?
[Goals, phases, and information needs relevant to this method are highlighted]
Spillover analysis can be used to measure the surplus benefits to producers
who use new and improved technologies, the surplus benefits to consumers
who buy goods and services incorporating the new and improved technologies,
the benefits to those in other industries who are able to use the knowledge
from the research without having paid for it, and the benefits realized by those
whose existing goods and services are increased in value due to
complementarities of the new and improved technologies. Spillover analysis
reveals to a fuller extent the value to society of research and thereby is
important to avoiding underinvestment in research.
Definition: A spillover (also known broadly in economics as an “externality”) is an effect that
results when an activity undertaken by one or more parties affects another party or parties external
to the decision to undertake the activity. These effects may be positive or negative; they may be
economic or non-economic. For example, toxic emissions released as a by-product of an
industrial process is a negative environmental externality or spillover, while reduced risk of
contracting an infectious disease because others receive a vaccine is a positive health externality or
spillover. An activity giving rise to negative externalities or spillovers will be oversupplied in
competitive markets and an activity giving rise to positive externalities or spillovers will be
undersupplied. It has been demonstrated by a large body of evaluation studies that R&D activities
generate positive “research spillovers.”
103

Overview of Evaluation Methods for R&D Programs
How research spillovers arise: Figure 2-20 developed by Adam Jaffe, illustrates how R&D by a
firm (“Firm 1”) can yield positive spillovers. The firm uses its new knowledge from research to
produce better and/or lower cost products. The innovating firm profits and its consumers benefit
by receiving more for their money or by paying less. Knowledge gets into the hands of other
firms—through its intended release in papers and patents, but also in unintended ways such as by
reverse engineering and worker mobility. Some of these other firms use the knowledge gained
from Firm 1’s research without compensation to improve their own products competing with those
of Firm 1, thereby capturing some of the profit from Firm 1’s innovation and driving the price
down further for consumers. Some use the knowledge gained to innovate in other product markets,
realizing profit from Firm 1’s research and benefiting their own customer base. Spillovers result
from direct commercialization by the innovator, from knowledge captured by others,
50
and, in this
example, from a combination of both. Social benefits are the sum of the gains to all producers and
consumers, which in the diagram is much larger—due to market and knowledge spillovers—than
the gains realized by the firm who performed the research. For this reason, spillovers are often
discussed in terms of social versus private returns.
Figure 2-20. Illustration of how R&D Market Spillovers, Knowledge Spillovers, and Their Interactions
Create Spillovers that Widen the Gap between Private Returns and Social Returns
.
Source: Adam Jaffe, 2003.
Types of research spillovers:
51
Research produces knowledge, and knowledge is difficult to keep
from others. Benefits to others that arise due to the uncompensated acquisition and use of an
innovator’s knowledge are “knowledge spillovers.” Research also produces innovations reflected
50
It should be noted that commercialization ultimately is needed for the creation of economic value from knowledge
spillovers.
51
The classification given is after Jaffe, 1996.
104

Overview of Evaluation Methods for R&D Programs
in new and better goods and services. Benefits that accrue to customers in the marketplace by an
innovator’s sale of goods and services that are lower priced, higher quality, or with new and
improved features for a price that does not fully compensate the improvements are “market
spillovers.” A third type of research spillover, likely less common than the first two, are “network
spillovers,” which arise when research and market activities generate benefits to third parties by
providing interrelated, complementary, or interdependent technologies, or by creating a critical
mass. For example, developing a new software application for a computer operating system may
increase the popularity of the operating system, thereby increasing the value of software written
for it by other vendors. As additional examples, the value of services provided by website hosts
may be increased by implementation of a more powerful search engine, and the value to an
individual of having a cell phone may increase in response to an innovation that causes more
people to become cell phone users.
Significance of spillovers to public policy:
The idea, supported by evidence, that R&D—
particularly certain types of R&D under certain conditions—yields large positive spillover effects
is one of the rationales for public funding of R&D.
52
The rationale is that the private sector tends
to invest less in research than is optimal from the standpoint of society because their investment
decisions are based only on the benefits they directly capture, rather than on the total gain by
society.
Public vs. private perspectives on spillovers: From the perspective of an innovating firm,
knowledge spillovers are generally viewed negatively. Innovating firms seek defensible property
rights, trade-secret strategies, reducing worker turnover, and other strategies designed to preserve
incentives to pursue commercialization in the face of difficulty in capturing (or “appropriating”)
the returns from their research. Other firms who are the recipients of knowledge spillovers will
see the beneficial aspects. Likewise, a public R&D program views research spillovers as positive.
While businesses seek to maximize private returns, government R&D programs seek to maximize
social returns (or returns to the nation as a whole). By choosing projects for which research
spillovers are large and which are likely to be under funded by the private sector acting alone, a
government R&D program can have large, broad impact.
53
Measuring spillovers:
Past evaluation studies have tended to focus either on measuring market
spillovers or knowledge spillovers, but not to combine estimation of both knowledge and market
spillovers. More has been done in measuring market spillovers, following the lead and general
approach of Mansfield.
54
In Section 2-12, an example was given of a cost index method developed
52
In addition to spillovers, other rationales for government intervention to foster more R&D, accelerate R&D, and
affect the composition of R&D include higher than average levels of risk for some types of research arising from
greater technical complexity and difficulty, longer time to market during which uncertain competition with defender
technologies may occur, and/or larger resource requirements than most private firms are willing to bear; difficulty in
obtaining funding in capital markets for early stage research; and coordination problems among researchers. As
explained by Greg Tassey, 2005, in his focus on underinvestment as it relates to the optimal composition of R&D,
defining an optimum rate of investment in elements of industrial technologies which have a quasi-public good
character is complex and challenging for R&D policy.
53
A point that should not be lost sight of is that the principle of “additionality” applies in the analysis of spillover
effects just as it does in all evaluations of government program impact. That is, we will need to ask not only to what
extent did a government research program yield spillover benefits, but how much of it would not have happened
without the government program.
54
Mansfield, 1977.
105

Overview of Evaluation Methods for R&D Programs
and implemented by Austin and Macauley for estimating market spillovers to consumers under
certain conditions that avoids the requirement for some of the market data that is required to use
the Mansfield approach.
55
More recently, Deng has developed and implemented a method of
quantifying the “R&D-equivalent” economic value of knowledge spillovers embodied in patent
citations at the firm level, building on work by Jaffe and Lerner and other.
56
,
57
There are also
possibilities for broadening Mansfield’s approach to combine market and knowledge spillover
assessment within a single benefit-cost framework to obtain more comprehensive results at the
project or program case-study level.
58
Limitations of measuring spillovers: Measuring spillovers is complex and challenging.
Research projects produce outputs which interact uniquely with outputs of other projects,
technologies, people, and organizations over their life cycles. Detailed, disaggregated analysis is
usually required to ferret out diverse effects of specific innovations over time. Some forms of
knowledge spillovers leave few tracks. It is difficult to separate out the various sources and
quantities of knowledge used by others in their activities and difficult to attribute outcomes to a
particular knowledge source or to apportion outcomes among multiple sources. It is likely
impossible to identify and trace all aspects of knowledge flows in all their manifestations; hence,
at best an incomplete picture can be obtained. Measuring market spillovers is also challenging
because it generally requires considerable information about market demand, supply, and defender
technologies, which often is difficult to obtain. Data collection problems also tend to arise when
there are long time periods to be researched. Further, because past evaluation studies have tended
not to combine estimation of both knowledge and market spillovers, there is absent a rich
background of experience and reference work from which to draw comprehensive spillover
measurement.
Uses:
To show the societal impacts of an R&D project or program, much of which may lie outside
the scope of direct private returns on investment.
To demonstrate the importance of public support for R&D and to help make the case for it.
To provide more defensive evidence of a program’s broader impact.
Examples: As was demonstrated in previous sections, there are many examples of evaluation
studies that have focused on some aspect of spillovers. Rather than repeat the examples, they are
referenced here, along with the approach by Deng, for the convenience of the reader.
An example of market spillover estimation—with the focus on gains to consumers—is given for
the Cost-Index Method illustrated in Section 2.13, “Econometric Methods.” There, consumers are
shown to benefit from research funded jointly by a government R&D program and several
innovating companies.
55
Austin and Macauley, 1998.
56
Deng, 2005.
57
Jaffe and Lerner, 2001.
58
Mansfield, 1996.
106
Overview of Evaluation Methods for R&D Programs
Section 2.2, “Bibliometric Method—Counts and Citation Analysis,” Example 2, shows how
knowledge spillovers can be suggested by citation analysis. And, although the examples of
Section 2.5, “Network Analysis,” do not explicitly discuss knowledge spillovers, the network
diagrams of researcher relationships suggest the flow of knowledge and the likely generation of
knowledge spillovers, albeit within the researcher community.
The examples of Sections 2.10, 2.11, and 2.12 used relatively broad measures of benefits that to
some extent incorporated spillovers, but did not separately identify them. None of these examples,
however, successfully combined estimation of multiple types of spillovers. None of them
attempted other than partial estimation of spillovers; none attempted to estimate the downstream
value of knowledge spillovers. These are examples that remain to be developed.
References
David Austin and Molly Macauley, “A Quality-Adjusted Cost Index for Estimating Future
Consumer Surplus from Innovation,” Resources for the Future, Discussion Paper 98-45, July
1998).
Yi Deng, “The Value of Knowledge Spillovers,” Working Paper Series 2005-14, Federal Reserve
Bank of San Francisco, June 2005.
Adam B. Jaffe, Economic Analysis of Research Spillovers: Implications for the Advanced
Technology Program, NIST GCR 97-708 (Gaithersburg, MD: National Institute of Standards and
Technology, December 1996).
Adam Jaffe and Josh Lerner, “Reinventing Public R&D: Patent Policy and the Commercialization
of National Laboratory Technologies,” Rand Journal of Economics, Vol. 32, No. 1, 2001, 167-199.
Edwin Mansfield, “Social and Private Rates of Return from Industrial Innovations,” Quarterly
Journal of Economics, 91(2):221-240, 1977.
Edwin Mansfield, “Estimating Social and Private Returns from Innovations Based on the
Advanced Technology Program: Problems and Opportunities,” GCR 99-780 (Gaithersburg, MD,
January 1996).
Gregory Tassey, “Underinvestment in Public Good Technologies,” Journal of Technology
Transfer, 30 1\2, 89-113, 2005.
107
