
(KT0)
Department of Public Works
www.dpw.dc.gov
Telephone: 202-673-6833
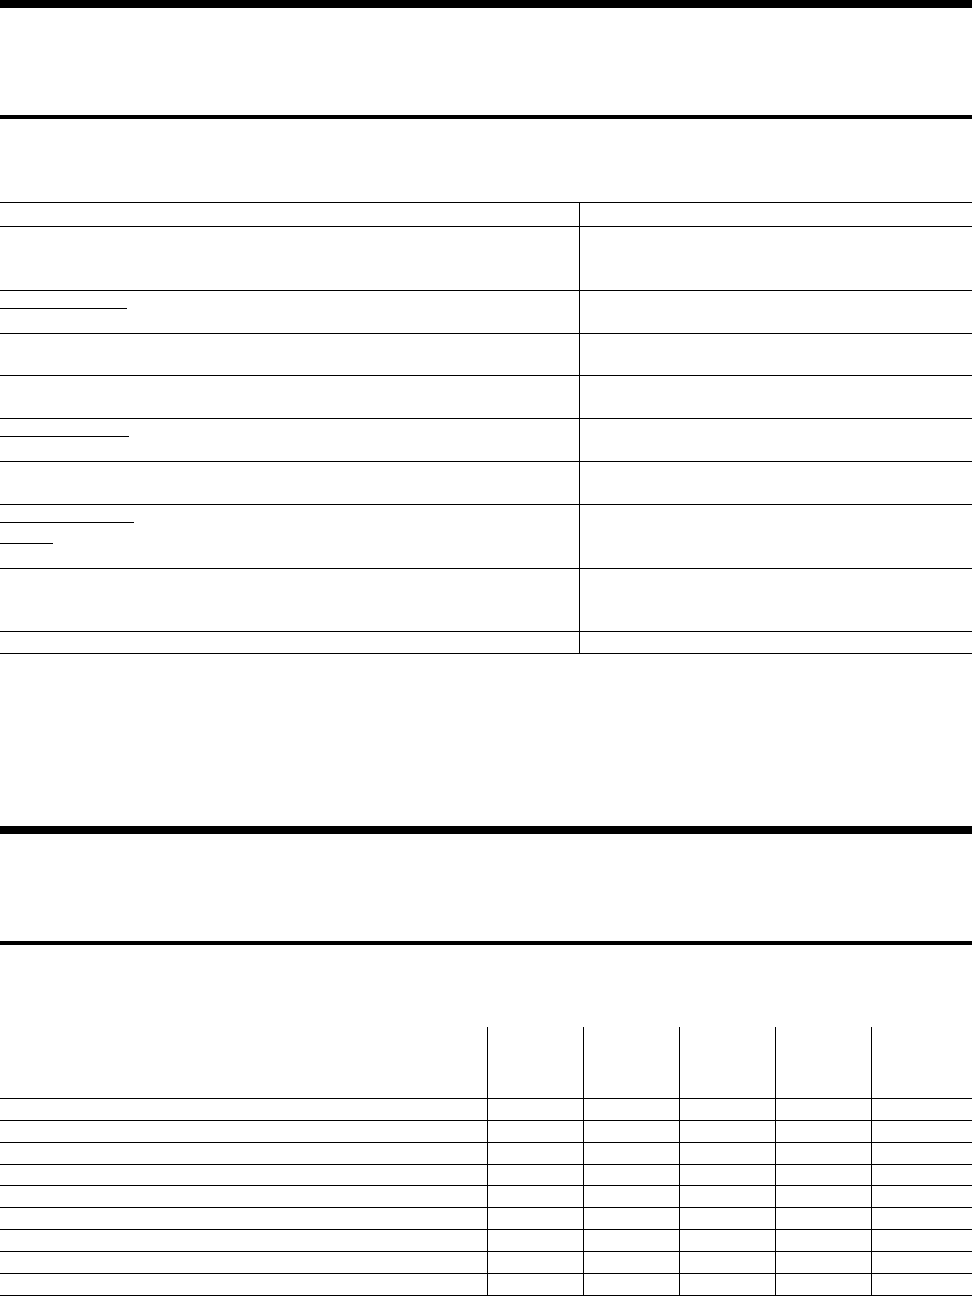
Table KT0-1
Description
FY 2019
Actual
FY 2020
Actual
FY 2021
Approved
FY 2022
Proposed
% Change
from
FY 2021
OPERATING BUDGET $178,417,730 $180,217,953 $190,104,681 $206,543,011 8.6
FTEs 1,340.6 1,452.0 1,479.0 1,501.0 1.5
CAPITAL BUDGET $10,265,876 $16,342,560 $38,644,734 $58,461,286 51.3
FTEs 0.0 0.0 0.0 0.0 N/A
The mission of the Department of Public Works (DPW) is to provide
the highest quality sanitation, parking enforcement, and fleet
management services that are both ecologically sound and
cost-effective.
Summary of Services
The Department of Public Works provides municipal services to District residents and businesses in three
distinct program areas: solid waste management, parking enforcement, and snow removal. Behind the scenes,
DPW’s Fleet Management Administration supports all city services by procuring, fueling, and maintaining
thousands of District government vehicles from sedans to heavy equipment.
The agency’s FY 2022 proposed budget is presented in the following tables:
FY 2022 Proposed Gross Funds Operating Budget and FTEs, by Revenue Type
Table KT0-2 contains the proposed FY 2022 budget by revenue type compared to the FY 2021 approved
budget. It also provides FY 2019 and FY 2020 actual data.
Table KT0-2
(dollars in thousands)
Dollars in Thousands Full-Time Equivalents
Appropriated Fund
Actual
FY 2019
Actual
FY 2020
Approved
FY 2021
Proposed
FY 2022
Change
from
FY 2021
%
Change*
Actual
FY 2019
Actual
FY 2020
Approved
FY 2021
Proposed
FY 2022
Change
from
FY 2021
%
Change
GENERAL FUND
Local Funds 137,950 146,535 147,648 161,998 14,350 9.7 1,158.6 1,243.0 1,293.0 1,306.0 13.0 1.0
Special Purpose Revenue
Funds 10,081 9,624 13,402 13,721 319 2.4 25.6 35.0 29.0 35.0 6.0 20.7
TOTAL
FOR GENERAL FUND 148,030 156,159 161,050 175,719 14,669 9.1 1,184.3 1,278.0 1,322.0 1,341.0 19.0 1.4
PRIVATE FUNDS
Private Grant Funds 0 6 0 0 0 N/A 0.0 0.0 0.0 0.0 0.0 N/A
TOTAL FOR PRIVATE
FUNDS 0 6 0 0 0 N/A 0.0 0.0 0.0 0.0 0.0 N/A
INTRA-DISTRICT
FUNDS
Intra-District Funds 30,387 24,053 29,055 30,824 1,770 6.1 156.3 174.0 157.0 160.0 3.0 1.9
TOTAL
FOR INTRA-DISTRICT
FUNDS 30,387 24,053 29,055 30,824 1,770 6.1 156.3 174.0 157.0 160.0 3.0 1.9
GROSS FUNDS 178,418 180,218 190,105 206,543 16,438 8.6 1,340.6 1,452.0 1,479.0 1,501.0 22.0 1.5
*Percent change is based on whole dollars.
Note: If applicable, for a breakdown of each Grant (Federal and Private), Special Purpose Revenue type and Intra-District agreement,
please refer to Schedule 80 Agency Summary by Revenue Source in the FY 2022 Operating Appendices located on the Office of
the Chief Financial Officer’s website.
FY 2022 Proposed Operating Budget, by Comptroller Source Group
Table KT0-3 contains the proposed FY 2022 budget at the Comptroller Source Group (object class) level
compared to the FY 2021 approved budget. It also provides FY 2019 and FY 2020 actual expenditures.
Table KT0-3
(dollars in thousands)
Comptroller Source Group
Actual
FY 2019
Actual
FY 2020
Approved
FY 2021
Proposed
FY 2022
Change
from
FY 2021
Percentage
Change*
11 - Regular Pay - Continuing Full Time 76,954 81,338 85,428 86,602 1,174 1.4
12 - Regular Pay - Other 5,087 6,182 3,796 9,099 5,303 139.7
13 - Additional Gross Pay 2,439 3,094 3,175 3,175 0 0.0
14 - Fringe Benefits - Current Personnel 23,428 23,603 24,614 27,266 2,652 10.8
15 - Overtime Pay 9,835 7,927 6,206 6,206 0 0.0
SUBTOTAL PERSONAL SERVICES (PS) 117,743 122,144 123,219 132,347 9,128 7.4
20 - Supplies and Materials 8,490 7,436 7,733 7,505 -228 -2.9
31 - Telecommunications 170 112 273 261 -12 -4.6
40 - Other Services And Charges 24,607 22,666 28,740 28,941 200 0.7

Table KT0-3
(dollars in thousands)
Comptroller Source Group
Actual
FY 2019
Actual
FY 2020
Approved
FY 2021
Proposed
FY 2022
Change
from
FY 2021
Percentage
Change*
41 - Contractual Services - Other 23,007 23,499 24,537 32,926 8,389 34.2
70 - Equipment and Equipment Rental 4,401 4,360 5,602 4,563 -1,039 -18.5
SUBTOTAL NONPERSONAL SERVICES (NPS) 60,674 58,074 66,886 74,196 7,310 10.9
GROSS FUNDS 178,418 180,218 190,105 206,543 16,438 8.6
*Percent change is based on whole dollars.
FY 2022 Proposed Operating Budget and FTEs, by Division/Program and Activity
Table KT0-4 contains the proposed FY 2022 budget by division/program and activity compared to the
FY 2021 approved budget. It also provides FY 2019 and FY 2020 actual data. For a more comprehensive
explanation of divisions/programs and activities, please see the Division/Program Description section, which
follows the table.
Table KT0-4
(dollars in thousands)
Dollars in Thousands Full-Time Equivalents
Division/Program and Activity
Actual
FY 2019
Actual
FY 2020
Approved
FY 2021
Proposed
FY 2022
Change
from
FY 2021
Actual
FY 2019
Actual
FY 2020
Approved
FY 2021
Proposed
FY 2022
Change
from
FY 2021
(0000)
No Activity Assigned
-1,282 -2,073 0 0 0 0.0 0.0 0.0 0.0 0.0
SUBTOTAL (0000)
-1,282 -2,073 0 0 0 0.0 0.0 0.0 0.0 0.0
(1000) AGENCY MANAGEMENT
(1010) Personnel
1,494 1,405 1,608 1,765 157 11.1 11.6 12.0 12.0 0.0
(1015) Training and Employee
Development
925 889 1,053 1,084 30 8.3 8.7 9.0 10.0 1.0
(1030) Property Management
17,510 18,265 19,195 19,614 419 6.5 6.7 7.0 7.0 0.0
(1040) Information Technology
2,653 1,887 2,271 2,353 82 19.4 19.3 10.0 10.0 0.0
(1055) Risk Management
448 392 446 484 37 2.8 2.9 3.0 3.0 0.0
(1060) Legal
702 953 1,041 1,070 29 3.7 6.2 7.0 7.0 0.0
(1080) Communications
919 848 1,142 1,148 5 6.5 6.7 7.0 7.0 0.0
(1090) Performance Management
1,634 1,890 1,798 1,607 -191 7.4 7.7 10.0 8.0 -2.0
(2010) Office of Waste Diversion
720 878 1,253 1,304 51 5.6 8.0 8.0 7.0 -1.0
(2020) Strategic Planning & Performance
Management
543 474 527 559 33 3.7 3.8 3.0 3.0 0.0
SUBTOTAL (1000) AGENCY
MANAGEMENT
27,548 27,880 30,335 30,988 653 75.0 81.5 76.0 74.0 -2.0
(100F) AGENCY FINANCIAL
OPERATIONS
(110F) Budget Operations
692 769 889 939 50 4.6 4.8 6.0 6.0 0.0
(120F) Accounting Operations
1,918 1,751 1,797 1,165 -631 15.8 17.5 15.0 9.0 -6.0
(130F) OCFO
1,808 1,709 1,981 2,975 995 12.0 12.5 13.0 19.0 6.0
SUBTOTAL (100F) AGENCY
FINANCIAL OPERATIONS
4,418 4,229 4,667 5,080 413 32.5 34.8 34.0 34.0 0.0
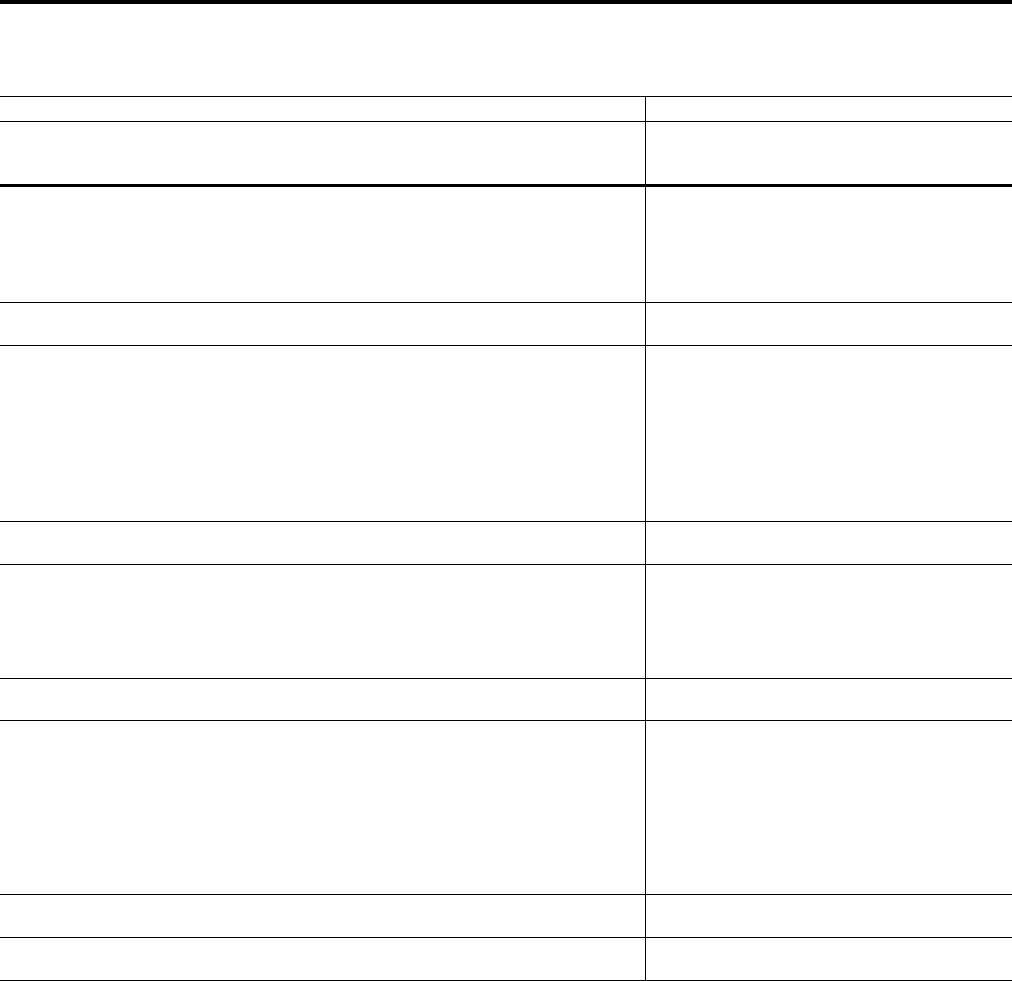
Table KT0-4
(dollars in thousands)
Dollars in Thousands Full-Time Equivalents
Division/Program and Activity
Actual
FY 2019
Actual
FY 2020
Approved
FY 2021
Proposed
FY 2022
Change
from
FY 2021
Actual
FY 2019
Actual
FY 2020
Approved
FY 2021
Proposed
FY 2022
Change
from
FY 2021
(2000) SNOW REMOVAL PROGRAM
(2030) Snow Removal
2,186 1,015 935 1,004 69 0.0 0.0 0.0 0.0 0.0
(2040) Road Treatment
1,285 1,472 1,354 1,500 146 0.0 0.0 0.0 0.0 0.0
(2050) Equipment Rental
2,368 2,903 2,701 2,701 0 0.0 0.0 0.0 0.0 0.0
(2060) Contract Plows
3,432 1,019 3,660 2,995 -665 0.0 0.0 0.0 0.0 0.0
SUBTOTAL (2000) SNOW REMOVAL
PROGRAM
9,271 6,409 8,650 8,200 -450 0.0 0.0 0.0 0.0 0.0
(4000) FLEET MANAGEMENT
(4010) Fleet Consumables
1,407 1,162 1,512 11,988 10,476 7.9 8.8 8.0 8.0 0.0
(4020) Scheduled Fleet Maintenance
510 297 746 713 -32 7.9 8.8 8.0 8.0 0.0
(4030) Unscheduled Vehicle and
Equipment Repairs
8,955 7,737 10,340 10,109 -231 66.3 73.3 67.0 67.0 0.0
(4040) Vehicle And Equipment
Acquisitions
9,270 11,037 9,859 9,757 -102 30.7 33.9 30.0 30.0 0.0
(4050) Fleet Administrative Support
1,988 1,658 2,431 2,701 270 27.7 30.6 28.0 28.0 0.0
SUBTOTAL (4000) FLEET
MANAGEMENT
22,130 21,890 24,888 35,268 10,380 140.5 155.4 141.0 141.0 0.0
(5000) PARKING ENFORCEMENT
MANAGEMENT
(5010) Parking Regulations Enforcement
25,119 27,333 27,804 28,630 826 303.8 331.2 356.0 359.0 3.0
(5020) Towing
3,442 4,088 4,585 4,487 -98 25.0 53.9 51.0 52.0 1.0
(5030) Abandoned And Junk Vehicles
1,797 1,287 1,945 2,294 349 17.6 19.3 20.0 26.0 6.0
SUBTOTAL (5000) PARKING
ENFORCEMENT MANAGEMENT
30,358 32,708 34,334 35,411 1,077 346.4 404.4 427.0 437.0 10.0
(6000) SOLID WASTE
MANAGEMENT
(6010) Enforcement of Sanitation
Regulations
6,840 8,271 7,489 7,209 -280 55.7 53.4 56.0 56.0 0.0
(6020) Public Space Cleaning
30,950 29,806 32,215 36,824 4,609 381.7 399.4 412.0 406.0 -6.0
(6030) Sanitation Collections and
Removals
25,335 25,865 23,365 25,031 1,666 258.4 267.7 279.0 294.0 15.0
(6040) Sanitation Disposal
22,850 25,232 24,162 22,533 -1,629 50.4 55.4 54.0 59.0 5.0
SUBTOTAL (6000) SOLID WASTE
MANAGEMENT
85,975 89,174 87,231 91,597 4,366 746.2 775.9 801.0 815.0 14.0
TOTAL PROPOSED OPERATING
BUDGET
178,418 180,218 190,105 206,543 16,438 1,340.6 1,452.0 1,479.0 1,501.0 22.0
(Change is calculated by whole numbers and numbers may not add up due to rounding)
Note: For more detailed information regarding the approved funding for the activities within this agency’s programs, please see Schedule
30-PBB Program Summary by Activity in the FY 2022 Operating Appendices located on the Office of the Chief Financial Officer’s
website. “No Activity Assigned” indicates budget or actuals that are recorded at the division/program level.
Division Description
The Department of Public Works (DPW) operates through the following 6 divisions:
Snow Removal Program – ensures the District is safe to navigate after the end of a snow storm and can
resume normal government services and business commerce in an efficient, environmentally sustainable and
safe manner.
This division contains the following 4 activities:
•
Snow Removal – provides the staffing, overtime, and other required tools to administer the District's
Snow Removal program;
•
Road Treatment – provides salt and beet juice to treat District roadways prior to, during, and after
snow storms; and
•
Equipment Rental – facilitates rental of snow equipment, which includes dump trucks, pickup trucks
and other snow removal related equipment. Also, the maintenance and repairs of District-owned snow
equipment is included in this activity.
•
Contract Plows– facilitates the District's contracting with private companies to assist with the plowing
of District streets during snow storms.
Fleet Management – supports all city services by procuring and maintaining more than 3,000 vehicles,
excluding those used by the Metropolitan Police Department, the Fire and Emergency Medical Services
Department, the Department of Corrections, and D.C. Public Schools. This division fuels all 6,000 District
government vehicles, including school buses, fire and trash trucks, and street sweepers.
This division contains the following 5 activities:
•
Fleet Consumables – provides most District agencies with operational fueling stations, oil, and other
lubricants; and installs fuel rings;
•
Scheduled Fleet Maintenance – performs preventive maintenance actions, including changing oil and
filters and checking tires, engines, batteries, and transmissions; and prepares vehicles for seasonal and
year-round duties (such as alley cleaning, snow removal, and leaf collection);
•
Unscheduled Vehicle and Equipment Repairs – tows inoperable vehicles, diagnoses why vehicles are
not operating properly, and makes the necessary repairs or transfers vehicles to vendors for return to
service;
•
Vehicle and Equipment Acquisitions – consults with District government agencies about vehicle
needs, ensures these agencies have sufficient budget authority to meet their needs, procures vehicles,
and reduces unnecessary vehicles from the fleet; and
•
Fleet Administrative Support – provides administrative and managerial personnel and nonpersonal
services support for District-wide fleet operations, including uniform rentals, office supplies,
information technology acquisitions, and information technology software maintenance/license
renewals.
Parking Enforcement Management – provides on-street parking enforcement services, including ticketing,
towing, booting, removal of abandoned and dangerous vehicles, and auction of impounded vehicles.
This division contains the following 3 activities:
•
Parking Regulations Enforcement – provides enforcement of the District’s parking regulations to
promote vehicular safety and provide smooth traffic flow and increased access to short-term parking at
meters and long-term parking on residential streets;
•
Towing – provides reduced parking congestion in the District by facilitating the timely relocation and/or
impoundment of illegally parked vehicles from public space; and

•
Abandoned and Junk Vehicles – provides oversight of safe streets through the efficient removal of
abandoned and dangerous vehicles from public space and nuisance properties within the District.
Solid Waste Management – performs a number of daily operations, including trash, recycling, and bulk
collections; sanitation education and enforcement; graffiti removal; public litter can service; fall leaf
collection; snow and ice removal; and street and alley cleaning.
This division contains the following 4 activities:
•
Enforcement of Sanitation Regulations – inspects properties for sanitation violations; enforces
sanitation regulations, including commercial recycling; educates residents and businesses about
sanitation regulations; collects household hazardous waste and electronic materials; and shreds
residents’ personal documents;
•
Public Space Cleaning – provides comprehensive street and alley cleaning services to residents,
visitors, and businesses so that they can live, work, and play in clean neighborhoods. Specific services
include mechanical street sweeping, litter can collections, rights-of-way mowing, nuisance and graffiti
abatement, seasonal leaf collection, and snow and ice removal;
•
Sanitation Collection and Removals – provides solid waste (trash, recycling, and bulk) collection
services to residents of single-family homes and buildings with no more than three dwelling units so that
they can have their trash, recyclables, and bulk items removed conveniently and regularly; and
•
Sanitation Disposal – provides municipal waste disposal services to DPW, other District agencies,
private haulers, and residents so that they can dispose of waste safely, conveniently, and legally.
Agency Management – provides for administrative support and the required tools to achieve operational and
programmatic results. This division is standard for all agencies using performance-based budgeting.
Agency Financial Operations – provides comprehensive and efficient financial management services to, and
on behalf of, District agencies so that the financial integrity of the District of Columbia is maintained. This
division is standard for all agencies using performance-based budgeting.
Division Structure Change
The Department of Public Works has no program/division structure changes in the FY 2022 proposed budget.
FY 2021 Approved Budget to FY 2022 Proposed Budget, by Revenue Type
Table KT0-5 itemizes the changes by revenue type between the FY 2021 approved budget and the
FY 2022 proposed budget. For a more comprehensive explanation of changes, please see the
FY 2022 Proposed Budget Changes section, which follows the table.
Table KT0-5
(dollars in thousands)
DESCRIPTION DIVISION/PROGRAM BUDGET FTE
LOCAL FUNDS: FY 2021 Approved Budget and FTE 147,648 1,293.0
Removal of One-Time Costs Snow Removal Program -5,346 0.0
LOCAL FUNDS: FY 2022 Recurring Budget 142,302 1,293.0
Increase: To align personal services and Fringe Benefits with projected costs Multiple Programs 2,280 -4.0
Decrease: To align resources with operational spending goals Multiple Programs -2,260 0.0
Enhance: ARPA – Local Revenue Repayment Funding to support ARPA – Local
Revenue Repayment Funding to support Seasonal Employees ($5,610,500), Parking
Enforcement Officers ($845,720)
Multiple Programs 6,456 19.0
Enhance: To restore funding for supplemental snow plow contracts (one-time) Snow Removal Program 2,995 0.0

Table KT0-5
(dollars in thousands)
DESCRIPTION DIVISION/PROGRAM BUDGET FTE
Enhance: To restore funding for snow removal equipment (one-time) Snow Removal Program 2,351 0.0
Transfer-In: To align fleet maintenance with projected costs Fleet Management 8,131 0.0
Transfer-Out: To recognize savings from a reduction in FTE(s) Agency Management -237 -2.0
Reduce: To offset projected adjustments in personal services costs Multiple Programs -20 0.0
LOCAL FUNDS: FY 2022 Mayor’s Proposed Budget 161,998 1,306.0
SPECIAL PURPOSE REVENUE FUNDS: FY 2021 Approved Budget and FTE 13,402 29.0
Increase: To align personal services and Fringe Benefits with projected costs Multiple Programs 430 6.0
Decrease: To align resources with operational spending goals Multiple Programs -111 0.0
SPECIAL PURPOSE REVENUE FUNDS: FY 2022 Mayor’s Proposed Budget 13,721 35.0
INTRA-DISTRICT FUNDS: FY 2021 Approved Budget and FTE 29,055 157.0
Increase: To align budget with projected revenues Multiple Programs 948 0.0
Increase: To align personal services and Fringe Benefits with projected costs Multiple Programs 822 3.0
INTRA-DISTRICT FUNDS: FY 2022 Mayor’s Proposed Budget 30,824 160.0
GROSS FOR KT0 - DEPARTMENT OF PUBLIC WORKS 206,543 1,501.0
(Change is calculated by whole numbers and numbers may not add up due to rounding)
FY 2022 Proposed Operating Budget Changes
Table KT0-6 contains the proposed FY 2022 budget by fund compared to the FY 2021 approved budget.
Table KT0-6
Appropriated Fund
FY 2021
Approved
FY 2022
Proposed
% Change
from
FY 2021
Local Funds $147,647,657) $161,997,911) 9.7
Special Purpose Revenue Funds $13,402,249) $13,720,788) 2.4
Intra-District Funds $29,054,775) $30,824,312) 6.1
GROSS FUNDS $190,104,681) $206,543,011) 8.6
Recurring Budget
The FY 2022 budget for Department of Public Works includes net a reduction of $5,346,000 to account for
the removal one-time funding appropriated in FY 2021 to support the Snow Removal program.
Mayor’s Proposed Budget
Increase: DPW's proposed Local budget includes an increase of $2,280,320 in personal services cost across
multiple divisions to align the salary and Fringe Benefit costs, primarily to support step increases. This
increase also is reflective of the removal of 4.0 Full-Time Equivalent (FTE)s.
In Special Purpose Revenue funds, the budget proposal includes a net increase in personal services of
$429,571, which includes 6.0 FTE positions, across multiple divisions for salary and Fringe Benefits costs.
In Intra-District funds, the budget proposal includes a net increase of $947,648 in nonpersonal services
cost to align budget with projected operational cost to maintain Memorandums of Understanding contract,
primarily in the Fleet Management division. In addition, the budget includes an increase in personal services
of $821,889, including 3.0 FTEs, primarily in the Fleet Management division, to align with Memorandum of
Understanding agreements with the Department of General Services.
Decrease: DPW’s Local funds proposed budget includes a net decrease of $2,260,419 in nonpersonal services
cost, primarily in Contractual Services, in the Solid Waste Management and Snow Removal divisions.
In Special Purpose Revenue funds, the budget proposal reflects a decrease of $111,032, primarily in the
Solid Waste Management division, to align the budget to projected revenues.
Enhance: DPW's Local proposed budget reflects $6,456,220 in enhancements and 19 additional FTEs
supported by ARPA – Local Replacement funding. This increase in spending is supported by Coronavirus
Relief funds from the American Rescue Plan Act. This includes $5,610,500 to support the conversion of
previously seasonal leaf collection crews to permanent year-round status to provide supplemental support for
other DPW programs and services, including sanitation collection; the addition of 9 new FTEs to
support this initiative, including supervisors and a mental health counselor. It also includes $845,720 to
support hiring 10 new FTEs and needed equipment and training for DPW to respond to non-emergency
parking complaints. DPW's Local funds proposed budget includes one-time enhancement to support the
Snow Removal program: $2,995,000 for contract plows to supplement District plow crews and for hiring
seasonal staff to support snow removal operations; and $2,351,000 to support equipment leases and
rehabilitation of existing snow program assets, including trucks, plows, and salt spreaders.
Transfer-In: DPW's Local funds proposed budget includes $8,131,132 in subsides and transfers to transfer
the District's auto fuel budget from the Department of General Services to DPW's Fleet Management division.
Transfer-Out: DPW's Local funds proposed budget includes a transfer-out for $237,000 and 2.0 FTEs to
the Office of the Mayor from the Agency Management division.

Agency Performance Plan*
The Department of Public Works (DPW) has the following strategic objectives for FY 2022:
Strategic Objectives
Strategic Objectives describe what the agency will do, at a high level, to achieve its mission. These are
action-based sentences that define what an agency does for its customers, whether the customers are residents
or other District agencies, and how that improves the District.
Objectives
1. Enhance District-wide fleet management systems and services to ensure timely and cost effective
availability of vehicles while decreasing our fleet's environmental impact.
2. Ensure access to parking and improve public safety for residents, businesses, and visitors through
effective enforcement of parking regulations and enhanced public information and communication about
parking and safety.
3. Launch and implement effective strategies and programs designed to reduce waste, increase impact of
recycling efforts, and support greater waste diversion.
4. Provide timely, effective, and ecologically sound waste management, snow removal, street and public
space cleaning, and landscaping services to enhance cleanliness and safety for residents, businesses, and
visitors of the District of Columbia.
5. Create and maintain a highly efficient, transparent, and responsive District government.
ACTIVITIES
Activities include the work that happens on a daily basis to help achieve the Strategic Objectives. Activity
names come from the budget line items. This is further divided into “daily services” (ex. sanitation disposal),
and long-term “key projects” that are high profile, one-time and span several years, (ex. redevelopment of
Walter Reed Army Medical Center). Many agencies will mostly have daily services, whereas some agencies
that have more of their budget come from capital funding will have several key projects.
1. Enhance District-wide fleet management systems and services to ensure timely and cost effective
availability of vehicles while decreasing our fleet's environmental impact. (6 Activities)
Activity Title Activity Description Type of Activity
Operation of District fueling stations and
procurement of fuel
Fuel services are provided to all District fleet and
DPW acquires and tracks all fuel expended.
Daily Service
Administrative support of District fleet operations Fleet administration handles management,
software, and contracts and procurement for the
fleet division.
Daily Service
Management of scheduled District fleet
preventative maintenance
Scheduled fleet maintenance manages and operates
the preventative maintenance of all District
vehicles supported by DPW. Preventative
maintenance is due for most vehicles every 6
months.
Daily Service
Management of unscheduled District fleet repairs Unscheduled vehicle and equipment repairs
manages and operates the ongoing maintenance of
all District vehicles supported by DPW. They also
manage warranty work and and vendor work when
necessary.
Daily Service
Manage District fleet consumables and parts Fleet consumables tracks and buys asset parts and
pieces.
Daily Service
Assist District agencies with vehicle acquisition DPW assists agencies with vehicle acquisition and
tracks vehicle age and repair history.
Daily Service

2. Ensure access to parking and improve public safety for residents, businesses, and visitors through
effective enforcement of parking regulations and enhanced public information and communication
about parking and safety. (4 Activities)
Activity Title Activity Description Type of Activity
Management of Impound Lot The impound lot stores and disposes of vehicles
that have been towed for parking illegally or pose a
safety threat.
Daily Service
Towing of abandoned and junk vehicles Parking investigates and tows vehicles on public
and private property when deemed abandoned.
Daily Service
Parking ticket writing and enforcement To keep parking efficient, safe, and open to meters,
citizens and tourists, parking enforcement officers
ticket vehicles parked illegally.
Daily Service
Towing of parking violators When vehicles are deemed dangerous or illegally
parked for too much time, parking tows the
vehicles to their impound lot.
Daily Service
3. Launch and implement effective strategies and programs designed to reduce waste, increase impact
of recycling efforts, and support greater waste diversion. (1 Activity)
Activity Title Activity Description Type of Activity
Management of waste diversion policy efforts The Office of Waste Diversion researches and
implements efforts to reduce the amount of waste
going to landfills.
Daily Service
4. Provide timely, effective, and ecologically sound waste management, snow removal, street and public
space cleaning, and landscaping services to enhance cleanliness and safety for residents, businesses, and
visitors of the District of Columbia. (9 Activities)
Activity Title Activity Description Type of Activity
Mowing and Landscaping Solid Waste Management mows, trims, and cleans
up the District's public grounds.
Daily Service
Snow Operations DPW removes snow in 9 of 15 snow zones and
manages the overall snow readiness and operational
plan.
Daily Service
Waste diversion and disposal Solid Waste Management manages the waste
streams coming in from public areas, private
citizens and special events to keep the District
clean.
Daily Service
Waste and recycling collections Solid Waste Management drives trucks to citizens'
households to collect trash and recycling on a
weekly or bi-weekly basis.
Daily Service
Public space cleaning Solid Wast Management manages and removes
trash from public litter cans and ensures sidewalks
and public areas remain clean.
Daily Service
Bulk Collection Solid Waste Management picks up private citizen's
large waste item directly from their home and
brings them to the waste transfer stations.
Daily Service
Management of waste transfer stations Solid Waste Management oversees the waste
transfer stations that consume the District's waste
and collects and sorts the waste for landfills and
recycling plans.
Daily Service
Leaf collection In the fall, Solid Waste Management tours
throughout the city to collect citizen's leafs from
their property.
Daily Service
Solid Waste Education and Enforcement (SWEEP) SWEEP investigates potential sanitation disposal
infractions and conducts training and education to
inform the public about proper solid waste disposal.
Daily Service

5. Create and maintain a highly efficient, transparent, and responsive District government.
(4 Activities)
Activity Title Activity Description Type of Activity
Human Capital The Human Capital team manages Human
Resources and supports labor relations and
employee development.
Daily Service
Communications, Branding, and Education The Communications team runs the Clearinghouse
for public information, supports community
meetings and interactions, and creates
informational flyers for DPW routine and special
activities.
Daily Service
Office of Information Technology Services OITS supports the entire agency with software
acquisition and management as well as data
management and analysis.
Daily Service
Process Improvement The Organizational Effectiveness and Change
Management Team within DPW have developed an
agency-wide process improvement and “stat”
program. This is designed to highlight areas of
improvement across the agency, research, and draft
recommendations for change.
Daily Service
KEY PERFORMANCE INDICATORS
Key Performance Indicators measure how well an agency is achieving its Strategic Objectives. They are
outcome-oriented and should be used to answer the question, “What does the agency need to measure to
determine success?”
1. Enhance District-wide fleet management systems and services to ensure timely and cost effective
availability of vehicles while decreasing our fleet's environmental impact. (4 Measures)
Measure
New Measure/
Benchmark Year
FY 2019
Actual
FY 2020
Target
FY 2020
Actual
FY 2021
Target
FY 2022
Target
City-wide compliance rate with
preventive maintenance
appointments
No 44.2% 60% 79.2% 60% 60%
Percent of Alternative Fuel Used No New in 2021 New in 2021 New in 2021 New in 2021 15%
Percent of light vehicle
maintenance completed within 48
hours
No 60% 70% 59.8% 70% 70%
Percent of vehicles under five year
old
No 55.1% 50% 58.7% 50% 50%
2. Ensure access to parking and improve public safety for residents, businesses, and visitors through
effective enforcement of parking regulations and enhanced public information and communication
about parking and safety. (1 Measure)
Measure
New Measure/
Benchmark Year
FY 2019
Actual
FY 2020
Target
FY 2020
Actual
FY 2021
Target
FY 2022
Target
Percent of Tickets Dismissed when
Contested
No 1.8% 3% 0.2% 3% 3%

3. Launch and implement effective strategies and programs designed to reduce waste, increase impact
of recycling efforts, and support greater waste diversion. (2 Measures)
Measure
New Measure/
Benchmark Year
FY 2019
Actual
FY 2020
Target
FY 2020
Actual
FY 2021
Target
FY 2022
Target
Pounds of refuse (trash) collected
per resident served per day
No 2.2 2.5 2.3 2.5 2.5
Residential Diversion Rate (percent
of solid waste recycled, composted,
and reused)
No 25.1% 25% 25% 25% 25%
4. Provide timely, effective, and ecologically sound waste management, snow removal, street and public
space cleaning, and landscaping services to enhance cleanliness and safety for residents, businesses, and
visitors of the District of Columbia. (7 Measures)
Measure
New Measure/
Benchmark Year
FY 2019
Actual
FY 2020
Target
FY 2020
Actual
FY 2021
Target
FY 2022
Target
Percent of Alley Cleaning Service
Requests Completed within Service
Level Agreement
No 79.9% 85% 65.3% 85% 85%
Percent of Missed Recycling
Collection Households
No New in 2021 New in 2021 New in 2021 New in 2021 2%
Percent of Missed Trash Collection
Households
No New in 2021 New in 2021 New in 2021 New in 2021 2%
Percent of mowing/landscaping
routes/locations completed as
scheduled
No 94.8% 85% 90.8% 85% 85%
Percent of residential recycling
collection routes completed on
scheduled day
No 97.3% 99.8% 99.3% 99.8% 99.8%
Percent of residential trash
collection routes completed on the
scheduled day
No 97.4% 99.8% 99.7% 99.8% 99.8%
Residential Recycling
Contamination Rate
No New in 2021 New in 2021 New in 2021 New in 2021 15%
WORKLOAD MEASURES
Workload Measures, also called inputs or outputs, quantify an activity, effort or process that is necessary to
make progress towards the Strategic Objectives. They help answer the question; “How much are we doing?”
1. Management of scheduled District fleet preventative maintenance
Measure
New Measure/
Benchmark Year
FY 2018
Actual
FY 2019
Actual
FY 2020
Actual
Number of preventative maintenance
appointments completed
No New in 2021 New in 2021 New in 2021
2. Management of unscheduled District fleet repairs
Measure
New Measure/
Benchmark Year
FY 2018
Actual
FY 2019
Actual
FY 2020
Actual
Number of unscheduled fleet repairs
completed
No 20,254 22,735 22,434
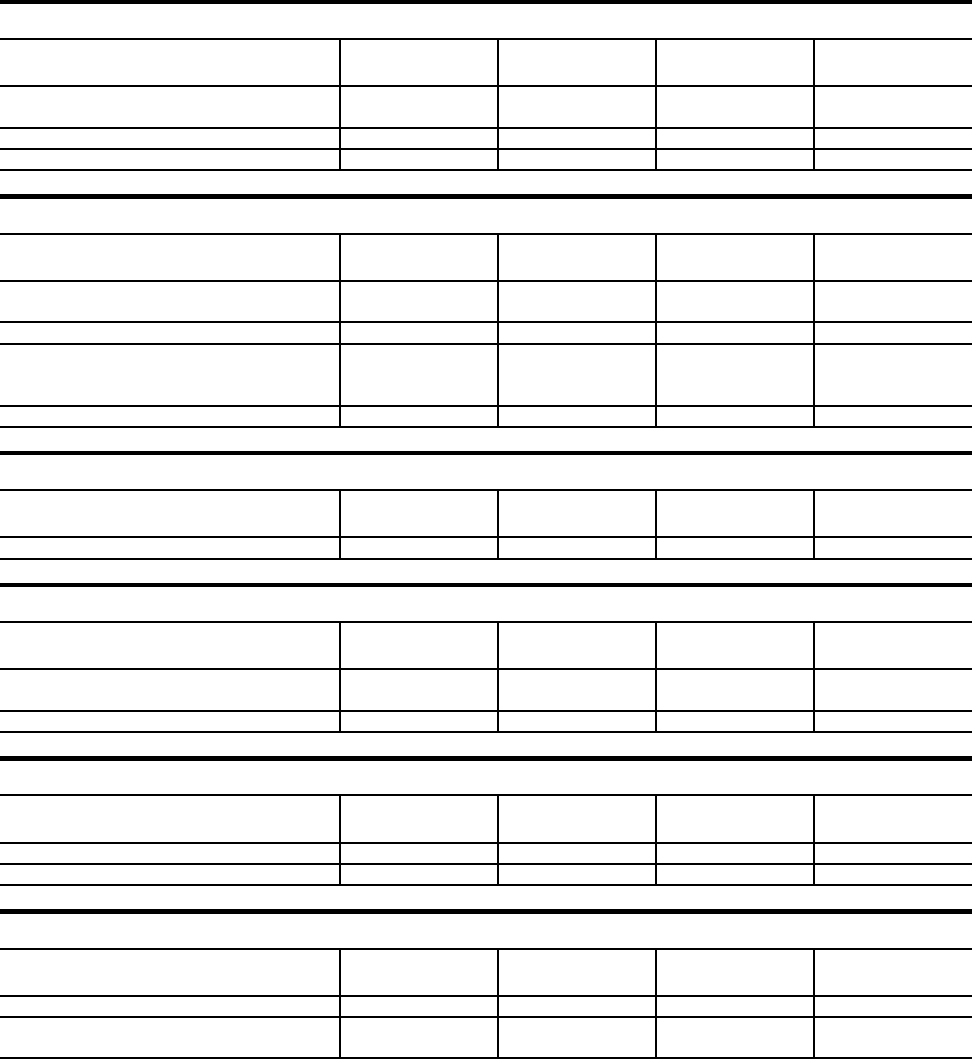
3. Towing of abandoned and junk vehicles
Measure
New Measure/
Benchmark Year
FY 2018
Actual
FY 2019
Actual
FY 2020
Actual
Number of Abandoned Vehicle Investigations
Completed
No New in 2019 7275 7465
Number of Vehicles Auctioned No New in 2019 2113 1173
Number of vehicles immobilized via booting No 4275 3793 3248
4. Parking ticket writing and enforcement
Measure
New Measure/
Benchmark Year
FY 2018
Actual
FY 2019
Actual
FY 2020
Actual
Number of Customer Service Calls Received
in Parking Enforcement Call Center
No New in 2019 105,175 92,706
Number of parking tickets issued No 1,335,896 1,347,948 793,670
Number of Residential Parking Permit (RPP)
Timings initiated by parking enforcement
officials
No New in 2019 2,014,431 1,077,649
Number of wanted vehicle alerts sent to MPD No 8890 7974 6200
5. Towing of parking violators
Measure
New Measure/
Benchmark Year
FY 2018
Actual
FY 2019
Actual
FY 2020
Actual
Number of vehicles towed No 29,215 35,805 22,021
6. Waste diversion and disposal
Measure
New Measure/
Benchmark Year
FY 2018
Actual
FY 2019
Actual
FY 2020
Actual
Number of residents dropping off waste at the
transfer stations
No New in 2019 98,428 94,317
Total Tons Processed through transfer stations No New in 2019 511,830.9 474,403.9
7. Waste and recycling collections
Measure
New Measure/
Benchmark Year
FY 2018
Actual
FY 2019
Actual
FY 2020
Actual
Tons of recycling collected No 26,762.4 26,751.2 27,735.8
Tons of refuse (trash) collected No 102,765.8 94,487 99,067.4
8. Public space cleaning
Measure
New Measure/
Benchmark Year
FY 2018
Actual
FY 2019
Actual
FY 2020
Actual
Number of Alley Cleaning Requests Received No New in 2019 4606 5812
Tons of Mechanical Street Sweeping debris
Collected
No New in 2019 10,163.3 6377.1

9. Bulk Collection
Measure
New Measure/
Benchmark Year
FY 2018
Actual
FY 2019
Actual
FY 2020
Actual
Number of bulk collection service requests No 53,902 55,723 62,865
10. Solid Waste Education and Enforcement (SWEEP)
Measure
New Measure/
Benchmark Year
FY 2018
Actual
FY 2019
Actual
FY 2020
Actual
Number of Solid Waste Enforcement warnings
issued
No New in 2019 3069 1340
Performance Plan Endnotes:
*For more information about the structure and components of FY 2022 draft performance plans, please see the FY 2022 Approved Budget and Financial Plan, Volume 1,
Appendix E.
**Key performance indicators that are new may not have historical data and may only have FY 2022 targets.
***To view the final versions of agency FY 2022 performance plans when they become available in December 2021, see the OCA website at https://oca.dc.gov/.
