
SPSS Frequency table via Custom tables
(by P. Stikker)
SPSS: Frequency table via Custom tables
In this documents instructions are shown on ow to generate a frequency table as shown below, using the Custom tables option.
These instructions are for version 23 or older. The difference with version 24 is minimum, but a separate instruction set is available for version 24 on the
companion website at http://PeterStatistics.com.
The described steps are also shown in the Youtube video at: https://youtu.be/hUW-Cv89sjA
The example file used is Holiday Fair.sav available on the companion website http://PeterStatistics.com.

SPSS Frequency table via Custom tables
(by P. Stikker)
1. Click in the menubar on
2. Click on (or in SPSS 23 on )
3. Click on
4. In SPSS version 22 you might be prompted with a
message that custom tables work best if the labels for
all values have been assigned. If you have done so,
you can simply click on OK.
In version 22 & 23 you will get a message about
measurement level if any of the variables is still set to
‘unknown’ as a measurement level. SPSS gives you a
few options but you might want to cancel in this case,
go to the Variable View and check which variables
have Measure set to unknown and change them to
the proper measurement level.
SPSS 22: Warning that it works best if all values are assigned a label.
SPSS 22 & 23: Warning (error) if measurement level of one variable is unknown.
1
2
3

SPSS Frequency table via Custom tables
(by P. Stikker)
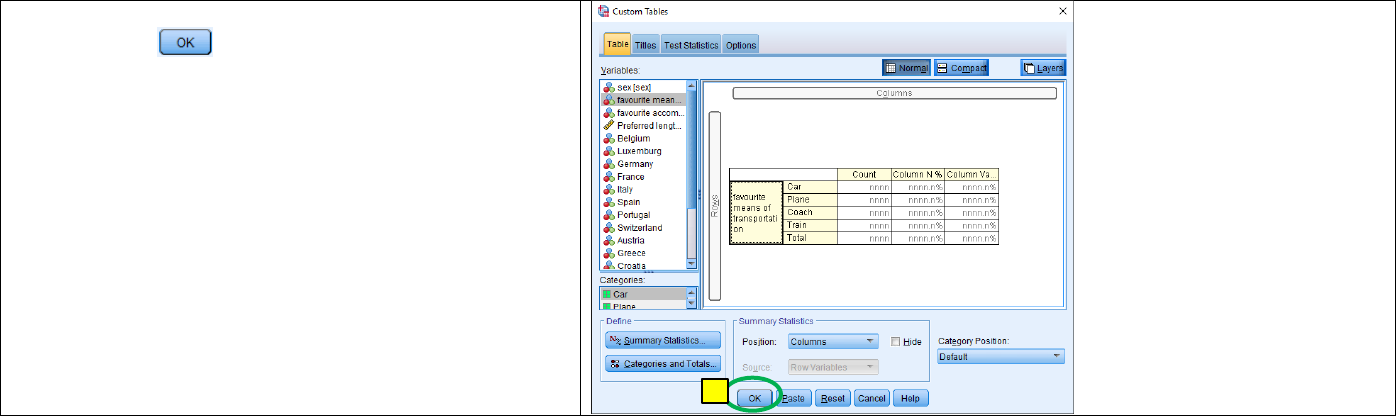
5. Click on
6. Click on
7. Drag the variable of which you want a frequency table
to the , by dragging it there.
If you want to see percentages:
8. Click on
Note: if you cannot click on the Summary Statistics, then first
click in the table on the variable name or any of the values
(the lightly yellow shaded area).
8
7
5
6

SPSS Frequency table via Custom tables
(by P. Stikker)
9. From the Statistics list select the options ‘Column N %’
and ‘Column Valid N %’ (by holding the CTRL key you
can select two items from a list)
10. Click on to move them to the Display section
11. Click on
9
9
10
11

SPSS Frequency table via Custom tables
(by P. Stikker)
If you want the totals to be shown as well:
12. Click on
Note: if you cannot click on the Categories and Totals, then
first click in the table on the variable name or any of the
values (the lightly yellow shaded area).
13. At the Show section tick the option.
14. Click on
12
13
14
SPSS Frequency table via Custom tables
(by P. Stikker)
15. Click on
If you double-click on the table, you can remove columns, rows or cells, change the number of decimals shown, highlight some numbers etc.
15
