
Paragon Insights User Guide
Published
2024-08-21
RELEASE
4.3.0

Juniper Networks, Inc.
1133 Innovaon Way
Sunnyvale, California 94089
USA
408-745-2000
www.juniper.net
Juniper Networks, the Juniper Networks logo, Juniper, and Junos are registered trademarks of Juniper Networks, Inc.
in the United States and other countries. All other trademarks, service marks, registered marks, or registered service
marks are the property of their respecve owners.
Juniper Networks assumes no responsibility for any inaccuracies in this document. Juniper Networks reserves the right
to change, modify, transfer, or otherwise revise this publicaon without noce.
Paragon Insights User Guide
4.3.0
Copyright © 2024 Juniper Networks, Inc. All rights reserved.
The informaon in this document is current as of the date on the tle page.
YEAR 2000 NOTICE
Juniper Networks hardware and soware products are Year 2000 compliant. Junos OS has no known me-related
limitaons through the year 2038. However, the NTP applicaon is known to have some diculty in the year 2036.
END USER LICENSE AGREEMENT
The Juniper Networks product that is the subject of this technical documentaon consists of (or is intended for use
with) Juniper Networks soware. Use of such soware is subject to the terms and condions of the End User License
Agreement ("EULA") posted at hps://support.juniper.net/support/eula/. By downloading, installing or using such
soware, you agree to the terms and condions of that EULA.
ii

Table of Contents
About This Guide | viii
1
Introducon to Paragon Insights
Paragon Insights Overview | 2
Paragon Insights Concepts | 6
Paragon Insights Data Collecon Methods | 7
Paragon Insights Topics | 9
Paragon Insights Rules - Basics | 10
Paragon Insights Rules - Deep Dive | 12
Paragon Insights Playbooks | 31
Paragon Insights Tagging | 33
Overview | 33
Types of Tagging | 40
Add a Tagging Prole | 48
Apply a Tagging Prole | 53
Delete a Tagging Prole | 55
Paragon Insights Time Series Database (TSDB) | 57
Paragon Insights Machine Learning (ML) | 65
Paragon Insights Machine Learning Overview | 65
Understanding Paragon Insights Anomaly Detecon | 66
Understanding Paragon Insights Outlier Detecon | 68
Understanding Paragon Insights Predict | 72
Paragon Insights Rule Examples | 73
Frequency Proles and Oset Time | 87
Frequency Proles | 87
iii

Oset Time Unit | 94
2
Paragon Insights Management and Monitoring
Manage Paragon Insights Users and Groups | 107
Manage Devices, Device Groups, and Network Groups | 121
Adding a Device | 122
Eding a Device | 129
Adding a Device Group | 129
Eding a Device Group | 136
Conguring a Retenon Policy for the Time Series Database | 136
Adding a Network Group | 137
Eding a Network Group | 140
Paragon Insights Rules and Playbooks | 141
Add a Pre-Dened Rule | 141
Create a New Rule Using the Paragon Insights GUI | 142
Edit a Rule | 159
Add a Pre-Dened Playbook | 159
Create a New Playbook Using the Paragon Insights GUI | 160
Edit a Playbook | 161
Clone a Playbook | 162
Manage Playbook Instances | 163
Monitor Device and Network Health | 172
Dashboard | 172
Health | 183
Network Health | 192
Graphs Page | 192
Understand Resources and Dependencies | 206
iv

About the Resources Page | 209
Add Resources for Root Cause Analysis | 212
Congure Dependency in Resources | 215
Example Conguraon: OSPF Resource and Dependency | 221
Edit Resources and Dependencies | 232
Edit a Resource | 232
Edit Resource Dependency | 233
Filter Resources | 234
Upload Resources | 235
Download Resources | 236
Clone Resources | 236
Delete Resources and Dependencies | 237
Delete a Resource | 238
Delete Resource Dependency | 239
Monitor Network Device Health Using Grafana | 239
Grafana Overview | 239
Access the Grafana UI | 240
Run a Query | 240
View Prepopulated Graphs | 242
Back Up and Restore Grafana Data | 243
Understanding Acon Engine Workows | 244
Manage Acon Engine Workows | 244
Alerts and Nocaons | 252
Generate Alert Nocaons | 252
Congure a Nocaon Prole | 253
Enable Alert Nocaons for a Device Group or Network Group | 259
v

Manage Alerts Using Alert Manager | 260
Viewing Alerts | 260
Manage Individual Alerts | 262
Congure Alert Blackouts | 263
Stream Sensor and Field Data from Paragon Insights | 264
Congure the Nocaon Type for Publishing | 264
Publish Data for a Device Group or Network Group | 267
Generate Reports | 268
Use Exim4 for E-Mails | 282
Congure the Exim4 Agent to Send E-mail | 283
Manage Audit Logs | 284
Filter Audit Logs | 284
Export Audit Logs | 285
Paragon Insights Commands and Audit Logs | 286
Congure a Secure Data Connecon for Paragon Insights Devices | 286
Congure Data Summarizaon | 290
Modify the UDA, UDF, and Workow Engines | 299
Commit or Roll Back Conguraon Changes in Paragon Insights | 307
Logs for Paragon Insights Services | 309
Troubleshoong | 312
Paragon Insights Conguraon – Backup and Restore | 321
Back Up the Conguraon | 322
Restore the Conguraon | 322
Backup or Restore the Time Series Database (TSDB) | 323
3
License Management
Paragon Insights Licensing Overview | 326
View, Add, or Delete Paragon Insights Licenses | 326
vi

About This Guide
Use this guide to understand the features you can congure and the tasks you can perform from the
Paragon Insights (formerly HealthBot) GUI.
viii


Paragon Insights Overview
IN THIS SECTION
Main Components of Paragon Insights | 2
Closed-Loop Automaon | 4
Benets of Paragon Insights | 6
Paragon Insights (formerly HealthBot) is a highly automated and programmable device-level
diagnoscs
and network analycs tool that provides consistent and coherent operaonal intelligence across
network deployments. Paragon Insights integrates mulple data collecon methods (such as Junos
Telemetry Interface (JTI), NETCONF, syslog, and SNMP) to aggregate and correlate large volumes of
me-sensive telemetry data, thereby providing a muldimensional and predicve view of the network.
Addionally, Paragon Insights translates troubleshoong, maintenance, and real-me analycs into an
intuive user experience to give network operators aconable insights into the health of individual
devices and of the overall network.
Main Components of Paragon Insights
Paragon Insights consists of two main components:
• Health Monitoring, to view an abstracted, hierarchical representaon of device and network-level
health, and dene the health parameters of key network elements through customizable key
performance indicators (KPIs), rules, and playbooks. A playbook is a collecon of rules. You can
create a playbook and apply the playbook to a device group or a network group. For more
informaon on rules and playbooks, see "Paragon Insights Rules and Playbooks" on page 141.
• Root Cause Analysis, which helps you nd the root cause of a device or network-level issue when
Paragon Insights detects a problem with a network element.
Paragon Insights Health Monitoring
The Challenge
2
With increasing data trac generated by cloud-nave applicaons and emerging technologies, service
providers and enterprises need a network analycs soluon to analyze volumes of telemetry data, oer
insights into overall network health, and produce aconable intelligence. While although telemetry-
based techniques have existed for years, the growing number of protocols, data formats, and KPIs from
diverse networking devices has made data analysis complex and costly. Tradional CLI-based interfaces
require specialized skills to extract business value from telemetry data, creang a barrier to entry for
network analycs
How Paragon Insights Health Monitoring Helps
By aggregang and correlang raw telemetry data from mulple sources, the Paragon Insights Health
Monitoring component provides a muldimensional view of network health that reports current status,
as well as projected threats to the network infrastructure and its workloads.
Health status determinaon is ghtly integrated with the Paragon Insights RCA component, which can
make use of system log data received from the network and its devices. Paragon Insights Health
Monitoring provides status indicators that alert you when a network resource is currently operang
outside a user-dened performance policy. Paragon Insights Health Monitoring does a risk analysis using
historical trends and predicts whether a resource may be unhealthy in the future. Paragon Insights
Health Monitoring not only oers a fully customizable view of the current health of network elements,
but also automacally iniates remedial acons based on predened service level agreements (SLAs).
Dening the health of a network element, such as broadband network gateway (BNG), provider edge
(PE), core, and leaf-spine, is highly contextual. Each element plays a dierent role in a network, with
unique KPIs to monitor. Given that there is no single denion for network health across all use cases,
Paragon Insights provides a highly customizable framework to allow you to dene your own health
proles.
Paragon Insights Root Cause Analysis
The Challenge
For some network issues, it can be challenging for network operators to gure out what caused a
networking device to stop working properly. In such cases, an operator must call on a specialist (with
knowledge built from years of experience) to troubleshoot the problem and nd the root cause.
How Paragon Insights RCA Helps
The Paragon Insights RCA component simplies the process of nding the root cause of a network issue.
Paragon Insights’s RCA captures the troubleshoong knowledge of specialists and has a knowledge base
in the form of Paragon Insights rules. These rules are evaluated either on demand by a specic trigger or
periodically in the background to ascertain the health of a networking component, such as roung
protocol, system, interface, or chassis, on the device.
To illustrate the benets of Paragon Insights RCA, let us consider the problem of OSPF apping. Figure 1
on page 4 highlights the workow sequence involved in debugging OSPF apping. A network
3

operator troubleshoong this issue would need to perform manual debugging steps for each le (step)
of the workow sequence in order to nd the root cause of the OSPF apping. On the other hand,
theParagon Insights RCA applicaon troubleshoots the issue automacally by using an RCA bot. The
RCA bot tracks all of the telemetry data collected by the Paragon Insights and translates the informaon
into graphical status indicators (displayed in the Paragon Insights web GUI) that correlate to dierent
parts of the workow sequence shown in Figure 1 on page 4.
Figure 1: High-level workow to debug OSPF-apping
When you congure Paragon Insights, each le of the workow sequence (shown in Figure 1 on page 4)
can be dened by one or more rules. For example, the RPD-OSPF le could be dened as two rule
condions: one to check if "hello-transmied" counters are incremenng and the other to check if
"hello-received" counters are incremenng. Based on these user-dened rules, Paragon Insights provides
status indicators, alarm nocaons, and an alarm management tool to inform and alert you of specic
network condions that could lead to OSPF apping.
By isolang a problem area in the workow, Paragon Insights RCA proacvely guides you in determining
the appropriate correcve acon to take to x a pending issue or avoid a potenal one.
Closed-Loop Automaon
Paragon Insights oers closed-loop automaon. The automaon workow can be divided into seven
main steps (see Figure 2 on page 5):
1. Dene—The user denes the health parameters of key network elements through customizable key
performance indicators (KPIs), rules, and playbooks, by using the tools provided by Paragon Insights.
4

2. Collect—Paragon Insights collects rule-based telemetry data from mulple devices using the
collecon methods specied for the dierent network devices.
3. Store—Paragon Insights stores me-sensive telemetry data in a me-series database (TSDB). This
allows users to query, perform operaons on, and write new data back to the database, days, or even
weeks aer the inial storage.
4. Analyze—Paragon Insights analyzes telemetry data based on the specied KPIs, rules, and playbooks.
5. Visualize—Paragon Insights provides mulple ways for you to visualize the aggregated telemetry data
through its web-based GUI to gain aconable and predicve insights into the health of your devices
and the overall network.
6. Nofy—Paragon Insights noes you through the GUI and nocaon alarms when problems in
individual devices or in the network are detected.
7.
Act Paragon Insights performs user-dened acons to help resolve and proacvely prevent
network problems.
Figure 2: Paragon Insights Closed-Loop Automaon Workow
5

Benets of Paragon Insights
• Customizaon—Provides a framework to dene and customize health proles, allowing truly
aconable insights for the specic device or network being monitored.
• Automaon—Automates root cause analysis and log le analysis, streamlines diagnosc workows,
and provides self-healing and remediaon capabilies.
• Greater network visibility—Provides advanced muldimensional analycs across network elements,
giving you a clearer understanding of network behavior to establish operaonal benchmarks, improve
resource planning, and minimize service downme.
• Intuive GUI—Oers an intuive web-based GUI for policy management and easy data consumpon.
• Open integraon—Lowers the barrier of entry for telemetry and analycs by providing open source
data pipelines, nocaon capabilies, and third-party device support.
• Mulple data collecon methods—Includes support for JTI, OpenCong, NETCONF, CLI, Syslog,
NetFlow, and SNMP.
RELATED DOCUMENTATION
Paragon Insights Geng Started Guide
Paragon Insights Concepts
IN THIS SECTION
Paragon Insights Data Collecon Methods | 7
Paragon Insights Topics | 9
Paragon Insights Rules - Basics | 10
Paragon Insights Rules - Deep Dive | 12
Paragon Insights Playbooks | 31
6

Paragon Insights (formerly HealthBot) is a highly programmable telemetry-based analycs applicaon.
With it, you can diagnose and root cause network issues, detect network anomalies, predict potenal
network issues, and create real-me remedies for any issues that come up.
To accomplish this, network devices and Paragon Insights have to be congured to send and receive
large amounts of data, respecvely. Device conguraon is covered throughout this and other secons
of the guide.
Conguring Paragon Insights, or any applicaon, to read and react to incoming telemetry data requires a
language that describes several elements that are specic to the systems and data under analysis. This
type of language is called a Domain Specic Language (DSL), i.e., a language that is specic to one
domain. Any DSL is built to help answer quesons. For Paragon Insights, these quesons are:
• Q: What components make up the systems that are sending data?
A: Network devices are made up of memory, cpu, interfaces, protocols and so on. In Paragon Insights,
these are called "Paragon Insights Topics" on page 9.
• Q: How do we gather, lter, process, and analyze all of this incoming telemetry data?
A: Paragon Insights uses "Paragon Insights Rules - Basics" on page 10 that consist of informaon
blocks called sensors, elds, variables, triggers, and more.
• Q: How do we determine what to look for?
A: It depends on the problem you want to solve or the queson you want to answer. Paragon
Insights uses "Paragon Insights Playbooks" on page 31 to create collecons of specic rules and
apply them to specic groups of devices in order accomplish specic goals. For example, part of the
system-kpis-playbook can alert a user when system memory usage crosses a user-dened threshold.
This secon covers these key concepts and more, which you need to understand before using Paragon
Insights.
Paragon Insights Data Collecon Methods
IN THIS SECTION
Data Collecon - ’Push’ Model | 8
Data Collecon - ’Pull’ Model | 8
7
In order to provide visibility into the state of your network devices, Paragon Insights rst needs to
collect their telemetry data and other status informaon. It does this using sensors.
Paragon Insights supports sensors that “push” data from the device to Paragon Insights and sensors that
require Paragon Insights to “pull” data from the device using periodic polling.
Data Collecon - ’Push’ Model
As the number of objects in the network, and the metrics they generate, have grown, gathering
operaonal stascs for monitoring the health of a network has become an ever-increasing challenge.
Tradional ’pull’ data-gathering models, like SNMP and the CLI, require addional processing to
periodically poll the network element, and can directly limit scaling.
The ’push’ model overcomes these limits by delivering data asynchronously, which eliminates polling.
With this model, the Paragon Insights server can make a single request to a network device to stream
periodic updates. As a result, the ’push’ model is highly scalable and can support the monitoring of
thousands of objects in a network. Junos devices support this model in the form of the Junos Telemetry
Interface (JTI).
Paragon Insights currently supports ve ‘push’ ingest types.
• Nave GPB
• NetFlow
• sFlow
• OpenCong
• Syslog
These push-model data collecon—or
ingest
—methods are explained in detail in the Paragon Insights
Data Ingest Guide.
Data Collecon - ’Pull’ Model
While the ’push’ model is the preferred approach for its eciency and scalability, there are sll cases
where the ’pull’ data collecon model is appropriate. With the ’pull’ model, Paragon Insights requests
data from network devices at periodic intervals.
Paragon Insights currently supports two ‘pull’ ingest types.
• iAgent (CLI/NETCONF)
• SNMP
8

These pull-model data collecon—or
ingest
—methods are explained in detail in the Paragon Insights
Data Ingest Guide.
Paragon Insights Topics
Network devices are made up of a number of components and systems from CPUs and memory to
interfaces and protocol stacks and more. In Paragon Insights, a topic is the construct used to address
those dierent device components. The Topic block is used to create name spaces that dene what
needs to be modeled. Each Topic block is made up of one or more Rule blocks which, in turn, consist of
the Field blocks, Funcon blocks, Trigger blocks, etc. See "Paragon Insights Rules - Deep Dive" on page
12 for details. Each rule created in Paragon Insights must be part of a topic. Juniper has curated a
number of these system components into a list of Topics such as:
• chassis
• class-of-service
• external
• rewall
• interfaces
• kernel
• linecard
• logical-systems
• protocol
• roung-opons
• security
• service
• system
You can create sub-topics underneath any of the Juniper topic names by appending
.<sub-topic>
to the
topic name. For example, kernel.tcpip or system.cpu.
Any pre-dened rules provided by Juniper t within one of the Juniper topics with the excepon of
external
, The
external
topic is reserved for user-created rules. In the Paragon Insights web GUI, when
you create a new rule, the Topics eld is automacally populated with the
external
topic name.
9

Paragon Insights Rules - Basics
Paragon Insights’ primary funcon is collecng and reacng to telemetry data from network devices.
Dening how to collect the data, and how to react to it, is the role of a
rule
.
Paragon Insights ships with a set of default rules, which can be seen on the Conguraon > Rules page
of the Paragon Insights GUI, as well as in GitHub in the healthbot-rules repository. You can also create
your own rules.
The structure of a Paragon Insights rule looks like this:
To keep rules organized, Paragon Insights organizes them into
topics
. Topics can be very general, like
system, or they can be more granular, like protocol.bgp. Each topic contains one or more rules.
As described above, a
rule
contains all the details and instrucons to dene how to collect and handle
the data. Each rule contains the following required elements:
• The
sensor
denes the parameters for collecng the data. This typically includes which data
collecon method to use (as discussed above in "Paragon Insights Data Collecon Methods" on page
7), some guidance on which data to ingest, and how oen to push or pull the data. In any given rule,
a sensor can be dened directly within the rule or it can be referenced from another rule.
• Example: Using the SNMP sensor, poll the network device every 60 seconds to collect all the
device data in the Juniper SNMP MIB table jnxOperangTable.
• The sensor typically ingests a large set of data, so
elds
provide a way to lter or manipulate that
data, allowing you to idenfy and isolate the specic pieces of informaon you care about. Fields can
also act as placeholder values, like a stac threshold value, to help the system perform data analysis.
10

• Example: Extract, isolate, and store the jnxOperang15MinLoadAvg (CPU 15-minute average
ulizaon) value from the SNMP table specied above in the sensor.
•
Triggers
periodically bring together the elds with other elements to compare data and determine
current device status. A trigger includes one or more ’when-then’ statements, which include the
parameters that dene how device status is visualized on the health pages.
• Example: Every 90 seconds, check the CPU 15min average ulizaon value, and if it goes above a
dened threshold, set the device’s status to red on the device health page and display a message
showing the current value.
The rule can also contain the following oponal elements:
•
Vectors
allow you to leverage exisng elements to avoid the need to repeatedly congure the same
elements across mulple rules.
• Examples: A rule with a congured sensor, plus a vector to a second sensor from another rule; a
rule with no sensors, and vectors to elds from other rules
•
Variables
can be used to provide addional supporng parameters needed by the required elements
above.
• Examples: The string “ge-0/0/0”, used within a eld collecng status for all interfaces, to lter the
data down to just the one interface; an integer, such as “80”, referenced in a eld to use as a stac
threshold value
•
Funcons
allow you to provide instrucons (in the form of a Python script) on how to further interact
with data, and how to react to certain events.
• Examples: A rule that monitors input and output packet counts, using a funcon to compare the
count values; a rule that monitors system storage, invoking a funcon to cleanup temp and log
les if storage ulizaon goes above a dened threshold
NOTE: Rules, on their own, don’t actually do anything. To make use of rules you need to add
them to "Paragon Insights Playbooks" on page 31.
11

Paragon Insights Rules - Deep Dive
IN THIS SECTION
Rules | 13
Sensors | 16
Fields | 16
Vectors | 18
Variables | 19
Funcons | 19
Triggers | 20
Tagging | 24
Rule Properes | 24
Pre/Post Acon | 24
Mulple Sensors per Device | 25
Sensor Precedence | 28
A rule is a package of components, or blocks, needed to extract specic informaon from the network
or from a Junos device. Rules conform to a specically tailored domain specic language (DSL) for
analycs applicaons. The DSL is designed to allow rules to capture:
• The minimum set of input data that the rule needs to be able to operate
• The minimum set of telemetry sensors that need to be congured on the device(s)
• The elds of interest from the congured sensors
• The reporng or polling frequency
• The set of triggers that operate on the collected data
• The condions or evaluaons needed for triggers to kick in
• The acons or nocaons that need to be performed when a trigger kicks in
The details around rules, topics and playbooks are presented in the following secons.
12

Rules
Rules are meant to be free of any hard coding. Think of threshold values; If a threshold is hard coded,
there is no easy way to customize it for a dierent customer or device that has dierent requirements.
Therefore, rules are dened using parameterizaon to set the default values. This allows the parameters
to be le at default or be customized by the operator at the me of deployment. Customizaon can be
done at the device group or individual device level while applying the "Paragon Insights Playbooks" on
page 31 in which the individual rules are contained.
Rules that are device-centric are called device rules. Device components such as chassis, system,
linecards, and interfaces are all addressed as "Paragon Insights Topics" on page 9 in the rule denion.
Generally, device rules make use of sensors on the devices.
Rules that span mulple devices are called network rules. Network rules:
• must have a rule-frequency congured
• must not contain sensors
• cannot be mixed with device rules in a playbook
To deploy either type of rule, include the rule in a playbook and then apply the playbook to a device
group or network group.
NOTE: Paragon Insights comes with a set of pre-dened rules.
Not all of the blocks that make up a rule are required for every rule. Whether or not a specic block is
required in a rule denion depends on what sort of informaon you are trying to get to. Addionally,
some rule components are not valid for network rules. Table 1 on page 14 lists the components of a
rule and provides a brief descripon of each one.
13

Table 1: Rule Components
Block What it Does Required in Device
Rules?
Valid for
Network
Rules?
"Sensors" on
page 16
The Sensors block is like the access method for geng
at the data. There are mulple types of sensors
available in Paragon Insights: OpenCong, Nave GPB,
iAgent, SNMP, and syslog.
It denes what sensors need to be acve on the device
in order to get to the data elds on which the triggers
eventually operate. Sensor names are referenced by the
Fields.
OpenCong and iAgent sensors require that a
frequency be set for push interval or polling interval
respecvely. SNMP sensors also require you to set a
frequency.
No–Rules can be
created that only
use a eld reference
from another rule or
a vector with
references from
another rule. In
these cases, rule-
frequency must be
explicitly dened.
No
"Fields" on page
16
The source for the Fields block can be a pointer to a
sensor, a reference to a eld dened in another rule, a
constant, or a formula. The eld can be a string, integer
or oang point. The default eld type is string.
Yes-Fields contain
the data on which
the triggers operate.
Starng in HealthBot
Release 3.1.0,
regular elds and
key-elds can be
added to rules based
on condional
tagging proles. See
the "Tagging" on
page 24 secon
below.
Yes
"Vectors" on
page 18
The Vectors block allows handling of lists, creang sets,
and comparing elements amongst dierent sets. A
vector is used to hold mulple values from one or more
elds.
No Yes
14

Table 1: Rule Components
(Connued)
Block What it Does Required in Device
Rules?
Valid for
Network
Rules?
"Variables" on
page 19
The Variables block allows you to pass values into rules.
Invariant rule denions are achieved through
mustache-style templang like {{<placeholder-
variable> }}. The placeholder-variable value is set in the
rule by default or can be user-dened at deployment
me.
No No
"Funcons" on
page 19
The Funcons block allows you to extend elds,
triggers, and acons by creang prototype methods in
external les wrien in languages like python. The
funcons block includes details on the le path, method
to be accessed, and any arguments, including argument
descripon and whether it is mandatory.
No No
"Triggers" on
page 20
The Triggers block operates on elds and are dened by
one or more
Terms
. When the condions of a Term are
met, then the acon dened in the Term is taken.
By default, triggers are evaluated every 10 seconds,
unless explicitly congured for a dierent frequency.
By default, all triggers dened in a rule are evaluated in
parallel.
Yes–Triggers enable
rules to take acon.
Yes
"Rule
Properes" on
page 24
The Rule Properes block allows you to specify
metadata for a Paragon Insights rule, such as hardware
dependencies, soware dependencies, and version
history.
No Yes
"Pre/Post
Acon" on page
24
The Pre/Post Acon block allows you to automate
Acon Engine Workows when you add them in rule
conguraons. Paragon Insights executes the pre-acon
tasks at the start of playbook instanaon and the
post-acon tasks aer you stop playbook instances.
No Yes
15
Sensors
When dening a sensor, you must specify informaon such as sensor name, sensor type and data
collecon frequency. As menoned in Table 1 on page 14, sensors can be one of the following:
•
OpenCong For informaon on OpenCong JTI sensors, see the Junos Telemetry Interface User
Guide.
•
Nave GPB For informaon on Nave GPB JTI sensors, see the Junos Telemetry Interface User
Guide.
•
iAgent The iAgent sensors use NETCONF and YAML-based PyEZ tables and views to fetch the
necessary data. Both structured (XML) and unstructured (VTY commands and CLI output)
data are supported. For informaon on Junos PyEZ, see the Junos PyEz Documentaon.
•
SNMP Simple Network Management Protocol.
•
syslog
system log
•
BYOI
Bring your own ingest – Allows you to dene your own ingest types.
•
Flow
NetFlow trac ow analysis protocol
•
sFlow
sFlow packet sampling protocol
When dierent rules have the same sensor dened, only one subscripon is made per sensor. A key,
consisng of
sensor-path
for OpenCong and Nave GPB sensors, and the tuple of
le
and
table
for
iAgent sensors is used to idenfy the associated rule.
When mulple sensors with the same
sensor-path
key have dierent frequencies dened, the lowest
frequency is chosen for the sensor subscripon.
Fields
There are four types of eld sources, as listed in Table 1 on page 14. Table 2 on page 17 describes the
four eld ingest types in more detail.
16

Table 2: Field Ingest Type Details
Field Type Details
Sensor Subscribing to a sensor typically provides access to mulple columns of data. For instance,
subscribing to the OpenCong interface sensor provides access to a bunch of informaon
including counter related informaon such as:
/interfaces/counters/tx-bytes,
/interfaces/counters/rx-bytes,
/interfaces/counters/tx-packets,
/interfaces/counters/rx-packets,
/interfaces/counters/oper-state, etc.
Given the rather long names of paths in OpenCong sensors, the Sensor denion within
Fields allows for aliasing, and ltering. For single-sensor rules, the required set of Sensors for
the Fields table are programmacally auto-imported from the raw table based on the triggers
dened in the rule.
Reference Triggers can only operate on Fields dened within that rule. In some cases, a Field might
need to reference another Field or Trigger output dened in another Rule. This is achieved by
referencing the other eld or trigger and applying addional lters. The referenced eld or
trigger is treated as a stream nocaon to the referencing eld. References aren’t
supported within the same rule.
References can also take a me-range opon which picks the value, if available, from the
me-range provided. Field references must always be unambiguous, so proper aenon
must be given to ltering the result to get just one value. If a reference receives mulple data
points, or values, only the latest one is used. For example, if you are referencing a the values
contained in a eld over the last 3 minutes, you might end up with 6 values in that eld over
that me-range. Paragon Insights only uses the latest value in a situaon like this.
Constant A eld dened as a constant is a xed value which cannot be altered during the course of
execuon. Paragon Insights Constant types can be strings, integers, and doubles.
17

Table 2: Field Ingest Type Details
(Connued)
Field Type Details
Formula Raw sensor elds are the starng point for dening triggers. However, Triggers oen work
on derived elds dened through formulas by applying mathemacal transformaons.
Formulas can be pre-dened or user-dened (UDF). Pre-dened formulas include: Min, Max,
Mean, Sum, Count, Rate of Change, Elapsed Time, Eval, Standard Deviaon, Microburst,
Dynamic Threshold, Anomaly Detecon, Outlier Detecon, and Predict.
Rate of Change refers to the dierence between current and previous values over their
points of me. Packet transfer is an example use case where the Rate of Change formula can
be used. The Hold Time eld takes a threshold of me interval. The me interval between
current and previous values cannot exceed the specied Hold Time value. The Mulplicaon
Factor eld is used to convert the unit of the eld value. If the eld value is calculated in
Bytes, specifying 1024 as Mulplicaon Factor would convert the result into Kilobytes. Hold
Time and Mulplicaon Factor are not mandatory elds when you apply Rate of Change
formula.
In Paragon Insights 4.0.0, you can get the current point me in Elapsed Time formula by
using $me.
Some pre-dened formulas can operate on me ranges in order to work with historical data.
If a me range is not specied, then the formula works on current data, specied as
now.
Vectors
Vectors are useful in helping to gather mulple elements into a single rule. For example, using a vector
you could gather all of the interface error elds. The syntax for Vector is:
vector <vector-name>{
path [$field-1 $field-2 .. $field-n];
filter <list of specific element(s) to filter out from vector>;
append <list of specific element(s) to be added to vector>;
}
$eld-n can be eld of type reference.
The elds used in dening vectors can be direct references to elds dened in other rules:
vector <vector-name>{
path [/device-group[device-group-name=<device-group>]\
18

/device[device-name=<device>]/topic[topic-name=<topic>]\
/rule[rule-name=<rule>]/field[<field-name>=<field-value>\
AND|OR ...]/<field-name> ...];
filter <list of specific element(s) to filter out from vector>;
append <list of specific element(s) to be added to vector>;
}
This syntax allows for oponal ltering through the <eld-name>=<eld-value> poron of the
construct. Vectors can also take a me-range opon that picks the values from the me-range provided.
When mulple values are returned over the given me-range, they are all selected as an array.
The following pre-dened formulas are supported on vectors:
• unique @vector1–Returns the unique set of elements from vector1
• @vector1 and @vector2–Returns the intersecon of unique elements in vector1 and vector2.
• @vector1 or @vector2–Returns the total set of unique elements in the two vectors.
• @vector1 unless @vector2–Returns the unique set of elements in vector-1, but not in vector-2
Variables
Variables are dened during rule creaon on the Variables page. This part of variable denion creates
the default value that gets used if no specic value is set in the device group or on the device during
deployment. For example, the check-interface-status rule has one variable called interface_name. The value
set on the Variables page is a regular expression (regex), .*, that means all interfaces.
If applied as-is, the check-interface-status rule would provide interface status informaon about all the
interfaces on all of the devices in the device group. While applying a playbook that contains this rule,
you could override the default value at the device group or device level. This allows you exibility when
applying rules. The order of precedence is device value overrides device group value and device group
value overrides the default value set in the rule.
BEST PRACTICE: It is highly recommended to supply default values for variables dened in
device rules. All Juniper-supplied rules follow this recommendaon. Default values must not
be set for variables dened in network rules.
Funcons
Funcons are dened during rule creaon on the Funcons tab. Dening a funcon here allows it to be
used in Formulas associated with Fields and in the When and Then secons of Triggers. Funcons used
19

in the when clause of a trigger are known as user-dened funcons. These must return true or false.
Funcons used in the then clause of a trigger are known as user-dened acons.
Triggers
Triggers play a pivotal role in Paragon Insights rule denions. They are the part of the rule that
determines if and when any acon is taken based on changes in available sensor data. Triggers are
constructed in a when-this, then-that manner. As menoned earlier, trigger acons are based on Terms.
A Term is built with
when
clauses that watch for updates in eld values and
then
clauses that iniate
some acon based on what changed. Mulple Terms can be created within a single trigger.
Evaluaon of the
when
clauses in the Terms starts at the top of the list of terms and proceeds to the
boom. If a
term
is evaluated and no match is made, then the next
term
is evaluated. By default,
evaluaon proceeds in this manner unl either a match is made or the boom of the list is reached
without a match.
Pre-dened operators that can be used in the
when
clause include:
NOTE: For evaluated equaons, the le-hand side and right-hand side of the equaon are
shortened to LHS and RHS, respecvely in this document.
•
greater-than
–Used for checking if one value is greater than another.
• Returns: True or False
• Syntax: greater-than <LHS> <RHS> [me-range <range>]
• Example: //Memory > 3000 MB in the last 5 minutes
when greater-than $memory 3000 time-range 5m;
•
greater-than-or-equal-to
–Same as
greater-than
but checks for greater than or equal to (>=)
•
less-than
• Returns: True or False
• Syntax: less-than <LHS> <RHS> [me-range <range>]
•
Example: //Memory < 6000 MB in the last 5 minutes
when less-than $memory 6000 time-range 5m;
•
less-than-or-equal-to
–Same as
less-than
but checks for less than or equal to (<=)
•
equal-to
–Used for checking that one value is equal to another value.
20

• Returns: True or False
• Syntax: equal-to <LHS> <RHS> [me-range <range>]
• Example: //Queue’s buffer utilization % == 0
when equal-to $buffer-utilization 0;
•
not-equal-to
–Same as
equal-to
but checks for negave condion (!=)
•
exists
–Used to check if some value exists without caring about the value itself. Meaning that some
value should have been sent from the device.
• Returns: True or False
• Syntax: exists <$var> [me-range <range>]
• Example: //Has the device configuration changed?
when exists $netconf-data-change
•
matches-with (for strings & regex)
–Used to check for matches on strings using Python regex
operaons. See Syntax for more informaon.
NOTE: LHS, or le hand side, is the string in which we are searching; RHS, or right hand side,
is the match expression. Regular expressions can only be used in RHS.
• Returns: True or False
• Syntax: matches-with <LHS> <RHS> [me-range <range>]
• Example: //Checks that ospf-neighbor-state has been UP for the past 10 minutes
when matches-with $ospf-neighbor-state “^UP$” time-range 10m;
Example 1: escape backslash '\’ with one more backslash '\’
escape \ with one more \
Expression: ^\\S+-\\d+/\\d+/\\d+$
Values that will match:
xe-1/0/0
et-1/0/1
fe-2/0/0
Values that will not match:
21

xe-1/0/0.1
fxp0
Example 2: escape \ with one more \
Expression: \\(\\S+\\)\\s\\(\\S+\\)
Values that will match:
(root) (mgd)
(user1) (ssh)
Values that will not match:
root mgd
(root) mgd
•
does-not-match-with (for strings & regex)
–Same as
matches-with
but checks for negave condion
•
range
–Checks whether a value, X, falls within a given range such as minimum and maximum (min <=
X <= max)
• Returns: True or False
• Syntax: range <$var> min <minimum value> max <maximum value> [me-range <range>]
• Example: //Checks whether memory usage has been between 3000 MB and 6000 MB in the last 5 minutes
when range $mem min 3000 max 6000 time-range 5m;
•
increasing-at-least-by-value
–Used to check whether values are increasing by at least the minimum
acceptable rate compared to the previous value. An oponal parameter that denes the minimum
acceptable rate of increase can be provided. The minimum acceptable rate of increase defaults to 1 if
not specied.
• Returns: True or False
• Syntax:
increasing-at-least-by-value <$var> [increment <minimum value of increase between successive
points>]
increasing-at-least-by-value <$var> [increment <minimum value of increase between successive
points>] me-range <range>
•
Example: Checks that the ospf-tx-hello has been increasing steadily over the past 5 minutes.
when increasing-at-least-by-value $ospf-tx-hello increment 10 time-range 5m;
22
•
increasing-at-most-by-value
–Used to check whether values are increasing by no more than the
maximum acceptable rate compared to the previous value. An oponal parameter that denes the
maximum acceptable rate of increase can be provided. The maximum acceptable rate of increase
defaults to 1 if not specied.
• Returns: True or False
• Syntax:
increasing-at-most-by-value <$var> [increment <maximum value of increase between successive
points>]
increasing-at-most-by-value <$var> [increment <maximum value of increase between successive
points>] me-range <range>
• Example: Checks that the error rate has not increased by more than 5 in the past 5 minutes.
when increasing-at-most-by-value $error-count increment 5 time-range 5m;
•
increasing-at-least-by-rate
–Used for checking that rate of increase between successive values is at
least given rate. Mandatory parameters include the value and me-unit, which together signify the
minimum acceptable rate of increase.
• Returns: True or False
• Syntax:
This syntax compares current value against previous value ensuring that it increases at least by
value rate.
increasing-at-least-by-rate <$var> value <minimum value of increase between successive points>
per <second|minute|hour|day|week|month|year> [me-range <range>]
This syntax compares current value against previous value ensuring that it increases at least by
percentage rate
increasing-at-least-by-rate <$var> percentage <percentage> per <second|minute|hour|day|week|
month|year> [me-range <range>]
• Example: Checks that the ospf-tx-hello has been increasing strictly over the past five minutes.
when increasing-at-least-by-rate $ospf-tx-hello value 1 per second time-range 5m;
•
increasing-at-most-by-rate
–Similar to increasing-at-least-by-rate, except that this checks for
decreasing rates.
Using these operators in the
when
clause, creates a funcon known as a user-dened condion. These
funcons should always return true or false.
23
If evaluaon of a
term
results in a match, then the acon specied in the
Then
clause is taken. By
default, processing of terms stops at this point. You can alter this ow by enabling the Evaluate next
term buon at the boom of the
Then
clause. This causes Paragon Insights to connue
term
processing
to create more complex decision-making capabilies like when-this and this, then that.
The following is a list of pre-dened acons available for use in the
Then
secon:
• next
• status
Tagging
Starng with Release 3.1.0, HealthBot supports tagging. Tagging allows you to insert elds, values, and
keys into a Paragon Insights rule when certain condions are met. See "Paragon Insights Tagging" on
page 33 for details.
Rule Properes
The Rule Properes block allows you to specify metadata for a Paragon Insights rule, such as hardware
dependencies, soware dependencies, and version history. This data can be used for informaonal
purposes or to verify whether or not a device is compable with a Paragon Insights rule.
Pre/Post Acon
(Oponal) Starng with Paragon Insights Release 4.3.0, you can use pre-acon and post-acon tab in
rules to automate tasks that are pre-congured in acon engine workows. Acon engine workows are
used to perform tasks that you can execute as command line commands, NETCONF commands, or as
commands in executable les. See "Understanding Acon Engine Workows" on page 244 for more
informaon.
When you run playbook instances on device groups, Paragon Insights executes pre-acon tasks at the
start of playbook instanaon. Pre-acon tasks are useful to execute device conguraons in a device
group or to issue a nocaon about device status to another applicaon. There is no dependency
between mulple pre-acon tasks and between the execuon of pre-acon tasks and rules. If you
congure more than one pre-acon task in a rule, Paragon Insights executes all pre-acon tasks
simultaneously.
Paragon Insights executes post-acon tasks when you stop a playbook instance. Even though an
oponal conguraon, post-acon tasks are useful to remove any addional conguraons added to
devices through the pre-acon tasks.
24

Both pre- and post-acon tasks have the execute-once opon. By default, execute-once is disabled. If
you enable execute-once, then Paragon Insights executes the tasks only once on a device in a device
group. Execute-once is applicable in the following cases:
• When you run mulple instances of a playbook on the same device group.
• When you include a rule with a set of pre-acon or post-acon tasks in dierent playbooks, and run
the playbook instances on the same device group.
Paragon Insights checks and resolves duplicaon of pre-acon and post-acon tasks before execung
them on the devices in a device group. Duplicaon occurs when you congure a specic pre-acon or
post-acon task in many rules that are included in a playbook.
NOTE: When you upgrade Paragon Insights, the applicaon does not execute pre-acon and
post-acon tasks that are deployed before the upgrade.
To congure pre-acon tasks and post-acon tasks in rules, see "Paragon Insights Rules and Playbooks"
on page 141.
Mulple Sensors per Device
Paragon Insights Release 4.0.0 allows you to add mulple sensors per rule that can be applied to all the
devices in a device group. In earlier releases, you could add only one sensor per rule. Each sensor per
rule generates data in a eld table. If you added the dierent sensors in mulple rules, it results in as
many eld tables as the number of rules. When you add mulple types of sensors (such as OpenCong
or Nave GPB) in a single rule in Paragon Insights, data from the sensors is consolidated in a single eld
table that is simpler to export or to visualize. The GUI support for mulple sensor conguraons will be
implemented in subsequent releases.
Guidelines
Sp-admins or users with create access privilege must note the following guidelines when conguring
mulple sensors.
• When adding mulple sensors to rules, you must ensure that there are no overlapping data or
keysets received from the sensors applied to a device. Overlapping keysets can result in duplicate
data points, overwring of data points, and inaccurate evaluaon of data. To avoid this, you can use
lter expressions such as the where statement in Fields.
• When you add mulple sensors in a rule in Paragon Insights GUI, you must set a common value for
all sensors in the following elds:
25

•
Frequency
eld in Sensors tab (sensor frequency)
•
Field aggregaon me-range
eld in Rules page.
•
Frequency
eld in Triggers tab.
•
Time range
eld used in triggers, formula, and reference.
For example, when mulple sensors are added in a rule, all sensors applied to a device must have the
same value for sensor frequency, irrespecve of the type of sensors. If a rule has iAgent and
OpenCong sensors, the
Frequency
value in both sensors must be the same. This holds true for all
the elds listed above.
NOTE: We recommend you use oset values if you cannot match the me range values on
dierent sensors. For more informaon, see Frequency Proles and Oset Time.
However, the frequency you set in a frequency prole will override the frequency values set in
mulple sensors in a rule.
• A Rule with mulple sensors is applied on all devices added in a parcular device group. It is assumed
that the devices in a device group support the types of sensors used in Paragon Insights rules.
Somemes, not all devices in a device group can support the same type of sensor. For example, the
device group DG1 has an MX2020 router with OpenCong package installed and another MX2020
router congured without the OpenCong package. The rst MX2020 router would support
OpenCong sensor whereas, the second MX2020 router would not support the same sensor.
To avoid such scenarios, you must ensure that all devices in the same device group unanimously
support the types of sensors used to collect informaon.
Congure Mulple Sensors in Paragon Insights GUI
To add mulple sensors in a rule:
1. Navigate to Conguraon > Rules > Add Rule.
Rules page appears.
2. Enter the Paragon Insights topic and rule name, rule descripon, synopsis, and oponally, the eld
aggregaon me-range and rule frequency. For more informaon on these elds in Rules page, see
"Paragon Insights Rules and Playbooks" on page 141.
3. Click Add Sensor buon in Sensors tab and ll in the necessary details based on the type of sensor
you choose.
26

Repeat step 3 to add as many sensors as you need for your use case.
4. Congure elds for the sensors in the Fields tab.
5. Congure sensors in Rule Properes tab to set mulple sensors acve.
You must enter all the sensors, earlier congured in the rule, under the supported-devices hierarchy
in Rule Properes. For example, if you congured sensors s1, s2, and s3 in a rule, the Rule Properes
conguraon must also include the same sensors:
rule-properties {
version 1;
contributor juniper;
supported-healthbot-version 4.0.0;
supported-devices {
sensors [s1 s2 s3];
You can also write and upload a new rule in the Paragon Insights GUI.
The rule must follow the curly brackets format ( { ) and indentaon for hierarchical structure.
Terminang or leaf statements in the conguraon hierarchy are displayed with a trailing semicolon
(;) to dene conguraon details, such as supported version, sensors, and other conguraon
statements.
6. Click Save & Deploy to apply the new sensors in your network or click Save to save the
conguraons of the new sensors and deploy them later.
Use Cases
The following scenarios illustrate use cases for mulple sensors in a rule:
• In Pathnder Controller, there can be dierent nave sensors that provide non-overlapping counter
details for Segment Roung (SR) and Resource Reservaon Protocol (RSVP) label switched paths
(LSP). If the eld table needs to be combined for the data collected from the LSPs, mulple sensors
can be made acve for a device in the same rule.
• If you want to get data for
ge
interface using iAgent sensor and for
fe
interface using Nave GPB
sensor, then you could use mulple acve sensor for a device. You need to ensure non-overlapping
data in this case by using Field ltering expression to lter by the interface name. Instead of
interfaces, an sp-admin or a user with create access privilege can consider any other key
performance indicators too.
27

Sensor Precedence
To make data collecon from a sensor eecve, devices in a device group must support a parcular
sensor as an ingest method. Select devices in a device group running an older version of operang
system, devices from dierent vendors in a device group, or dierent products from the same vendor
(such as EX, MX and PTX routers from Juniper) are all scenarios that can cause challenges to applying a
sensor to a device group. In such cases, you need to set a dierent sensor that is compable with
specic devices in a device group.
Paragon Insights Release 4.0.0 enables you to set sensor precedence so that, you can congure dierent
sensors in each hierarchy of Rule Properes such as vendor name, operang system, product name,
plaorm, and release version. This makes it possible to apply suitable sensors on mul-vendor devices in
a heterogeneous device group. In Release 4.0.0, you can congure sensor precedence only through
Paragon Insights CLI. Starng in Paragon Insights Release 4.2.0, you can congure more than one sensor
for a rule. For more informaon, see "Paragon Insights Rules and Playbooks" on page 141.
Figure 3 on page 28 illustrates two rules each with mulple sensors. It is assumed that Rule Properes
is congured for sensor precedence.
Figure 3: Representaon of Sensor Precedence in Rules
Let us suppose Sensor1 in Rule 1 is OpenCong and Sensor4 in Rule 2 is iAgent and Device1 runs Junos
operang system (OS). If OpenCong and iAgent were set as default sensors for Junos OS hierarchy in
Rule Properes then, Device1 would receive data from Sensor1 and Sensor4 when the Playbook is
deployed for the device group.
28

Before You Begin
In standalone deployment of Paragon Insights, before you congure sensor precedence, the devices in a
device group must be congured with the following elds:
•
Vendor name
: Paragon Insights Release 4.0.0 supports mulple vendors that include Juniper
Networks, Cisco Systems, Arista Networks, and PaloAlto Networks.
•
Operang system
: Name of the operang system supported by vendors such as Junos, IOS XR, and
so on.
•
Product
: Name of the family of products (devices) oered by a vendor. For example, MX routers, ACX
routers, PTX routers from Juniper Networks.
•
Plaorm
: Parcular member device in a series of products. For example, MX2020, ACX5400 and so
on.
•
Release or version
: release version of the plaorm selected.
The conguraon of above elds in the device hierarchy must match the sensor precedence specied in
the Rule Properes. For example, if you include plaorm MX2020 in device conguraon, the sensor
precedence hierarchy must also include MX2020.
Conguraon for Sensor Precedence
The following is a sample conguraon of seng sensor precedence in Rule Properes.
rule-properties {
version 1;
contributor juniper;
supported-healthbot-version 4.0.0;
supported-devices {
sensors interfaces-iagent;
juniper {
sensors interfaces-iagent;
operating-system junos {
products EX {
sensors interfaces-iagent;
platforms EX9200 {
sensors interfaces-iagent;
releases 17.3R1 {
sensors interfaces-iagent;
release-support min-supported-release;
}
29

}
platforms EX9100 {
sensors interfaces-oc;
}
}
products MX {
sensors interfaces-oc;
}
products PTX {
sensors interfaces-oc;
}
products QFX {
sensors interfaces-oc;
}
}
}
other-vendor cisco {
vendor-name cisco;
sensors interfaces-oc;
}
}
}
Sensor precedence mandates changes to the current hierarchy of conguraon in Rule Properes. The
hierarchy of the following elements have changed in Paragon Insights Release 4.0.0. The old hierarchy of
the listed elements in Rule Properes is deprecated.
•
Releases
: The old statement hierarchy dened Releases under Product, and Platform was listed under
Releases. This hierarchy is deprecated.
products MX {
releases 15.2R1 { ### Deprecated
release-support min-supported-release; ### Deprecated
platform All; ### Deprecated
}
}
30

• Operang system: The old stataement hierarchy dened operang system as a leaf element for other
vendors. This order is deprecated.
other-vendor cisco {
vendor-name cisco;
operating-system nexus; ### Deprecated
sensors [ s1 s2 ]; // Default sensors for cisco vendor
operating-systems nxos {
sensors [ s1 s2 ]; // Default sensors for cisco vendor with NX OS
products NEXUS {
sensors [ s1 s2 ]; // Default sensors for cisco vendor with NX OS and for
the specified product
platforms 7000 {
sensors [ s1 s2 ]; // Default sensors for cisco vendor with NX OS and
for the specified product and platform
releases 15.8 {
release-support only-on-this-release;
sensors [ s1 s2 ]; // Sensors for cisco vendor with NX OS and for
the product, platform and version
}
}
}
Paragon Insights Playbooks
In order to fully understand any given problem or situaon on a network, it is oen necessary to look at
a number of dierent system components, topics, or key performance indicators (KPIs). Paragon Insights
operates on playbooks, which are collecons of rules for addressing a specic use case. Playbooks are
the Paragon Insights element that gets applied, or run, on your device groups or network groups.
Paragon Insights comes with a set of pre-dened Playbooks. For example, the system-KPI playbook
monitors the health of system parameters such as system-cpu-load-average, storage, system-memory,
process-memory, etc. It then noes the operator or takes correcve acon in case any of the KPIs
cross pre-set thresholds. Following is a list of Juniper-supplied Playbooks.
• bgp-session-stats
• route-summary-playbook
• lldp-playbook
31

• interface-kpis-playbook
• system-kpis-playbook
• linecard-kpis-playbook
• chassis-kpis-playbook
You can create a playbook and include any rules want in it. You apply these playbooks to device groups.
By default, all rules contained in a Playbook are applied to all of the devices in the device group. There is
currently no way to change this behavior.
If your playbook denion includes network rules, then the playbook becomes a network playbook and
can only be applied to network groups.
Change History Table
Feature support is determined by the plaorm and release you are using. Use Feature Explorer to
determine if a feature is supported on your plaorm.
Release Descripon
4.2.0 Starng in Paragon Insights Release 4.2.0, you can congure more than one sensor for a rule.
4.0.0 Paragon Insights Release 4.0.0 allows you to add mulple sensors per rule that can be applied to all the
devices in a device group.
4.0.0 Paragon Insights Release 4.0.0 enables you to set sensor precedence so that, you can congure dierent
sensors in each hierarchy of Rule Properes such as vendor name, operang system, product name,
plaorm, and release version.
3.1.0 Starng in HealthBot Release 3.1.0, regular elds and key-elds can be added to rules based on
condional tagging proles.
3.1.0 Starng with Release 3.1.0, HealthBot supports tagging.
RELATED DOCUMENTATION
Paragon Insights Rules and Playbooks | 141
32

Paragon Insights Tagging
IN THIS SECTION
Overview | 33
Types of Tagging | 40
Add a Tagging Prole | 48
Apply a Tagging Prole | 53
Delete a Tagging Prole | 55
You can use the Paragon Insights (formerly HealthBot) graphical user interface (GUI) to create tagging
proles. You can congure a tagging prole to insert elds, values, and keys into a Paragon Insights rule.
You can also set condions that are checked against values stored in the mes series database (TSDB) or
Redis database.
Overview
IN THIS SECTION
Tagging Prole Terminology | 34
How do Tagging Proles Work? | 38
Caveats | 40
Tagging allows you to insert elds, values, and keys into a Paragon Insights rule when certain condions
are met.
Paragon Insights supports the following types of tagging:
• Stac Tagging
In stac tagging, the tagging prole is applied to values stored in the me series data base (TSDB).
These values do not vary a lot with me. In stac tagging, you can avoid using
When
statements, and
33
you can add
Then
statements individually to a row of the TSDB. You can add tags to all rows since no
condions are present.
• Dynamic Tagging
Paragon Insights Release 4.0.0 supports dynamic tagging where condions used in Paragon Insights
tagging are checked against values that are stored in Redis database. This database acts like a cache
memory that stores dynamic data. Dynamic data is real-me data that is stored in Redis database.
Tagging Prole Terminology
The following list describes the tagging prole terminologies:
Policy
A policy is the top-level element in a tagging prole. You can add mulple policies within a single tagging
prole. Mulple policies that exist within a tagging prole can have their own rules and terms.
Usage Notes:
• Dening mulple policies within a single prole allows you to dene terms for each rule in one prole
rather than having to create one prole for each rule.
Rules
A rule is any dened Paragon Insights rule. The rule element type in a tagging prole is a list element.
You can apply a specic policy prole to the rule(s) ([
rule1
,
rule2
]) included within the tagging prole.
Usage Notes:
You can describe the topic-name/rule-name requirement for the rules element in the following ways:
• To name specic rules within a tagging prole, use the form:
topic-name
/
rule-name
.
For example,
protocol.bgp
/
check-bgp-adversed-routes
. Navigate to Conguraon>Rules to view
congured rules.
• Use an asterisk (*) with no other value or brackets to match all rules.
• Use python-based fnmatch paerns to select all rules within a specic topic. For example, line-
cards/*.
For more informaon, see fnmatch — Unix lename paern matching.
34
Terms
The term secon of the tagging prole is where the match condions are set and examined, and acons
based on those matches are set and carried out. Set the condions for a match in a
when statement
. Set
the acons to be carried out upon compleng a match in one or more
then statements
.
Usage Notes:
• Each term can contain a
when
statement but it is not mandatory.
• Each term must contain at least one
then
statement.
• Mulple terms can be set within a single policy.
• Terms are processed sequenally from top to boom unl a match is found. If a match is found,
processing stops aer compleng the statements found in the
then
secon. Other terms, if present,
are not processed unless the
next
ag is enabled within the matched term. If the matched term has
the next ag enabled, then subsequent terms are processed in order.
When Statements
When
statements dene the match condions that you specify.
When
statements ulmately resolve to
be true or false. You can dene a
term
without a
when
statement. This equates to a default
term
wherein the match is assumed true and the subsequent
then
statement is carried out. Conversely,
mulple condions can be checked within one
when
statement.
If one or more of the condions set forth in a
when
statement are not met, the statement is false and
the
term
has failed to match; processing moves to the next
term
, if present.
Usage Notes:
When statements perform boolean operaons on the received data to determine if it matches the
criteria you set. The supported operaons are:
• Numeric Operaons:
• equal-to
• not-equal-to
• greater-than
• greater-than-or-equal-to
• less-than
• less-than-or-equal-to
35

• String Operaons:
• matches-with
• does-not-match-with
• Time Operaons:
• matches-with-scheduler
NOTE: The matches-with-scheduler opon requires that a discreet scheduler be congured in the
Administraon > Ingest Sengs > Scheduler page. The name of the scheduler can then be
used in the matches-with-scheduler
when
statement
• Go Language Expressions:
• eval <
simple-go-expression
>
For example: eval a + b <= c.
Then Statements
Then
statements implement the tagging instrucons that you provide. This is done only aer there is a
complete match of the condions set forth in a
when
statement contained in the same
term
. Each
term
dened must have at least one
then
statement. Each
then
statement must have one or more than one
acon(s) dened; the acons available in
then
statements are:
add-
eld
Adds a normal eld to the rule(s) listed in the rule secon.
Mulple elds can be added within a
then
statement. The add-eld acon requires that you
also dene the kind of eld you are adding with the
eld-type
parameter:
• string
• integer
• oat
• unsigned integer
Starng in Paragon Insights Release 4.2.0, you can also select unsigned integer as a name
eld data type.
36

NOTE: If you do not dene a eld type, the new eld gets added with the default eld-
type of string.
add-
key
Adds a key eld with string data type to the rule(s). Added key elds are indexed and can be
searched for just like any other key eld.
Usage Notes:
• You can set the
next
ag to true within a then statement. When this ag is set to true, the next term
in the policy gets evaluated if all of the condions of the current term match.
Example Conguraon: Elements of a Tagging Prole
Paragon Insights conguraon elements are displayed as pseudo-cong. This conguraon resembles
the hierarchical method used by Junos OS.
"Elements of a Tagging Prole" on page 37 shows how tagging prole elements are named and how
they are related to each other.
Elements of a Tagging Prole
healthbot {
ingest-settings {
data-enrichment {
tagging-profile <tagging-profile-name> {
policy <policy-name> {
rules [ List of Rules ];
term <term-name1>
{
when {
<condition1>
<condition2>
}
then {
add-field <field-name1>
{
value <field-value1>;
type <field-type>;
}
add-field <field-name2>
{
37

value <field-value2>;
type <field-type>;
}
add-key <key-field-name>
{
value <key-field-value>;
}
}
}
term <term-name2>
{
then {
add-field <field-name>
{
value <field-value>;
type <field-type>;
}
}
}
}
}
}
}
}
How do Tagging Proles Work?
You can use tagging proles to set the condions, dene new elds and keys, and insert values into
those elds. Tagging proles are applied as part of ingest sengs to allow the tags to be added to the
incoming data before Paragon Insights processes the data. Since one or more rules are dened within
each prole, the rules are added to a playbook and applied to a device group when the tagging prole is
applied to a device.
Table 3 on page 38 shows an example applicaon idencaon scenario based on source-port,
desnaon-port, and protocol of trac seen in a NetFlow stream.
Table 3: Fields in NetFlow Stream
source-port desnaon-port protocol derived-applicaon
2541 Any 6 (TCP) NetChat
38

Table 3: Fields in NetFlow Stream
(Connued)
source-port desnaon-port protocol derived-applicaon
Any 2541 6 (TCP)
1755 Any 17 (UDP) MS-streaming
Any 830 6 (TCP) netconf-ssh
7802 Any 17 (UDP) vns-tp
In Table 3 on page 38, you use three exisng elds in a NetFlow stream to guess the applicaon trac in
the stream. You then create a new eld called
derived-applicaon
and populate it based on the values
seen in the trac.
You can apply tagging proles at the device group level. See "Example pseudo-conguraon" on page
39.
• When a device in a device group has a tagging prole applied to it, and the device group has another
tagging prole applied to the whole group of devices, the tagging prole of the device group is
merged with the exisng tagging prole of the device.
For example, D-A-Net is a device that is part of a device group called Group-D1. D-A-Net has a
tagging prole applied to it. There is another tagging prole applied on the device group, Group-D1,
as well. In such a scenario, the tagging prole applied to the device group is merged with the tagging
prole of the device, D-A-Net.
• When the tagging prole applied to the device group and the tagging prole applied to the device in
the group renders the same output, the tagging prole of the device is preserved.
Example pseudo-conguraon shown below
device r0 {
host r0;
tagging-profile [ profile1 ]
}
device r1 {
host r1
}
device-group core {
devices [ r0 r1 ];
39

tagging-profile [ profile2 ]
}
In this example, device
r0
has tagging prole,
prole1
, assigned at the device level and tagging prole,
prole2
, assigned by its membership in the device- group (
core
).
Device
r1
has tagging prole,
prole2
, assigned by its membership in device group,
core
.
In this scenario,
prole1
and
prole2
are merged on device
r0
. However, if
prole1
and
prole2
both
dene the same elds but the elds contain dierent values, the value from
prole1
takes precedence
because it is assigned directly to the device.
Device
r1
only gets tagging prole
prole2
.
Caveats
• Fields and keys added using tagging proles cannot be used within periodic aggregaon elds. This is
because periodic aggregaon must take place before any UDFCode funcon (reference, vector, UDF,
ML) is applied.
• Tagging proles can consist of only elds in add-key or add-eld. Vectors cannot be added to a rule
by a tagging prole.
• Vector comparison operaons cannot be used within tagging prole terms. Only eld Boolean
operaons are permied.
• For tagging prole condional operaons within a
when
statement, the used eld must be of type
sensor, constant, or reference.
This is applicable only in stac tagging.
• If the eld used within tagging prole Boolean operaon is of type reference, then this reference
eld must not depend on any user-dened-funcon or formula dened within the same rule.
Types of Tagging
IN THIS SECTION
Stac Tagging | 41
Dynamic Tagging | 43
40

Paragon Insights supports stac tagging and dynamic tagging.
Stac Tagging
In stac tagging, the tagging prole is applied to values stored in the me series data base (TSDB). These
values do not vary a lot with me. In stac tagging, you can avoid using
When
statements, and you can
add
Then
statements to a tagging prole.
Sample Stac Tagging Conguraon
healthbot {
ingest-settings {
data-enrichment {
tagging-profile profile {
policy policy1 {
rules *;
term term1 {
then {
add-key "tenant-id" {
value tenant1;
}
}
}
}
}
}
}
}
In this sample stac tagging conguraon, the lack of a
when
statement means that any device that this
tagging prole is applied to will have the eld
tenant-id
assigned with the value
tenant1
. The elds and
values dened in this prole are assigned to all rules that are applied to a device or device-group
because of the * in the rules parameter.
You can also create a stac tagging prole from the Paragon Insights graphical user interface (GUI).
Navigate to Conguraon > Sensor > Sengs > Tagging Prole page to create a tagging prole.
Applicaon Idencaon
Table 3 on page 38 shows an example applicaon idencaon scenario based on source-port,
desnaon-port, and protocol of trac seen in a NetFlow stream.
41

To create the derived-applicaon eld as given in Table 3 on page 38 from the received data (data under
source-port, desnaon port, and protocol), you must use a tagging prole denion that looks like this:
healthbot {
ingest-settings {
data-enrichment {
tagging-profile profile1 {
policy policy1 {
rules *;
term term1 {
when {
matches-with "$source-port" "$netchat-source-port";
matches-with "$protocol" "6 (TCP)";
}
then {
add-key "application" {
value netchat;
}
}
}
term term2 {
when {
matches-with "$protocol" "6 (TCP)";
matches-with "$destination-port" "$netchat-dest-port";
}
then {
add-key "application" {
value netchat;
}
}
}
term term3 {
when {
matches-with "$source-port" "$ms-streaming-source-port";
matches-with "$protocol" "17 (UDP)";
}
then {
add-key "application" {
value ms-streaming;
}
}
}
42

term term4 {
when {
matches-with "$source-port" "$netconf-ssh-source-port";
matches-with "$protocol" "6 (TCP)";
}
then {
add-key "application" {
value netconf-ssh;
}
}
}
term term5 {
when {
matches-with "$source-port" "$vns-tp-source-port";
matches-with "$protocol" "17 (UDP)";
}
then {
add-key "application" {
value vns-tp;
}
}
}
}
}
}
}
}
Dynamic Tagging
Paragon Insights supports dynamic tagging. In dynamic tagging, you can set condions in a tagging
prole, that in turn are checked against values that are stored in Redis database. When these condions
are met, they are applied to incoming data before Paragon Insights processes the data.
Benets of Dynamic Tagging
• Values stored in Redis database are current and dynamic.
• Redis database can be used as a cache memory to store real-me data.
43

Understanding Redis Database and Dynamic Tagging Conguraons
Understanding Redis Database and Dynamic Tagging Conguraons
• Key structure is <Device-group-name>:<device-id>::key-name__network:<network-group-name>::key-name , where ::
is the key separator.
Example key structures:
• Device Group
Syntax:
<Device-group-name>:<device-id>::key-name
Example:
Device GroupCore:r1::/components/
• Network Group
Syntax:
__network:<network-group-name>::key-name
Example:
network::net_check::topic/rule
• Values are stored in JSON string format <json dump as string> in Redis. However, values are provided in
string, integer, and oat formats.
Example value formats:
• Core:r1::/components/= value1
• Core:r1::/components/='{“key1”: value1, “key2”: value2}’
• Core:r1::/components/='{“key1”: {“key2”: value1, “key3”: value2}’
• Core:r1::/components/='{“key1”: {“key2”: ‘[list of values]’, “key3”: value1}’
•
• Sample tagging-profile conguraons using when statement.
"when" : {
"matches-with" : [
{
"left-operand" : "$field1",
"right-operand" : “/interfaces/.key1”,
44

“in-memory”: true
}
]
}
• Use a . operator between interfaces.
In the following example, key3 interface is nested within key2 interface in the right operand.
"when" : {
"matches-with" : [
{
"left-operand" : "$field1",
"right-operand" : “/interfaces/.key2.key3”,
}
]
}
•
• Sample tagging-profile conguraons using then statement.
"then" : {
"add-field" : [
{
"name" : "field1",
"value" : "redis-key",
"type" : "integer",
"in-memory": true
}
]
}
• Use a . operator between interfaces.
In the following example, key3 interface is nested within key2 interface in the right operand.
"then" : {
"add-field" : [
{
"name" : "field2",
45

"value" : "redis-key1.redis-key2.redis-key3",
"type" : "integer",
"in-memory": true
}
]
}
• Using exist operator in conguraons.
• Using exist as key.
Redis Data Structure
“Core:r1::/interfaces/” = ‘{“ge-1/0/2”: {“key1”: value1, “key2”: value2}’
tagging-prole Using when Statement
“when”: {
“exists”: {
“field”: “$interface-name”,
“path”: “/interfaces/”,
“in-memory”: true
}
“then”: { do-something.. }
• Using exist as value in list.
Redis Data Structure
“Core:r1::/interfaces/” = ‘{“key1”: {“key2”: [‘ge-1/0/2’, ‘ge-1/0/3’], “key3”: value1}}
tagging-prole Using when Statement
“when”: {
“exists”: {
“field”: “$interface-name”,
“path”: “/interfaces/.key1.key2” ,
“in-memory”: true
}
},
46

“then”: {
“add-field”: [
“name”: “field1”,
“value”: “/interfaces/.key1.key3”,
“in-memory”: true
]
}
• Using $ in then statements.
When you use $<field-name> within a Redis key, $<field-name> is replaced with a value from the already
processed database value.
As an example, consider that ge-1/0/2 is present within Redis key.
Redis Data Structure
“Core:r1::/interfaces/” = ‘{“ge-1/0/2”: {“key1”: value1, “key2”: value2},
“ge-1/0/3”: {“key1”: value1, “key2”: value2}’
Example tagging -prole
“when”: {
“exists”: [
{
“field”: “$interface-name”,
“path”: “/interfaces/”,
“in-memory”: true
}
],
“greater-than”: [
{
“left-operand”: “30”,
“right-operand”: “/interfaces/.$interface-name.key1” ,
“in-memory”: true
}
]
},
“then”: {
“add-field”: [
“name”: “interface-meta-data”,
47

“value”: “/interfaces/.$interface-name.key2”,
“in-memory”: true
]
}
In this scenario, the tagging-profile checks if $interface-name is present in the Redis database, and if key1
value for the given interface name is greater than 30. If the statement is true, the tagging-profile
fetches key2 value from name eld. In this example tagging prole, the name value is interface-meta-data.
• To enable dynamic tagging, set in-memory value to true.
By default in-memory value is set to false.
“when”: {
“exists”: {
“field”: “$interface-name”,
“path”: “/interfaces/.key1.key2” ,
“in-memory”: true
}
}
“then”: {
“add-field”: [
“name”: “interface-meta-data”,
“value”: “/interfaces/.$interface-name.key2”,
“in-memory”: true
]
}
Add a Tagging Prole
You can use the Paragon Insights graphical user interface (GUI) to add stac tagging and dynamic
tagging proles.
Adding a Stac Tagging Prole
To add a stac tagging prole:
1. Navigate to Sengs > Ingest.
The Ingest Sengs page is displayed.
2. Click the Tagging Prole tab and then click the plus (+) icon to add a tagging prole.
48
The Create Tagging Prole page is displayed.
3. Enter the following informaon in the Create Tagging Prole page:
a. Enter a name for the tagging prole in the Prole Name text box.
The maximum length is 64 characters.
Regex paern: “[a-zA-Z][a-zA-Z0-9_-]*”
b. Click the plus (+) icon under Policies to dene a policy for this tagging prole.
You can dene one or more policies.
The Policies secon is displayed.
i. Enter a name for the new policy in the Policy Name text box.
The maximum length is 64 characters.
Regex paern: “[a-zA-Z][a-zA-Z0-9_-]*”
ii. Enter a rule that you want to apply to this tagging prole. The rule can contain an
fnmatch
expression.
You can apply one or more than one rule to a prole. A rule is any dened Paragon Insights
rule.
c. Click the add (+) icon under Terms to dene a list of condions.
i. Enter a name for the match condion in the Term Name text box.
ii. Congure When and Then statements.
You can dene tagging instrucons in a Then statement. Aer the condions that you set in a
When statement are met, the Then statement is implemented. Starng in Paragon Insights 4.2.0,
When statements are mandatory in stac tagging.
To congure a Then statement:
1. Click the plus (+) icon to add a key to the rules listed.
The Key Name and Value text boxes are displayed.
• Enter a name for the key in the Key Name text box.
The maximum length is 64 characters.
Regex paern: “[a-zA-Z][a-zA-Z0-9_-]*”
This name is added as the key eld for all rules congured within the tagging prole
rules secon.
• Enter a value that you want to associate to the key, in the Value text box.
49
2. Click the plus (+) icon to add a eld to the rules listed.
The Field Name and Value text boxes, and the Type drop-down list are displayed.
• Enter the name in the Field Name text box.
• Enter a value in the Value text box.
• Select the eld type from the Type drop-down list.
String type is selected by default.
Starng in Paragon Insights Release 4.2.0, you can also select unsigned integer as a
name eld data type. An unsigned integer is a data type that can contain values from 0
through 4,294,967,295.
• Click OK.
3. Set the Evaluate next term ag to True to evaluate condions in the next term. Evaluate
next term only if the rst condion is sased.
By default, the Evaluate next term ag is set to False.
4. Click Save to only save the conguraon.
Click Save & Deploy to save and deploy the conguraon immediately.
Adding a Dynamic Tagging Prole
To congure a dynamic tagging prole with Redis:
1. Navigate to Sengs > Ingest.
The Ingest Sengs page is displayed.
2. Click the Tagging Prole tab and then click the plus (+) icon to add a tagging prole.
The Create Tagging Prole page is displayed.
3. Enter the following informaon in the Create Tagging Prole page.
a. Enter a name for the tagging prole in the Prole Name text box.
The maximum length is 64 characters.
Regex paern: “[a-zA-Z][a-zA-Z0-9_-]*”
b. Click the plus (+) icon under Policies to dene a policy for this tagging prole.
You can dene one or more policies.
The Policies secon is displayed.
50

i. Enter a name for the new policy in the Policy Name text box.
The maximum length is 64 characters.
Regex paern: “[a-zA-Z][a-zA-Z0-9_-]*”
ii. Enter a rule that you want to apply to this tagging prole. The rule can contain an
fnmatch
expression.
You can apply one or more rules to a prole. A rule is any dened Paragon Insights rule.
c. Click the plus (+) icon under Terms to dene a list of condions.
i. Enter a name for the match condion in the Term Name text box.
ii. Congure When and Then statements:
You set condions for a match in a when statement. To congure When statement,
1. Click the Edit (pencil) icon.
The When Condion page is displayed.
2. Click + Add another when to view the Operator drop-down list.
3. Select a boolean operaon that you want to apply to incoming data from the Operator
drop-down list.
The Le Operand and Right Operand text boxes are displayed.
NOTE: + Add another when is automacally renamed to the operator condion
that you selected.
• Enter the value of the le operand of assignment that you selected, in the Le
Operand text box.
You can use $ as prex to populate database values. For example, $memory. However,
using $ as prex is not mandatory.
• Enter the value of the right operand of assignment that you selected, in the Right
Operand text box.
This value is populated from the Redis database.
• Set the Evaluate in Memory ag to True to populate data from the Redis database.
By default, the Evaluate in Memory ag is set to False. When the ag is set to false,
data is populated from the TSDB.
51
• Click OK.
• Set the Evaluate next term ag to True to evaluate condions in the next term. Aer
the rst condion is sased, the condions in the next term are evaluated.
By default, the Evaluate next term ag is set to False.
You can dene tagging instrucons in a Then statement. Aer the condions that you set in a
When statement are met, the Then statement is implemented. Starng in Paragon Insights
Release 4.2.0, When statements are mandatory in tagging prole.
To congure a Then statement:
1. Click the plus (+) icon to add a key to the rules listed.
The Key Name and Value text boxes are displayed.
• Enter a name for the key in the Key Name text box.
The maximum length is 64 characters.
Regex paern: “[a-zA-Z][a-zA-Z0-9_-]*”
This name will be added as key eld for all rules congured within the tagging prole
rules secon.
• Enter a value that you want to associate with the key, in the Value text box.
2. Click the plus (+) to add a text box to the rules listed.
The Field Name and Value text boxes, and the Type drop-down list are displayed.
• Enter the name in the Field Name text box.
• Enter a value in the Value text box.
• Select the eld type from the Type drop-down list.
String type is selected by default.
Starng in Paragon Insights Release 4.2.0, you can also select unsigned integer as a
name eld data type. An unsigned integer is a data type that can contain values from 0
through 4,294,967,295.
3. Set the Evaluate in Memory ag to True to populate data from the Redis database.
By default, the Evaluate in Memory ag is set to False.
4. Click OK.
52

5. Set the Evaluate next term ag to True to evaluate condions in the next term. The next
term is evaluated only if the rst condion is sased.
By default, the Evaluate next term ag is set to False.
4. Click Save to only save the conguraon.
Click Save & Deploy to save and deploy the conguraon immediately.
Apply a Tagging Prole
You can congure a tagging prole to insert elds, values, and keys into a Paragon Insights rule. You can
also set condions that are checked against values stored in the mes series database (TSDB) or Redis
database.
Aer you have created a tagging prole from the Paragon Insights graphical user interface (GUI), you can
apply a tagging prole to:
• a new device
• to an exisng device
• to a new device group
• to an exisng device group
Follow these steps to apply a tagging prole.
To apply a tagging prole to a new device:
1. Navigate to Conguraon > Device.
The Device Conguraon page is displayed.
2. Click (+) icon to add a new device.
The Add Device(s) page is displayed.
3. Aer you have entered the necessary informaon to add a device, click the Tagging Proles secon.
4. Select the tagging prole you want to apply to the device, from the Tagging Proles drop-down list.
5. Click Save to only save the conguraon.
Click Save & Deploy to save and immediately deploy the new conguraon.
To apply a tagging prole to an exisng device:
1. Navigate to Conguraon > Device.
The Device Conguraon page is displayed.
53
2. Select the check box next to the name of the device and click Edit device.
The Edit “
device
” page is displayed.
3. Click the Tagging Proles secon to view the Tagging Proles drop-down list.
4. Select the tagging prole you want to apply to the device, from the Tagging Proles drop-down list.
5. Click Save to only save the conguraon.
Click Save & Deploy to save and immediately deploy the new conguraon.
To apply a tagging prole to a new device group:
1. Navigate to Conguraon > Device Group.
The Device Group Conguraon page is displayed.
2. Click the add (+) icon to add a new device group.
The Add Device Group page is displayed.
3. Aer you have entered the necessary informaon to add a device group, click the Tagging Proles
secon.
4. Select the tagging prole you want to apply to the device, from the Tagging Proles drop-down list.
5. Click Save to only save the conguraon.
Click Save & Deploy to save and immediately deploy the new conguraon.
To apply a tagging prole to an exisng device group:
1. Navigate to Conguraon > Device Group.
The Device Group Conguraon page is displayed.
2. Select the check box next to the name of the device group and click the Edit device group icon.
The Edit “
device
” page is displayed.
3. Click the Tagging Proles secon to view the Tagging Proles drop-down list.
4. Select the tagging prole you want to apply to the device group, from the Tagging Proles drop-down
list.
5. Click Save to only save the conguraon.
Click Save & Deploy to save and immediately deploy the new conguraon.
54

NOTE:
• When a device in a device group has a tagging prole applied to it, and the device group has
another tagging prole applied to the whole group of devices, the tagging prole of the device
group is merged with the exisng tagging prole of the device.
For example, D-A-Net is a device that is part of a device group called Group-D1. D-A-Net has
a tagging prole applied to it. There is another tagging prole applied on the device group,
Group-D1, as well. In such a scenario, the tagging prole applied to the device group is
merged with the tagging prole of the device, D-A-Net.
• When the tagging prole applied to the device group and the tagging prole applied to the
device in the group renders the same output, the tagging prole of the device is preserved.
Delete a Tagging Prole
To delete a tagging prole:
1. Click Sengs > Ingest from the le-nav bar.
The Ingest Sengs page is displayed.
2. Click the Tagging Prole tab to view the Tagging Prole page.
3. Select the tagging prole that you want to delete, and click the delete (trash can) icon.
The CONFIRM DELETE pop-up appears.
55
Figure 4: Conrm Delete Pop-up
4. Do any one of the following:
• Click Yes to delete the tagging prole from the database. However, the changes are not applied to
the ingest service.
NOTE:
• We recommended that you do not delete a tagging prole that is currently in use.
• Aer you delete a tagging prole from the database, you cannot associate that tagging
prole with another device or device group even if you have not deployed changes.
• You can also deploy changes to the ingest service or roll back the changes that you
have already deleted, from the PENDING CONFIGURATION page. For more
informaon, see "Commit or Roll Back Conguraon Changes in Paragon Insights" on
page 307.
• Select the Deploy changes check box and then click Yes to delete the tagging prole from the
database, and to apply the changes to the ingest service.
• (Oponal) Click No to cancel this operaon.
Change History Table
56

Feature support is determined by the plaorm and release you are using. Use Feature Explorer to
determine if a feature is supported on your plaorm.
Release Descripon
4.0.0 Paragon Insights Release 4.0.0 supports dynamic tagging where condions used in Paragon Insights
tagging are checked against values that are stored in Redis database.
Paragon Insights Time Series Database (TSDB)
IN THIS SECTION
Historical Context | 57
TSDB Improvements | 58
Database Sharding | 59
Database Replicaon | 60
Database Reads and Writes | 61
Manage TSDB Sengs in the Paragon Insights GUI | 62
Paragon Insights CLI Conguraon Opons | 64
Paragon Insights (formerly HealthBot) collects a lot of data through its various ingest methods. All of
that data is me sensive in some context. This is why Paragon Insights uses a me series database
(TSDB) to store and manage all of the informaon received from the various network devices. This topic
provides an overview of the TSDB as well some guidance on managing it.
Historical Context
In releases earlier than HealthBot Release 3.0.0, there was one TSDB instance regardless of whether you
ran Paragon Insights as a single node or as a mul-node (Docker Ccompose) installaon. Figure 5 on
page 58 shows a high-level view of what this looked like.
57

Figure 5: Single TSDB Instance - Releases earlier than HealthBot Release 3.0.0
This arrangement le no room for scaling or redundancy of the TSDB. Without redundancy, there is no
high availability (HA); A failure le you with no way to connue operaon or restore missing data.
Adding more Docker Compose nodes to this topology would only provide more Paragon Insights
processing capability at the expense of TSDB performance.
TSDB Improvements
To address these issues and provide TSDB high availability (HA), three new TSDB elements are
introduced in HealthBot Release 3.0.0, along with clusters of Paragon Insights nodes* for the other
Paragon Insights microservices:
• – How many servers, or nodes, are available to store TSDB data and scale Paragon Insights?
• – How many copies of your data do you want to keep?
• – How is data wrien and read back from the TSDB? What happens when something goes wrong?
58

NOTE: *Paragon Insights uses Kubernetes for clustering its Docker-based microservices across
mulple physical or virtual servers (nodes). Kubernetes clusters consist of a primary node and
mulple worker nodes. During the healthbot setup poron of Paragon Insights mulnode
installaons, the installer asks for the IP addresses (or hostnames) of the Kubernetes primary
node and worker nodes. You can add as many worker nodes to your setup as you need, based on
the required replicaon factor for the TSDB databases. The number of nodes you deploy should
be at least the same as the replicaon factor. (See the following secons for details).
For the purposes of this discussion, we refer to the Kubernetes worker nodes as Paragon Insights
nodes. The primary node is not considered in this discussion.
Database Sharding
Database sharding refers to selecvely storing data on certain nodes. This method of wring data to
selected nodes distributes the data among available TSDB nodes and permits greater scaling since each
TSDB instance then handles only a poron of the me series data from the devices.
To achieve sharding, Paragon Insights creates one database per device group/device pair and writes the
resulng database to a specic (system determined) instance of TSDB hosted on one (or more) of the
Paragon Insights nodes.
For example, say we have two devices, D1 and D2 and two device groups, G1 and G2. If D1 resides in
groups G1 and G2, and D2 resides only in group G2, then we end up with 3 databases: G1:D1, G2:D1,
and G2:D2. Each database is stored on its own TSDB instance on a separate Paragon Insights node as
shown in Figure 6 on page 60 below. When a new device is on-boarded and placed within a device
group, Paragon Insights chooses a TSDB database instance on which to store that device/device-group
data.
59

Figure 6: Distributed TSDB
Figure 6 on page 60, above, shows 3 Paragon Insights nodes, each with a TSDB instance and other
Paragon Insights services running.
NOTE:
• A maximum of 1 TSDB instance is allowed on any given Paragon Insights node. Therefore, a
Paragon Insights node can have 0 or 1 TSDB instances at any me.
• A Paragon Insights node can be dedicated to running only TSDB funcons. When this is done,
no other Paragon Insights funcons run on that node. This prevents other Paragon Insights
funcons from starving the TSDB instance of resources.
• We recommend that you dedicate nodes to TSDB to provide the best performance.
• Paragon Insights and TSDB nodes can be added to a running system using the Paragon
Insights CLI.
Database Replicaon
As with any other database system, replicaon refers to storing the data in mulple instances on
mulple nodes. In Paragon Insights, we establish a replicaon factor to determine how many copies of
the database are needed.
60

A replicaon factor of 1 only creates one copy of data, and therefore, provides no HA. When mulple
Paragon Insights nodes are available and replicaon factor is set to 1, then only sharding is achieved.
The replicaon factor determines the minimum number of Paragon Insights nodes needed. A replicaon
factor of 3 creates three copies of data, requires at least 3 Paragon Insights nodes, and provides HA. The
higher the replicaon factor, the stronger the HA and the higher the resource requirements in terms of
Paragon Insights nodes. If you want to scale your system further, you should add Paragon Insights nodes
in exact mulples of the replicaon factor, or 3, 6, 9, etc.
Consider an example where, based on device/device-group pairing menoned earlier, Paragon Insights
has created 20 databases. The Paragon Insights system in queson has a replicaon factor of 2 and has
4 nodes running TSDB. Based on this, two TSDB replicaon groups are created; in our example they are
TSDB Group 1
and
TSDB Group 2
. In Figure 7 on page 61 below, the data from databases 1-10 is being
wrien to TSDB instances 1 and 2 in TSDB group 1. Data from databases 11-20 is wrien to TSDB
instances 3 and 4 in TSDB group 2. The outline around the TSDB instances represents a TSDB
replicaon group. The size of the replicaon group is determined by the replicaon factor.
Figure 7: TSDB Databases
Database Reads and Writes
As shown in Figure 6 on page 60, Paragon Insights can make use of a distributed messaging queue. In
cases of performance problems or errors within a given TSDB instance, this allows for writes to the
61

database to be performed in a sequenal manner ensuring that all data is wrien in proper me
sequence.
All Paragon Insights microservices use standardized database query (read) and write funcons that can
be used even if the underlying database system is changed at some point in the future. This allows for
exibility in growth and future changes. Other read and write features of the database system include:
• In normal operaon, database writes are sent to all TSDB instances within a TSDB group.
• Database writes can be buered up to 1GB per TSDB instance so that failed writes can be retried
unl successful.
• If problems persist and the buer lls up, the oldest data is dropped in favor of new data.
• When buering is acve, database writes are performed sequenally so that new data cannot be
wrien unl the previous write aempts are successful.
• Database queries (reads) are sent to the TSDB instance which has reported the fewest write errors in
the last 5 minutes. If all instances are performing equally, then the query is sent to a random TSDB
instance in the required group.
Manage TSDB Sengs in the Paragon Insights GUI
You can use the Paragon Insights GUI to congure the me series database (TSDB) sengs.
To congure TSDB sengs:
WARNING: Selecng, deleng, or dedicang TSDB nodes must be done during a
maintenance window because some services will be restarted and the Paragon Insights
GUI will likely be unresponsive.
1. Select Sengs > System.
The System Sengs page appears.
2. Click Time Series Database.
The TSDB Sengs page appears.
3. From the TSDB Sengs page, you can:
a. Select one or more nodes (from the TSDB Nodes list) to be used as TSDB nodes.
62

(The TSDB Nodes list displays the available nodes in the Paragon Insights installaon that you can
select as TSDB nodes. By default, Paragon Insights automacally selects one node as a TSDB
node.)
b. Set the replicaon factor by typing a value (or by using the arrows to specify a value) in the
Replicaon Factor text box.
(The replicaon factor determines how many copies of the database are needed. The replicaon
factor is set to 1 by default.)
c. Dedicate nodes as TSDB nodes by clicking the Dedicate toggle to turn it on.
A TSDB node might have more than one microservice running. However, when you dedicate a
node as TSDB node, it runs only the TSDB microservice, and stops running all other
microservices.
NOTE:
• If the node is associated to a persistent volume (storage in a cluster), then you cannot
use that node as a dedicated TSDB node.
• A fail-safe mechanism ensures that you cannot dedicate all Paragon Insights nodes as
TSDB nodes.
d. Ignore system errors (when you remove or replace a failed TSDB node from Paragon Insights) by
clicking the Force toggle to turn it on.
For example, when a TSDB node fails and the replicaon factor for that node is set to one, the
TSDB data for that node is lost. In this scenario, the failed TSDB node must be removed from
Paragon Insights. However, when you try to replace the failed node with a new node, the backup
of the node fails with a system error because the replicaon factor was set to one. If you want to
proceed with replacing the node, you must turn the Force toggle on.
e. Delete a node that was previously assigned as a TSDB node by clicking X next to the name of the
TSDB node. The node is removed as a TSDB node when you deploy the new conguraon
changes.
4. Do one of the following:
• Click Save to only save the conguraon changes to the database without applying the changes
to the TSDB nodes.
You must commit (or rollback) the conguraon changes later. For more informaon, see "Commit
or Roll Back Conguraon Changes in Paragon Insights" on page 307.
63

• Click Save & Deploy to save conguraon changes to the database and to apply the changes to
the TSDB nodes.
5. In the pop-up that appears, click OK to conrm.
You are returned to the TSDB Sengs page.
Paragon Insights CLI Conguraon Opons
The Paragon Insights CLI provides a means to add and delete TSDB nodes from from the system and to
change the replicaon factor as a result.
Add a TSDB Node to Paragon Insights
# set healthbot system time-series-database nodes <
IP address or hostname
> dedicate <
true
or
false
>
or
#set healthbot system time-series-database nodes [
space-separated list of IP addresses or
hostnames
] dedicate <
true
or
false
>
Manage the Replicaon Factor
# set healthbot system time-series-database replication-factor <
replication-factor
>
Set the replicaon factor to a mulple of the number of TSDB nodes present in the system. If you have
two TSDB nodes, set the replicaon factor at 2, 4, 6, etc.
Usage Notes
• Paragon Insights performs a ping to determine if the new node(s) is reachable. A warning is shown if
the ping fails.
• The
dedicate
opon species whether or not the TSDB nodes perform only TSDB funcons.
RELATED DOCUMENTATION
Paragon Insights Installaon Guide
64

Paragon Insights Machine Learning (ML)
IN THIS SECTION
Paragon Insights Machine Learning Overview | 65
Understanding Paragon Insights Anomaly Detecon | 66
Understanding Paragon Insights Outlier Detecon | 68
Understanding Paragon Insights Predict | 72
Paragon Insights Rule Examples | 73
Paragon Insights Machine Learning Overview
Paragon Insights (formerly HealthBot) uses machine learning to detect anomalies and outliers, and
predict future device or network-level behavior. The machine learning-enabled Paragon Insights features
include:
Anomaly
Detecon
Anomaly detecon using the Paragon Insights Anomaly Detecon algorithms involves
comparison of new data points with data points collected from the same device during a
specic learning period. Paragon Insights supports the following machine learning
algorithms for anomaly detecon:
• 3-sigma
• K-means
• Holt-Winters
Anomaly detecon can be acvated within Paragon Insights rules by seng a rule eld’s
ingest type to formula, and then selecng anomaly detecon. (Conguraon > Rules >
Fields tab > Ingest Type > Formula).
Outlier
Detecon
Outlier detecon using the Paragon Insights Outlier Detecon algorithms involves
analysis of data from a collecon of devices across your network during a specic learning
period. Paragon Insights supports the following machine learning algorithms for outlier
detecon:
65

• Density-Based Spaal Clustering of Applicaons with Noise (DBSCAN)
• K-fold cross-validaon using 3-sigma (k-fold/3-sigma)
Predicon
Predicon of future device or network-level behavior involves using the Paragon Insights
median predicon machine learning algorithm or, the Holt-Winters predicon algorithm.
Starng with HealthBot Release 3.1.0, you can choose the Holt-Winters predicon
algorithm from Conguraon > Rules > Fields > Ingest Type > Formula.
Understanding Paragon Insights Anomaly Detecon
IN THIS SECTION
Field | 66
Algorithm | 66
Learning period | 67
Paern periodicity | 68
This secon describes the input parameters associated with Paragon Insights rules congured to detect
anomalies using Anomaly Detecon algorithms. Once the machine learning models are built, they can be
used in producon to classify new data points as normal or abnormal. The accuracy of the results
increases with larger amounts of data.
Field
To apply a machine learning algorithm, you must rst dene the numeric data eld on which to apply the
algorithm. For informaon on how to create a user-dened data eld for a Paragon Insights rule, see the
Fields secon in the Paragon Insights User Guide.
Algorithm
The Paragon Insights Anomaly Detecon algorithms include Holt-Winters, 3-sigma and k-means:
66
Holt-
Winters
The Holt-Winters algorithm uses trac entropy measurements and seasonal variaons in
trac to detect anomalous trac owing through an interface. The seasonality aspect
provides a means to de-emphasize normal increases and decreases in trac that happen
regularly over me intervals. For example, network trac in an enterprise network could be
expected to have a weekly seasonality since there would be signicantly more trac on the
network during the work week than on the weekend.
Since Holt-Winters can predict a trac drop starng on Friday evening, an anomaly might
be triggered if trac actually increased on Friday evening.
3-Sigma
The 3-sigma algorithm classies a new data point as normal if it’s within 3 standard
deviaons from the mean (average across all the data points in the data set). A new data
point is classied as abnormal if it’s outside this range.
K-means
The Paragon Insights k-means algorithm uses k-means clustering and other building blocks
to create a machine learning model for classifying new data points as normal or abnormal:
• K-means clustering splits n data points into k groups (called clusters), where k ≤ n. For
Paragon Insights, k is set to 5 buckets.
• For forming the clusters, a 32-dimensional vector is considered for each point, thus
taking into account the trend (not just the current point, but its past 31 historical values).
• Each cluster has a center called the centroid. A cluster centroid is the mean of a cluster
(average across all the data points in the cluster).
• All new data points are added to a cluster, however, if a data point is considered too far
away from the centroid, it is classied as abnormal.
Learning period
The learning period species the me range to collect data from which the algorithm uses to build the
machine learning models. Supported units of me for learning period include: seconds, minutes, hours,
days, weeks, and years. You must enter the plural form of the me unit with no space between the
number and the unit. For example, a learning period of one hour must be entered as 1hours.
Paragon Insights builds machine learning models daily starng at midnight. For example, if the learning
period is 5 days and triggered on 11th Feb 2019 00:00, then data collected from 6th Feb 2019 00:00 to
11th Feb 2019 00:00 is used by Paragon Insights to build the machine learning models. For the Holt-
Winters predicon algorithm, the learning period must be at least twice the paern periodicity to ensure
there is enough of a paern to learn.
67
Paern periodicity
The paern periodicity species the buckets for which data should be collected and used to build
machine learning models. Each bucket of data represents a user-dened me period and a specic
paern of data. A minimum number of data points is required for a machine learning algorithm to build a
model:
• 3-sigma requires at least 10 data points per bucket of data.
• K-means requires at least 32 data points per bucket of data.
Supported units of me for paern periodicity include: minutes, hours, days, weeks, and months. You
must enter the plural form of the me unit with no space between the number and the unit.
For example:
• If the paern periodicity is 1 day (entered as 1days), the data for each day of the week has a specic
paern. Paragon Insights creates 7 buckets of data and 7 dierent models, one for each day of the
week.
• If the paern periodicity is 1 hour (entered as 1hours), regardless of the day, week, or month, the
data for every hour has a specic paern. Paragon Insights creates 24 buckets of data and 24
dierent models, one for each hour (00:00-00:59, 1:00-1:59, 2:00-2:59 … 23:00-23:59) of the day.
• If the paern periodicity is 1 day 1 hour (entered as 1days 1hours), the data for every hour of each
day of the week has a specic paern. Paragon Insights creates 7 * 24 = 168 buckets of data and 168
dierent models. 24 buckets for Monday (1 for every hour), 24 buckets for Tuesday (1 for every
hour), and so on. In this case, it doesn’t maer from which month data is collected.
Understanding Paragon Insights Outlier Detecon
IN THIS SECTION
Dataset | 69
Algorithm | 70
Sigma coecient (k-fold-3sigma only) | 71
Sensivity | 71
Learning period | 71
68

This secon describes the input parameters associated with Paragon Insights rules used for outlier
detecon algorithms. Once the machine learning models are built, they can be used in producon to
idenfy me series data sets as outliers. The accuracy of the results increases with larger amounts of
data.
The results of the Paragon Insights outlier detecon algorithm are stored in a table in the mes series
database. Each row in the table contains outlier detecon output and metadata that is associated with a
parcular me series. You can use the informaon in the table to congure Paragon Insights rule
triggers. Each column in the table is idened by a unique name that starts with the user-dened outlier
detecon eld name. For example, you can use the
eld-name
-is-outlier and
eld-name
-device column
names to congure a trigger that detects outliers and produces a message that indicates which specic
device was determined to be the outlier. For more informaon, see the “Triggers” secon of the
"Paragon Insights Outlier Detecon Example" on page 83.
Dataset
For the outlier detecon formula, input data is specied as a list of XPATHs from a variable. For
informaon on how to create a user-dened variable for a Paragon Insights rule, see the Variables
secon in the Paragon Insights User Guide.
The following is an example of a list of XPATHs:
/device-group[device-group-name=DG0]/device[device-name=D0]/topic[topic-name=T0]/ rule[rule-
name=R0]/field[re=RE[01] AND hostname=10.1.1.*]/re-memory,/ device-group[device-group-name=DG0]/
device[device-name=D1]/topic[topic-name=T0]/ rule[rule-name=R0]/field[re=RE[01] AND
hostname=10.1.1.*]/re-memory
This path list species that on devices D0 and D1 in device-group DG0, get re-memory from topic T0
rule R0, where the RE is either RE0 or RE1 and the hostname is in the 10.1.1.* block. This path allows
for selecng data at the eld-key level, which is necessary because dierent eld keys may have
dierent purposes.
For example:
• On D0 and D1, with the eld named “memory usage on roung engine,” keys RE0 and RE1 represent
two roung engines per device.
• There’s no guarantee that RE0 is a primary on all devices, therefore they might not be comparable
when checking for outliers.
• This mechanism allows for selecng only the primaries: D0-RE0 and D1-RE1.
69
Algorithm
The outlier detecon algorithms include k-fold, 3-sigma, and dbscan:
K-Fold
Cross-
Validaon
Using 3-
Sigma
K-fold cross-validaon using the 3-sigma (k-fold 3-sigma) algorithm is used to create a
machine learning model for idenfying outliers. K-fold cross-validaon splits the enre
data set into k groups and uses the following general process to create the machine
learning models:
• Each unique k group is used as a test data set.
• The k groups (that are not being used as a test data set) are used as the training data
set to build a machine learning model.
• Each test data set is evaluated using its associated machine learning model.
• The test data set with the most outliers relave to their associated machine learning
model is classied as an outlier.
For example, if k is the number of devices in a device group and the group has 4 devices,
then k=4. For cross-validaon, four machine learning models are built and the test data
sets are evaluated as follows:
• Model 1: Trained with the data points collected from device 1, device 2, and device 3,
then tested with the data points collected from device 4.
• Model 2: Trained with the data points collected from device 1, device 2, and device 4,
then tested with the data points collected from device 3.
• Model 3: Trained with the data points collected from device 1, device 3, and device 4,
then tested with the data points collected from device 2.
• Model 4: Trained with the data points collected from device 2, device 3, and device 4,
then tested with the data points collected from device 1.
Using the k-fold 3-sigma algorithm is more applicable if it’s known that outliers will skew
in one direcon or another. If there are outliers on both sides of normal data points, or
there are enough outlier data points to make the algorithm believe that nothing is
outlying, then the k-fold 3-sigma algorithm will not provide signicant results.
DBSCAN
Density-Based Spaal Clustering of Applicaons with Noise (DBSCAN) is an
unsupervised machine learning algorithm used to create a machine learning model for
idenfying me series data sets as outliers:
70
• Time series data sets are grouped in such a way that data points in the same cluster
are more similar to each other than those in other clusters.
• Clusters are dense regions of me series data sets, separated by regions of lower
density.
• If a me series data set belongs to a cluster, it should be near many other me series
data sets in that cluster.
• Time series data sets in lower density regions are classied as outliers.
Using the DBSCAN algorithm is more applicable if outliers appear inside the 3-sigma
threshold of the other data points. DBSCAN can nd outlying behavior that doesn’t
appear as a signicant deviaon from the normal behavior at any given me step.
Sigma coecient (k-fold-3sigma only)
The sigma coecient is a thresholding argument (default value is 3). The thresholding argument
determines, at each point in me for a series, how far away a value must be from the other values to be
marked as an outlier.
Sensivity
Sensivity is used to calculate the outliers, m, that the algorithm seeks to nd in the data. Sensivity
determines the number of me series test data sets to return as outliers (the top m are returned):
• Sensivity “low”: 0.03% of the number of sensors
• Sensivity “medium”: 5% of the number of sensors
• Sensivity “high”: 36% of the number of sensors
• Absolute percentage x: x*number of sensors (oat, 0.0-1.0)
Learning period
See the "Learning period" on page 67 descripon of the “Understanding Paragon Insights Anomaly
Detecon” secon.
71

Understanding Paragon Insights Predict
IN THIS SECTION
Field | 72
Algorithm | 72
Learning period | 72
Paern periodicity | 73
Predicon oset | 73
This secon describes the input parameters associated with Paragon Insights rules used for forecasng
future values with the Paragon Insights median predicon machine learning algorithm or the Holt-
Winters predicon machine learning algorithm. Once the machine learning models are built, they can be
used in producon to predict trends and forecast future values. The accuracy of the results increases
with larger amounts of data.
Field
See the "Field" on page 66 descripon of the “Understanding Paragon Insights Anomaly Detecon”
secon.
Algorithm
The Paragon Insights Predict feature uses either the median predicon algorithm, or the Holt-Winters
predicon algorithm.
The median value represents the midpoint for a range of values within a data sampling. For every paern
periodicity bucket, a median is calculated from the data samples available in the bucket.
Learning period
See the "Learning period" on page 67 descripon of the “Understanding Paragon Insights Anomaly
Detecon” secon.
72

Paern periodicity
See the "Paern periodicity" on page 68 descripon of the “Understanding Paragon Insights Anomaly
Detecon” secon. For the median predicon algorithm, we recommend a minimum number of 10 data
points for building a machine learning model. For the Holt-Winters algorithm, the paern periodicity
should be half or less of the learning period.
Predicon oset
The predicon oset value is a me in the future at which you want to predict a eld value. For
example, if the present me is 6th Feb 2019 10:00 and the predicon oset is set to 5 hours, then
Paragon Insights will predict a eld value for 6th Feb 2019 15:00.
Supported units of me for predicon oset include: seconds, minutes, hours, days, weeks, and years.
You must enter the plural form of the me unit with no space between the number and the unit. For
example, a predicon oset of one hour must be entered as 1hours.
Paragon Insights Rule Examples
IN THIS SECTION
Paragon Insights Anomaly Detecon Example | 73
Paragon Insights Outlier Detecon Example | 83
The machine learning Paragon Insights rules described in this secon are available for upload from the
Paragon Insights Rules and Playbooks GitHub repository.
Paragon Insights Anomaly Detecon Example
This example describes how the check-icmp-statistics Paragon Insights device rule is congured to send
ICMP probes to user-dened desnaon hosts to detect anomalies when round trip average response
me is above stac or dynamic thresholds.
The following secons show how to congure the applicable input parameters for each Paragon Insights
rule denion block (such as, Fields, Variables, and Triggers) using the Paragon Insights GUI. For more
informaon about how to congure Paragon Insights rules, see Creang a New Rule using the Paragon
Insights GUI.
73

Sensors (check-icmp-stascs)
Figure 8 on page 74 shows the general properes and iAgent sensor congured for the check-icmp-
statistics rule. For informaon about the count-var and host-var variables, see "Variables (check-icmp-
stascs)" on page 76.
Figure 8: General properes (check-icmp-stascs) and Sensors denion (icmp)
Fields (check-icmp-stascs)
The following elds are congured for the check-icmp-statistics rule:
dt-response-me
(See Figure 9 on page 75) Conguraon for anomaly detecon using the k-means
algorithm. When an anomaly is detected, Paragon Insights returns a value of 1.
r-average-ms
(See Figure 10 on page 75) Round trip average response me.
r-threshold
(See Figure 11 on page 76) Stac threshold for the round trip average response
me. The rtt-threshold variable populates this eld.
74

Figure 9: Fields denion (dt-response-me)
Figure 10: Fields denion (r-average-ms)
75

Figure 11: Fields denion (r-threshold)
Variables (check-icmp-stascs)
The following three variables are congured for the check-icmp-statistics rule:
count-var
(See Figure 12 on page 76) ICMP ping count. Count is set to 1 by default.
host-var
(See Figure 13 on page 77) Desnaon IP address or host name where ICMP
probes are periodically sent.
r-threshold-var
(See Figure 14 on page 77) Stac threshold value for round trip average response
me. Threshold value is 1 ms by default. This variable populates the rtt-threshold
eld.
Figure 12: Variables denion (count-var)
76

Figure 13: Variables denion (host-var)
Figure 14: Variables denion (r-threshold-var)
Funcons (check-icmp-stascs)
Figure 15 on page 77 shows the funcon congured for the check-icmp-statistics rule. This funcon
converts the unit of measure for the round trip average response me from microseconds to
milliseconds.
Figure 15: Funcons denion (micro-milli)
77
Triggers (check-icmp-stascs)
The following triggers and terms are congured for the check-icmp-statistics rule:
• packet-loss — (See Figure 16 on page 79)
The following terms are congured for the packet-loss trigger:
is-device-not-
reachable
(See Figure 17 on page 79) When the ICMP packet loss is 100%, the
Paragon Insights health status severity level is set to major (red).
is-device-up (See Figure 18 on page 80) When the packet loss is greater than 0, the
severity level is set to minor (yellow).
no-packet-loss (See Figure 19 on page 80) Otherwise, the severity level is set to normal
(green).
• round-trip-me — (See Figure 20 on page 81)
The following terms are congured for the round-trip-me trigger:
is-r-ne
(See Figure 21 on page 81) When the host is not reachable or the round trip
average response me is above the stac threshold, the Paragon Insights health
status severity level is set to major (red).
is-r-medium (See Figure 22 on page 82) When an anomaly is detected using the anomaly
detecon formula, Paragon Insights returns a value of 1 for the dt-response-me
eld, and the severity level is set to minor (yellow). In this case, the response me is
above the anomaly detecon.
r-normal (See Figure 23 on page 82) Otherwise, the severity level is set to normal (green).
78

Figure 16: Triggers denion (packet-loss)
Figure 17: Terms denion (is-device-not-reachable)
79
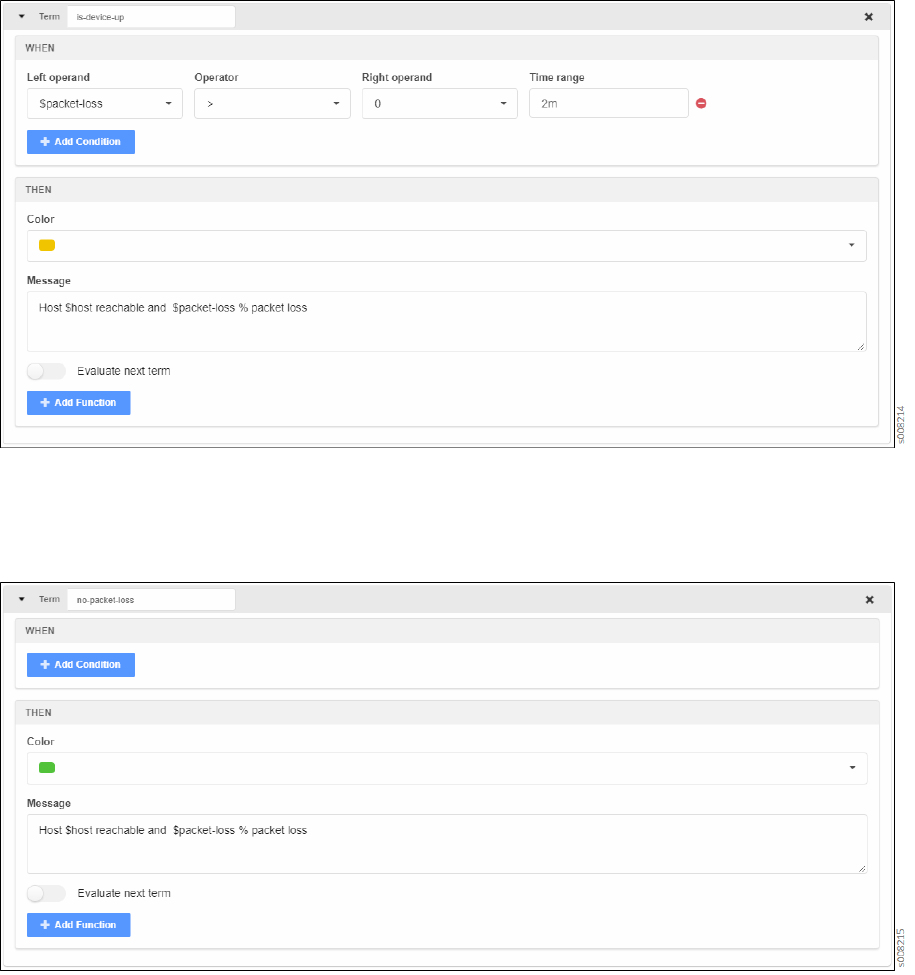
Figure 18: Terms denion (is-device-up)
Figure 19: Terms denion (no-packet-loss)
80
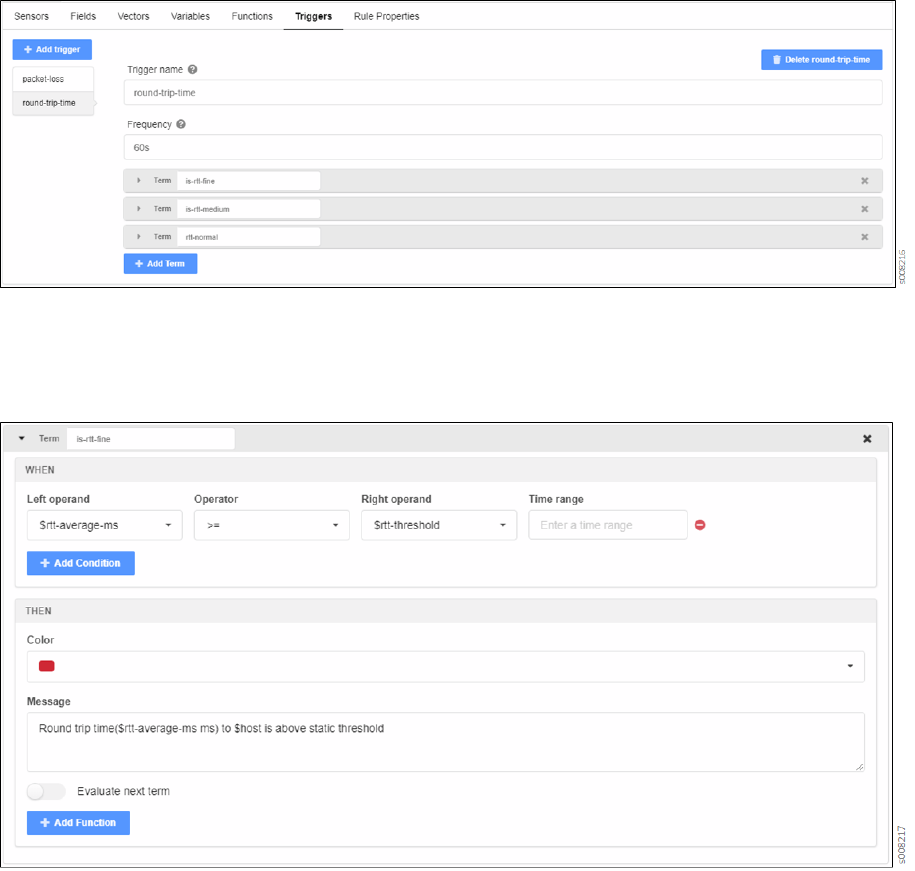
Figure 20: Triggers denion (round-trip-me)
Figure 21: Terms denion (is-r-ne)
81


Figure 24: Rule Properes denion (check-icmp-stascs)
Paragon Insights Outlier Detecon Example
This example describes how the check-outlier Paragon Insights network rule is congured to detect
outliers across the devices in a device group using the round trip me average response me.
The following secons show how to congure the applicable input parameters for each Paragon Insights
rule denion block (such as, Fields, Variables, and Triggers) using the Paragon Insights GUI. For more
informaon about how to congure a Paragon Insights rule, see Creang a New Rule using the Paragon
Insights GUI.
Sensors (check-outlier)
Figure 25 on page 83 shows the general properes congured for the check-outlier rule. Note that this
rule is a network rule.
Figure 25: General properes (check-outlier)
83

Fields (check-outlier)
Figure 26 on page 84 shows the eld congured for the check-outlier rule. This eld denes the
DBSCAN algorithm and rtt-xpath variable for outlier detecon. For informaon about the rtt-xpath
variable, see "Variables (check-outlier)" on page 84.
The results of the Paragon Insights outlier detecon algorithm are stored in a table in the mes series
database. Each row in the table contains outlier detecon output and metadata that is associated with a
parcular me series. You can use the informaon in the table to congure Paragon Insights rule
triggers. Each column in the table is idened by a unique name that starts with the user-dened outlier
detecon eld name. For example, you can use the
eld-name
-is-outlier (rtt-ol-is-outlier) and
eld-
name
-device (rtt-ol-device) column names to congure a trigger that detects outliers and produces a
message that indicates which specic device was determined to be the outlier (see "Triggers (check-
outlier)" on page 85.).
Figure 26: Fields denion (r-ol)
Variables (check-outlier)
Figure 27 on page 85 shows the variable congured for the check-outlier rule. This variable denes the
devices in the network from which Paragon Insights collects round trip average response me data for
the outlier detecon machine learning models.
84

Figure 27: Variables denion (r-xpath)
Triggers (check-outlier)
Figure 28 on page 85 shows the trigger congured for the check-outlier rule. The following terms are
congured for the icmp-outlier-detection trigger:
is-outlier-
detected
(see Figure 29 on page 86) When an outlier is detected, Paragon Insights returns a
value of 1 for the rtt-ol-is-outlier eld, and the Paragon Insights health status severity
level is set to major (red). This term also produces a message that indicates which
specic device was determined to be the outlier.
no-outlier
(See Figure 30 on page 86) Otherwise, Paragon Insights returns a value of 0, and the
severity level is set to normal (green).
Figure 28: Triggers denion (icmp-outlier-detecon)
85


Figure 31: Rule Properes denion (check-outlier)
Change History Table
Feature support is determined by the plaorm and release you are using. Use Feature Explorer to
determine if a feature is supported on your plaorm.
Release Descripon
3.1.0 Starng with HealthBot Release 3.1.0, you can choose the Holt-Winters predicon algorithm
Frequency Proles and Oset Time
IN THIS SECTION
Frequency Proles | 87
Oset Time Unit | 94
Frequency Proles
IN THIS SECTION
Conguraon Using Paragon Insights GUI | 89
87

Conguraon Using Paragon Insights CLI | 92
Apply a Frequency Prole Using the Paragon Insights GUI | 92
Apply a Frequency Prole Using the Paragon Insights CLI | 94
Frequency proles are a central locaon in which sensor and rule me frequencies can be managed. To
understand frequency proles, consider the following.
When dening rules in Paragon Insights (formerly HealthBot) you can:
• Dene mulple rules that use the same sensor
• Dene dierent sensor frequencies for each of the rules
• Apply all of these rules to the same device group/devices
This creates complexity in rule applicaon and frequency adjustments within the individual rules:
• A key, consisng of sensor-path for OpenCong and Nave GPB sensors, or the tuple of le and
table for iAgent sensors is used to idenfy the specic rules.
• Paragon Insights takes the minimum dened frequency for that sensor from the applied rules and
uses it to subscribe to, or fetch, data from the devices.
• This make it hard to idenfy what the data rate should be for that sensor. To do that, you would have
to go through the all the applied rules.
• A change in the sensor frequency of an applied rule might not take eect as intended.
To address these complexies, Paragon Insights needed a common place from which to control these
frequencies.
Starng in HealthBot Release 3.0.0, frequency proles can be created that allow you to manage sensor
and rule frequencies from a single locaon and then apply the proles in various locaons in Paragon
Insights. Applicaon of these proles allows for persistent and repeatable behavior in regard to
frequencies for rules, sensors, triggers, formulas, references, learning periods, and hold mes.
A sensor prole consists of a prole name and two oponal secons: the sensors secon and the non-
sensors secon. In each secon, an entry consists of a sensor or rule name and a frequency. Frequency
proles are applied to device groups or network groups.
The steps for conguraon are shown below.
88

Conguraon Using Paragon Insights GUI
Frequency proles are congured and managed in the Paragon Insights GUI or in the Paragon Insights
CLI. In the GUI, they are managed by navigang to the Sengs > Ingest Sengs page and selecng the
Frequency Prole tab from the le side of the page.
NOTE: While the secons of the frequency prole are both oponal, at least one secon must
be lled out per frequency prole if you want the applied prole to be able to do anything.
Add a Frequency Prole
1. Click the add (+) icon to add a prole.
The Add Frequency Prole window appears.
2. Give the prole a name such as Profile1
3. Click the add (+) icon to add sensors.
4. In the Sensor Name eld, enter the sensor name as per the following guidelines:
•
OpenCong Sensors
: Enter the OpenCong path for the desired sensor, such as /components or /
interfaces.
•
iAgent Sensors
: Enter the table name used in the sensor denion, such as ChassisAlarmTable or
REutilizationTable
•
SNMP
: Enter the sensor name such as npr_qmon_ext
•
BYOI
: Enter <
topic-name
/
rule-name
/
sensor-name
>, such as topic1/rule1/sensor1
5. In the Frequency eld, enter the appropriate frequency, such as 30seconds, 1minute, 2hours, and so on.
6. (Oponal) Click the add (+) icon to add non-sensors.
7. In the Rule Name eld, enter the rule name such as check-chassis-alarms.
8. In the Frequency eld, enter the appropriate frequency, such as 45seconds, 3minutes, 1hour, and so on.
Repeat steps 3 through 5 or 6 through 8 as desired for the prole.
9. Click the SAVE & DEPLOY buon to save and deploy the prole.
The new sensor prole is added to the list.
Edit a Frequency Prole
89
To edit an exisng frequency prole:
1. Click the Frequency Prole tab to view the Frequency Prole page.
2. Select the <
Prole Name
> that you want to modify.
3. Click the edit (pencil) icon to edit the prole.
The Edit Frequency Prole page appears, displaying the same elds that are presented when you add
a frequency prole.
4. Modify the parameters.
5. Click the SAVE buon to save the prole for later deployment or the SAVE & DEPLOY buon to
save and deploy immediately.
Delete a Frequency Prole
To delete a frequency prole:
1. Click Sengs > Ingest from the le-nav bar.
The Ingest Sengs page is displayed.
2. Click the Frequency Prole tab to view the Frequency Proles page.
3. Select the frequency prole that you want to delete, and click the delete (trash can) icon.
The CONFIRM DELETE FREQUENCY PROFILE pop-up appears.
Figure 32: Conrm Delete Frequency Prole Pop-up
4. Do any one of the following:
90

• Click Yes to delete the frequency prole from the database. However, the changes are not applied
to the ingest service.
NOTE:
• We recommended that you do not delete a frequency prole that is currently in use.
• Aer you delete a frequency prole from the database, you cannot apply that
frequency prole to another device group even if you have not deployed changes.
• You can also deploy changes to the ingest service or roll back the changes that you
have already deleted, from the PENDING CONFIGURATION page. For more
informaon, see "Commit or Roll Back Conguraon Changes in Paragon Insights" on
page 307.
• Select the Deploy changes check box and then click Yes to delete the frequency prole from the
database, and to apply the changes to the ingest service.
• (Oponal) Click No to cancel this operaon.
Clone a Frequency Prole
To clone a frequency prole:
1. Click the Frequency Prole tab to view the Frequency Prole page
2. Select the <
Prole Name
> that you want to clone and then click the Clone buon at the top-right
corner of the page.
The Clone Frequency Prole page appears.
3. Specify an appropriate name for the cloned prole.
4. Click OK to save your changes.
A clone of the prole is created and listed on the Frequency prole page.
Usage Notes:
•
Prole Entries
–Mulple entries can be congured in each secon.
•
Override
–Sensor or rule frequency dened within an applied frequency prole overrides those
dened within the individual rule or sensor.
•
Order of Precedence
–If a sensor or rule is dened in mulple frequency proles, each with dierent
frequency sengs, the minimum frequency value for the sensor or rule is used.
91

Conguraon Using Paragon Insights CLI
In the Paragon Insights CLI, you can congure the same frequency prole described above. An example
of the CLI conguraon needed to complete the example above looks like:
user@mgd-69ab987fbc6-pt9sh> show configuration healthbot ingest-settings frequency-profile
Profile1
sensor /components {
frequency 60seconds;
}
sensor /interface {
frequency 30seconds;
}
non-sensor net-topic/net-rule {
frequency 2minutes;
}
Apply a Frequency Prole Using the Paragon Insights GUI
Frequency proles are applied to Paragon Insights device groups or network groups. When you create or
edit a device or network group, you apply frequency proles by selecng them from the Ingest
Frequency secon of the Device Group denion. Figure 33 on page 93 below shows an example of
frequency proles being applied to a device group.
92


Apply a Frequency Prole Using the Paragon Insights CLI
An example of a device group CLI conguraon which includes a frequency prole and could be
deployed in Paragon Insights is shown below.
user@mgd-69ab987fbc6-pt9sh> show configuration healthbot device-group lab-group
devices router1;
ingest-frequency Profile1;
Oset Time Unit
IN THIS SECTION
Oset Used in Formulas | 95
Oset Used in References | 97
Oset Used in Vectors | 98
Oset Used in Triggers | 100
Oset Used in Trigger Reference | 101
The Paragon Insights (formerly HealthBot) oset me unit is used in conjuncon with the Frequency
Proles to automacally manage me range calculaons in various places within Paragon Insights rules.
To understand the Paragon Insights oset funcon, consider the following scenario:
In Paragon Insights, you can dene a rule which
• Uses a sensor to gather data with a frequency of 10 seconds
• Has a eld that calculates the mean every 60 seconds
If you later decide to increase the frequency of the sensor to 60 seconds, then calculang the mean
every 60 seconds would not make any sense. The result is that you would have to manually update the
eld calculaon any me up want to change the sensor frequency.
Starng with HealthBot Release 3.0.0, you can set the me range for the mean calculaon to a value of
6o, or 6oset, rather than 60s, or 60 seconds. Using an oset me value rather than a stac me value
tells Paragon Insights to automacally mulply the sensor frequency by the numeric value of the oset.
94
Thus, any change to sensor frequency will automacally be included in the me range calculaon for a
formula.
An oset me unit can be used in place of standard me units in the following me range locaons:
• Formulas
• References
• Vectors
• Trigger Frequency
• Trigger Term
Below we discuss GUI and CLI examples of how to congure the oset me unit in each of the locaons
menoned above.
Oset Used in Formulas
In this example, we are creang a rule,
Rule1
, with a sensor,
Sensor1
. The sensor frequency is set to 10
seconds.
In Figure 34 on page 96 below, you can see the Fields block denion for Rule1 with the Sensors block
denion framed in green. The formula,
formula1
, has a Time range value of
2o
95

Figure 34: Oset in a Formula
A CLI formaed conguraon snippet for the same eld looks like:
user@mgd-97bb5d555-sw87n$ show healthbot topic external rule rule1
synopsis "This rule is used only to demonstrate various rule features and concepts";
description "Demonstration Rule";
sensor Sensor1 {
open-config {
sensor-name /interfaces;
frequency 10s;
}
}
field field1 {
constant {
value 833;
}
type integer;
}
field formula1 {
formula {
max {
field-name "$field1";
96

time-range 2o;
}
}
type integer;
}
Usage Notes for Oset Used in Formulas
• An oset value applied to the me range of a formula mulplies the rule, sensor, or trigger frequency
of that rule.
• The result of this example is that the me range for the Max formula is now 2 mes the
Sensor1
frequency of 10 seconds, or 20 seconds (2 * 10s = 20s).
• If a frequency prole of 30 seconds is applied to the rule used in the example, then the resulng
me-range would be 60 seconds (2 * 30s = 60s).
• Oset me can be applied to the following formulas: latest, count, min, max, sum, mean, on-change,
and stdev.
Oset Used in References
In this example, there are two rules in play, but only one is shown. The unseen rule, Rule1, is in the topic
roung-engines and is named roung-engines (roung-engines/roung-engines). Rule1 has a frequency
of 20 seconds. Rule1 is referenced .
Rule2, shown in Figure 35 on page 98, is a network rule which has a reference eld named
ref1
. The
eld,
ref1
, references back to Rule1 through the Reference XPath Expression with a Time Range seng
of 3oset.
97

Figure 35: Oset Time Used in Reference Field
Usage Notes for Oset Used in References
• Oset values used in references mulply the frequency of the referenced rule by the oset value. In
this case, the 20 second frequency of Rule1 is mulplied by 3, resulng in a 60 second me-range (3
* 20s = 60s).
• If a frequency prole of 60 seconds (60s) was applied to Rule1, the me range for the reference
would increase to 180 seconds (3 * 60s = 180s).
Oset Used in Vectors
In this example, there are 3 rules at play. Rules
Rule1
and
Rule2
are not shown but are referenced by the
vector.
Rule1
is in topic line-cards and is named line-cards (line-cards/line-cards) and has a frequency of 20
seconds (20s).
Rule2
is in topic roung-engines and is named roung-engines (roung-engines/roung-engines) and
has a frequency of 30 seconds (30s).
98

In
Rule3
below, we have dened a vector,
vector1
that consists of 2 path references and 1 eld. The
vector has a Time Range dened as 3oset. Figure 36 on page 99 shows the vector block denion in
the Paragon Insights GUI.
Figure 36: Oset Time Used in Vector Block
Usage Notes for Oset Used in Vectors
• An oset value dened in the me range of a vector mulplies the sensor or rule frequency of the
referenced rule or sensor. If a eld from the same rule is used as the reference, then the frequency of
the rule containing the vector is used.
• When mulple references or elds are dened for a vector and oset me is used, the oset value is
applied to each path independently. So, for this example in which our oset value is 3 (3oset):
• The path reference to Rule1: “/device-group[device-group-name='Core4']/device[device-
id='R1']/topic[topic-name='line-cards']/rule[rule-name='line-cards']/memory” which has a
frequency of 20 seconds, would result in a me range of 60 seconds for the vector (3 * 20s =
60s).
• The path reference to Rule2: “/device-group[device-group-name='Core4']/device[device-
id='R1']/topic[topic-name='roung-engines']/rule[rule-name='roung-engines']/eld[slot='0']/
ref1” which has a frequency of 30 seconds, would result in a me range of 90 seconds for the
vector (3 * 30s = 90s).
99

NOTE: There are no spaces or line breaks in the path references. They are added to this
document only to enhance readability.
• The eld reference to formula1: Since formula1 is a normal eld used within the vector block, the rule
frequency of the current rule is used as a basis. So, the me range for formula1 is 30 seconds (3 *
10s = 30s).
• If a frequency prole of 60 seconds is applied to Rule1 (line-cards/line-cards), then the me range for
that path in the vector would be 180 seconds (3 * 60s = 180s).
• If a frequency prole of 120 seconds is applied to Rule2 (roung-engines/roung-engines), then the
me range for that path in the vector would be 360 seconds (3 * 120s = 360s).
• The me range for the eld reference, formula1, would remain the same as before at 30 seconds
unless a change is made to Rule3 or a frequency prole with a dierent me is applied to Rule3.
Oset Used in Triggers
In this example, we have one rule, Rule1. Figure 37 on page 101 below shows the trigger block
denion with the sensor block denion overlaid with a green border.
The rule,
Rule1
, has a sensor frequency of 10 seconds (10s) applied.
The trigger itself,
Trigger1
, has an oset frequency of 2 (2o) applied.
The trigger term,
term1
, has its own me range oset of 2 (2o) applied as well.
100

Figure 37: Oset Time Used in Trigger Block
Usage Notes for Oset Time Used in Triggers
• An oset value dened in trigger frequency mulplies the sensor or rule frequency. So, the oset
value of 2 in
trigger1
causes the trigger frequency to be interpreted as 20 seconds (2 * 10s = 20s)
because the sensor frequency of the rule is used as the basis.
• An oset value dened in a trigger term mulplies the trigger frequency value. So, the oset value of
2 in
term1
causes the term frequency to be interpreted as 40 seconds (2 * 20s = 40s).
Oset Used in Trigger Reference
In this example, we have 2 rules in the topic external, and one frequency prole,
prof1
.
The rules are:
•
external/test
: The
test
rule has a sensor named components which is an OpenCong sensor with a
sensor path of /components and a sensor frequency of 10 seconds.
It also has a trigger,
trig1
with a frequency of 2o or 2oset. The trigger has a term named
Term_1
,
which is not used in the example.
101
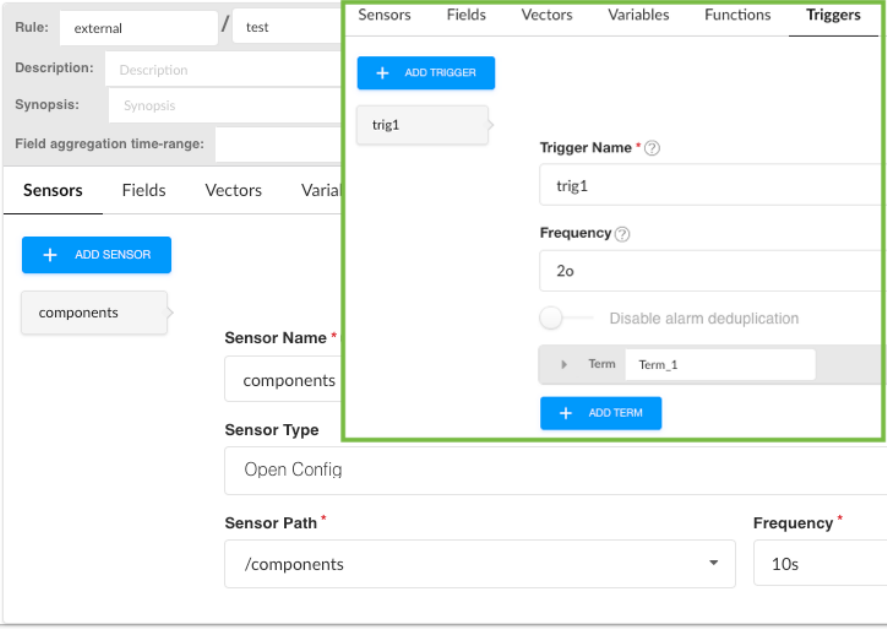
•
external/ref
: The
ref
rule is a non-sensor rule, which means that the rule uses a reference eld,
trigger_reference
, to reference the sensor dened in another rule; in this case
external/test
.
102

And the frequency prole is:
•
prof1
: The
prof1
prole sets the frequency for the
/components
sensor at 30 seconds.
103

104

2
CHAPTER
Paragon Insights Management and
Monitoring
Manage Paragon Insights Users and Groups | 107
Manage Devices, Device Groups, and Network Groups | 121
Paragon Insights Rules and Playbooks | 141
Monitor Device and Network Health | 172
Understand Resources and Dependencies | 206
About the Resources Page | 209
Add Resources for Root Cause Analysis | 212
Congure Dependency in Resources | 215
Example Conguraon: OSPF Resource and Dependency | 221
Edit Resources and Dependencies | 232
Filter Resources | 234
Upload Resources | 235
Download Resources | 236
Clone Resources | 236
Delete Resources and Dependencies | 237
Monitor Network Device Health Using Grafana | 239
Understanding Acon Engine Workows | 244
Manage Acon Engine Workows | 244

Alerts and Nocaons | 252
Generate Reports | 268
Use Exim4 for E-Mails | 282
Congure the Exim4 Agent to Send E-mail | 283
Manage Audit Logs | 284
Congure a Secure Data Connecon for Paragon Insights Devices | 286
Congure Data Summarizaon | 290
Modify the UDA, UDF, and Workow Engines | 299
Commit or Roll Back Conguraon Changes in Paragon Insights | 307
Logs for Paragon Insights Services | 309
Troubleshoong | 312
Paragon Insights Conguraon – Backup and Restore | 321

Manage Paragon Insights Users and Groups
IN THIS SECTION
Default User and First Login | 108
Default User Roles | 109
User Management | 109
Group Management | 114
LDAP Authencaon in Paragon Insights | 116
Password Recovery | 119
Limitaons | 120
HealthBot Release 3.0.0 employs role-based access control (RBAC) to control access to the user
interface, and tools and objects. RBAC is applied to user groups that are made up of a list of users.
The use of access controls within Paragon Insights (formerly HealthBot) allows you to grant one group of
users, like operators, read-only access to certain pages like Conguraon > Device Conguraon; while
granng a dierent group of users, like administrators, read-write access to that same page.
Starng with Release 4.0.0, Paragon Insights executes user management, authencaon, and
authorizaon through Identy and Access Management (IAM) service available in the 4.0.0 installaon
package.,
There are no changes in the installaon process. See Paragon Insights Installaon Guide for installaon
or migraon procedure.
In new installaons of Paragon Insights Release 4.0.0, a user can be registered through e-mail. This
mode of registraon requires you to perform addional steps at the me of installaon. For exisng
Paragon Insights installaons, you can register new users with username, without including an e-mail
address. For more informaon on rst login, see "Default User and First Login" on page 108.
NOTE: Starng from Paragon Insights Release 4.1.0, username is case insensive.
In Paragon Insights, there are two administrators: one is the default
admin
user who rst logs into
Insights aer a new installaon. The
admin
user has complete control over all of Insight’s access
107

controls. The other is sp-admin user who is created in the Paragon Insights interface. To know more
about roles in Paragon Insights, see "Default User Roles" on page 109.
Paragon Insights 4.0.0 also supports Lightweight Directory Access Protocol (LDAP) based
authencaon. The authorizaon data such as organizaonal ID, username, and password are stored
and managed in IAM. For more informaon, see "LDAP Authencaon in Paragon Insights" on page 116.
Default User and First Login
In standalone Paragon Insights installaons, the default username and password are set as
admin
and
Admin123!
, respecvely. The admin user has complete control over all of Paragon Insights’ access
controls. The credenals above are used for the rst login at the URL hps://
<Paragon Insights
hostname or IP>
:8080.
Upon successful rst login and before the admin user is granted access to the GUI, they are required to
create a new password. The Set Password window pops up and provides instrucons regarding
password length, capitalizaon, special characters, and so on. Once you save this password, a pop-up
window noes you that the password has been changed. From this me forward, the admin user logs
in with the new password.
If Paragon Insights is migrated from 3.x.x or earlier versions to 4.0.0 version, the admin user creates
other users and assigns them roles and an inial password in the Administraon > User Management
page. The users created with sp-admin and sp-operator roles can login for the rst me with their
username
by entering the inial password provided by the
admin
user.
NOTE: All users must change their password aer the rst login.
To change password:
1. Click the circle with the rst leer of your username at the top right corner of the interface.
2. Click change password in the drop-down menu.
A Change Password window appears.
3. Enter your current password. Enter your new password and re-enter your new password to conrm.
Passwords must be at least 8 characters long and must contain uppercase leers, lowercase leers,
numbers, and special characters.
4. Click OK.
A window noes that your password is changed successfully.
108

Starng with standalone Paragon Insights 4.0.0 installaons, the admin user can register a user with an
e-mail address if Insights is congured for this registraon method during installaon. The registered
user gets a login link in their inbox that expires aer 24 hours. When they click on the link, a Set
Password window appears where they can set a new password before they log into Paragon Insights.
Default User Roles
In Paragon Insights 4.0.0, the hbadmin group in earlier releases is converted to the sp-admin role
whereas the hbmonitor, hbcong, and hboperator groups are merged into the sp-operator role.
Paragon Insights is shipped with two pre-dened user roles:
•
sp-admin
— The user gets read and write access to add resources such as device groups, network
groups, rules and playbooks, congure data summarizaon proles, create backup of Paragon
Insights conguraon or me series database, and the ability to manage users and groups.
•
sp-operator
— Provides login capability and the ability to read-only access to read and observe any
congured enty in Insights.
None of the pre-dened user roles can be changed or removed.
User Management
The User Management page is the rst page shown when you navigate to Administraon > User
Management from the le navigaon bar. This page is used to:
• View a list of current Paragon Insights users
The list shows user details including username, role, status, and provider type. User status can be
acve (green) or inacve (red).
• Add new users
Click the + to bring up the Create User window. Enter the following details.
NOTE: In Paragon Insights Release 4.0.0, an sp-admin can map a user to a role without
creang user groups. The sp-admin can also create user groups, associate roles to user groups
and then, add users to the user groups.
109

Table 4: Create User Fields for Installaons without E-mail Registraon
Fields Descripon
Username Enter a username of maximum 32 characters. The
username
is used to log into the
Paragon Insights portal.
NOTE: Starng from Paragon Insights Release 4.1.0, username is case insensive.
First Name Enter the rst name of the user. You cannot exceed 32 characters.
Last Name Enter the last name of the user. You cannot exceed 32 characters.
Status Enable or disable the user. If you disable the user, they cannot log into the Paragon
Insights portal.
Provider Type There are two provider types — Local (IAM) and LDAP.
You can choose Local to congure users in IAM or choose LDAP to map user to LDAP
user group.
(Oponal)
Mapping Provider
Group
If you choose the provider type as LDAP, you can enter the LDAP user group name in
this eld.
Password Enter a password for the user.
Passwords must be at least 8 characters long and must contain uppercase leers,
lowercase leers, numbers, and special characters.
A password must be unique and must not be previously used passwords.
Role Select mulple roles at the le-side panel and click the right arrow buon to add the
roles to the user.
The roles are sp-admin, sp-operator, or a custom role with select create, read, update,
and delete access permissions.
If you congured Paragon Insights to register users using e-mail address, you must congure SMTP
sengs in the portal before adding users. The SMTP conguraon is used to send user account
related e-mails, such as when user changes password, user resets password, admin user adds a new
user, and so on.
110

NOTE: If you want to congure the SMTP sengs, you must congure the environment
variables export HB_IAM_SKIP_MAIL_VERIFICATION=false and export HB_IAM_DISABLE_SMTP_SETTINGS=false
during Paragon Insights installaon. See installaon guide for more informaon.
To congure SMTP sengs:
1. Select Administraon > Authencaon > SMTP Sengs.
The SMTP Sengs page appears. Fill in the details described in Table 5 on page 111.
Table 5: Fields in SMTP Sengs
Fields Descripon
Server Address Enter the SMTP server address.
For example, smtp.domain.com
TLS Toggle the switch on to enable TLS, if you want to encrypt the e-mails sent to
your users’ account from Paragon Insights.
Port Number Enter the port number.
The standard port number is set to 25 if TLS is disabled and is set to 587 if you
enable TLS in SMTP sengs.
SMTP Authencaon
SMTP Authentcaon
(Oponal)
Enable SMTP authencaon to allow only veried users to send e-mails to or
receive e-mails from the Paragon Insights applicaon.
Username Enter the username to be used for authencaon. The username must not
exceed 32 characters.
NOTE: Starng from Paragon Insights Release 4.1.0, username is case
insensive.
Password Enter a password.
111

Table 5: Fields in SMTP Sengs
(Connued)
Fields Descripon
Conrm Password Re-enter the password.
From Name If you did not enable SMTP authencaon, then you must enter this eld.
This name appears as sender’s name to the e-mail recipients.
From Email Address Enter the e-mail address from which messages from Paragon Insights must be
sent to recipients.
The syntax is e[email protected]
Test SMTP Sengs
Email Address Enter your e-mail adress to check if SMTP sengs congured in previous
elds work as intended.
Click Send Test Email. If you receive an e-mail from Paragon Insights in the
inbox of the e-mail address entered in this eld, then you have successfully
congured SMTP sengs.
2. Click Save.
The SMTP Sengs for Paragon Insights is complete. You can now register users using their e-mail
address.
To register a user using e-mail address:
1. Select Administraon > User Management > User in the le navigaon bar.
The Users page appears.
2. Click on the + icon to add a new user.
The Create User page appears. Fill in the following details.
112

Table 6: Create User Fields for Installaons with E-mail Registraon
Fields Descripons
First Name Enter the rst name of the user. You cannot exceed 32 characters.
Last Name Enter the last name of the user. You cannot exceed 32 characters.
Status Enable or disable the user. If you disable the user, they cannot log into the Paragon
Insights portal.
Username (E-mail) Enter the e-mail address of the user that will be used to log into the Paragon Insights
portal.
Role Select mulple roles at the le-side panel and click the right arrow buon to add the
roles to the user.
The roles are sp-admin, sp-operator, or a custom role with select create, read, update,
and delete access permissions.
3. Click OK.
The user you added is listed in the Users page.
• Edit exisng users
Select an exisng user by clicking anywhere on that user’s line in the list. Then click the Edit User
(Pencil) icon to bring up the Edit User window. You can change any parameter except the username
and the Provider Type.
• Delete a user
Select an exisng user by clicking anywhere on that user’s line in the list. Then click the Delete User
(Trash Can) icon. Conrm the acon and the user is deleted.
NOTE:
• If you set a user’s status to inacve or delete that user, they are immediately prevented from
logging in to Paragon Insights through the login page.
113

You can also export (backup) user conguraons and restore the conguraons in Paragon Insights. The
backup and restore feature is not applied to pre-canned roles. For more informaon, see "Paragon
Insights Conguraon – Backup and Restore" on page 321.
Group Management
A user group is a collecon of roles to which a Paragon Insights user can be assigned. The roles within a
user group dene the access (read-only or read-write) that all members of the group have in common. In
other words, user groups are where RBAC controls are applied.
The User Groups page is accessed by navigang to Administraon > User Management from the le-
nav and selecng User Groups on the le side of the User Management page.
• View a list of current Paragon Insights user groups
The list shows user group details including group name and descripon.
• Add new user groups
Click the + to bring up the Add Group window.
Starng in HealthBot Release 3.1.0, RBAC has been enhanced to include the roles selector helper.
The roles selector helper appears when you add or edit a user group. See Figure 38 on page 115.
114

Figure 38: Add User Group
115

• Edit exisng user groups
Select an exisng user group by clicking anywhere on that group’s line in the list. Then click the Edit
User (Pencil) icon to bring up the Edit
<groupname>
window.
NOTE: When you add or edit a user group, the window has secons called System Roles and
GUI Roles under the Selected Roles pull-down. These secons show the specic read-only (R)
or read-write (W) permissions that are assigned to the group as a result of the selecons
made in the ROLES SELECTOR HELPER.
• Delete a user group
Select an exisng user group by clicking anywhere on that group’s line in the list. Then click the
Delete User (Trash Can) icon. A conrmaon window appears. Conrm the acon (Save and Deploy)
to complete the deleon. The pre-dened user groups hbdefault and hbadmin cannot be deleted.
WARNING: Adding and eding user groups in Paragon Insights is an advanced feature
that requires a deep understanding of the available roles and how they apply to RBAC.
We recommend that you use only the Role Selector check-boxes to add or remove
permissions. We do not recommend that you add or remove individual system or GUI
roles.
LDAP Authencaon in Paragon Insights
LDAP users can log into Paragon Insights GUI using LDAP credenals aer an sp-admin congures
LDAP sengs in Paragon Insights. The sp-admin must also map the LDAP user group to the Paragon
Insights user group. In Paragon Insights Release 4.0.0 and later releases, Acve Directory service
installed on Windows Server 2012 R2 and OpenLDAP version 2.4 as the protocol are validated for
LDAP implementaon.
A typical workow of LDAP-based authencaon involves the following steps:
1. An LDAP administrator congures LDAP group in an external server and adds users to the LDAP
group.
2. The sp-admin congures LDAP sengs in Paragon Insights.
3. The sp-admin creates a user group for LDAP users in Paragon Insights Release 4.0.0 interface, maps
this user group to the exisng LDAP user group, and then assigns roles to that user group.
116

NOTE: The Paragon Insights user group and LDAP user group must have the same name.
During authencaon, the LDAP server produces a list of LDAP groups associated with the user. The
Paragon Insights IAM service checks for the corresponding user group name in Paragon Insights and
generates roles associated with that Paragon Insights user group. The IAM service then converts the
roles into a JSON Web Token (JWT) that is used for authorizing the LDAP user in Paragon Insights.
NOTE: If a user is congured both in LDAP and IAM (locally), then LDAP takes priority over IAM
during authencaon. When the user tries to login, Paragon Insights checks the user details rst
in LDAP and then in IAM.
To congure LDAP sengs in Paragon Insights:
1. Click Administraon > Authencaon > LDAP Sengs opon in the le navigaon bar.
2. Enter the necessary elds in the LDAP Sengs page.
The following table describes the aributes in the LDAP Sengs page.
Table 7:
Congure LDAP to Integrate with Paragon Insights
Aributes Descripon
LDAP Server
Server Address Enter the LDAP server url.
For example, ldap.example.net.
SSL Enable SSL to encrypt the LDAP channel.
Port Number Enter the port number for the LDAP server.
The default port number if SSL is enabled is 636 and the default port without SSL is
389.
LDAP Authencaon
117

Table 7: Congure LDAP to Integrate with Paragon Insights
(Connued)
Aributes Descripon
Authencaon Method The authencaon method is set to
Simple
. The password sent from the client to
bind to the LDAP server is plain text.
Base Domain Name Enter the domain name that constutes the search base for querying the LDAP
server.
For example: dc=
mycompany
, dc=
net/com
.
Bind Domain Name Enter the user name congured for LDAP authencaon.
For example: user@mycompany.net.
Bind Password Enter a password for LDAP authencaon.
User Opons (Oponal)
User Aribute Seng a user aribute is oponal. This lter improves the search funconality on
the LDAP server using the specied aribute name.
User Filter Specify the objectClass aribute to lter the type of enes that can access
Paragon Insights.
For example,
Person
as a user lter.
3. Click Save.
The conguraon sengs of LDAP server in Paragon Insights is complete.
Aer conguring LDAP sengs, the sp-admin must create an LDAP user group in Paragon Insights to
map the users created in LDAP server to Paragon Insights. The LDAP group created in Paragon Insights
allows sp-admins to map roles for LDAP users.
To map an LDAP group to Paragon Insights user group:
1. Click Administraon > User Management > User Groups opon in the le navigaon bar.
The User Group page appears.
2. Click the plus icon to create a new user group.
118

The Create User Group page appears.
3. Enter a group name and select Provider Type as LDAP from the drop down menu.
The Mapping Provider Group secon appears.
4. In the Mapping Provider Group eld, enter the LDAP group name.
5. Select the roles to be associated with the LDAP group in Paragon Insights and click OK.
The users congured in LDAP server can log into Paragon Insights by entering their LDAP credenals.
The resources and pages accessible to the LDAP user depends on the permissions granted in the role
mapped through Paragon Insights.
Password Recovery
The default admin user does not require an e-mail address to access the interface in standalone
deployment. If the inial password set by an admin user is lost, it can be recovered by a system
administrator who has access to the physical server or virtual machine that hosts the Paragon Insights
applicaon. The system administrator has to run the following curl command in any shell in one of the
nodes in the Kubernetes cluster.
Curl command to reset Paragon Insights admin user credenal using IAM service token.
curl -k --request POST 'https://{{server-ip}}:{{port}}/iam/reset-password' --header 'x-service-token: '$
(kubectl get secret -n {{namespace}} $(kubectl get sa -n {{namespace}} iam -o jsonpath='{.secrets[0].name}')
-o jsonpath='{.data.token}' | base64 --decode)'' --header 'x-service-scope: {}' --header 'Content-Type:
application/json' --data '{
"user_name" : "{{username}}",
"new_password" : "{{password}}"
}'
The IAM service validates the token and resets the password for the admin user.
NOTE: The port number for standalone Paragon Insights deployment is 8080 and the namespace
is healthbot. The server-ip in the POST request body denotes the virtual IP address you
congured for Paragon Insights services during the installaon.
There is currently no self-service type of lost password mechanism for users registered without an e-
mail address. Password reset must be done manually by an administrator with read-write access to the
User Management page. The administrator must edit the user, change the password, and then nofy the
119

user by appropriate means. The default password expiry for users with sp-admin and sp-operator roles is
180 days.
To recover password of user accounts registered with e-mail address:
1. Enter your username (e-mail address) in the Paragon Insights login page.
2. Place the cursor in the password eld.
The Forgot Password? link appears beneath the Log in buon.
3. Click on the Forgot Password? link.
A Forgot Password window appears displaying the message that an e-mail with link to reset
password is sent to your account.
4. Click on the Reset your password buon in your account recovery e-mail.
The reset password link expires aer 24 hours.
5. In the Set Password window, enter a new password and enter the same password in the Conrm
Password eld.
Passwords must be at least 8 characters long and must contain uppercase leers, lowercase leers,
numbers, and special characters.
A password must be unique and must not be previously used passphrases.
6. Click OK.
You will receive a second e-mail nofying you that your password is changed. Log into Paragon
Insights using your latest password.
Limitaons
In HealthBot Release 3.1.0, the RBAC implementaon is limited in some ways:
• The available roles, such as R-Devices, W-Devices, R-Datastore, etc. are all pre-dened. There is no
way to add new roles or delete exisng roles.
• All roles are endpoint driven, not specic to any resource. This means that if you have read
permission for devices, you can read all devices in the system. There is no means to restrict the read
access to a subset of devices.
• Roles are permissive in nature. You cannot create a role that blocks access to any given endpoint
such as rules. If a user is created but not given any group membership, they will not be able to access
the Paragon Insights GUI.
120

• RBAC is currently limited to API service. This means that if you have read-only access to a page such
as Conguraon > Devices, you can see the enre page and interact with all of its controls. You could
even go through the moons of creang a device in the GUI. However, when you click SAVE or SAVE
& DEPLOY an API is called and it will recognize that you do not have the required permission to
create a device. Errors are displayed at that me.
• If you migrate data from your exisng 2.1.X installaon to your 3.0.0 or later installaon, user data is
not migrated. Any exisng users must be recreated manually, by the admin user, aer migraon.
Change History Table
Feature support is determined by the plaorm and release you are using. Use Feature Explorer to
determine if a feature is supported on your plaorm.
Release Descripon
4.0.0 Starng with Release 4.0.0, Paragon Insights executes user management, authencaon, and
authorizaon through Identy and Access Management (IAM) service available in the 4.0.0 installaon
package.
3.1.0 Starng in HealthBot Release 3.1.0, RBAC has been enhanced to include the roles selector helper
3.0.0 HealthBot Release 3.0.0 employs role-based access control (RBAC) to control access to the user
interface, and tools and objects.
RELATED DOCUMENTATION
Paragon Insights API Guide
Manage Devices, Device Groups, and Network
Groups
IN THIS SECTION
Adding a Device | 122
Eding a Device | 129
Adding a Device Group | 129
121

Eding a Device Group | 136
Conguring a Retenon Policy for the Time Series Database | 136
Adding a Network Group | 137
Eding a Network Group | 140
Use the appropriate Conguraon pages from the le-navigaon menu to manage devices, device
groups, and network groups. Paragon Insights (formerly HealthBot) supports both Junos devices by
default and third party vendor devices with the required license installed. You must add a device to one
or more device groups or create a network group before you can apply Paragon Insights rules and
playbooks to a device. Network groups allow you to correlate health status data between mulple
devices across the network. For example, you can create a network group that monitors the ping mes
between two or more devices and noes you if the ping mes are too high.
Adding a Device
To add a device:
1. Click the Conguraon > Device opon in the le-nav bar.
2. Click the add device buon (+).
3. Enter the necessary values in the text boxes and select the appropriate opons for the device.
The following table describes the aributes in the Add a Device window:
Aributes Descripon
Name Name of the device. Default is hostname. (Required)
Hostname / IP Address / Range Hostname or IP address of a single device. If you are
providing a range of IP addresses, enter the IP
address for the device that marks the start and end
of the address range. (Required)
122
(Connued)
Aributes Descripon
System ID to use for JTI Unique system idener required for JTI nave
sensors. Junos devices use the following format:
<
host_name
>:<
j_ip_address
>
When a device has dual roung engines (REs), it
might send dierent system IDs depending on which
RE is primary. You can use a regular expression to
match both system IDs.
Flow/IFA Source IPs Enter the IP address(es) that this device uses to send
NetFlow data to Paragon Insights.
The IP address or addresses are used to send probe
packets for ow monitoring using Inband Flow
Analyzer (IFA).
If there are more than one IP address, separate them
with a comma.
OpenCong Port Number Port number required for JTI OpenCong sensors.
The default value is 32767.
iAgent Port Number Port number required for iAgent. The default value is
830.
123

(Connued)
Aributes Descripon
Vendor Lists the vendor or supplier of the device you are
using.
The operang system you can select from the OS
drop-down list depends on the vendor you select
from the Vendor drop-down list.
The following are the list of opons you can choose
from.
• Select Juniper from the vendor drop-down list to
select either Junos or Junos Evolved operang
systems from the OS drop-down list.
•
Select CISCO from the Vendor drop-down list to
select either IOSXR or NXOS operang systems
from the OS drop-down list.
With Paragon Insights Release 4.0.0, NXOS OS is
also supported.
NOTE: If you plan to use Cisco IOS XR devices,
you must rst congure the telemetry. For more
informaon, see Paragon Insights Installaon
Requirements
• Select Arista from the Vendor drop-down list to
select EOS operang system from the OS drop-
down list.
• Select Paloalto from the Vendor drop-down list to
select PANOS operang system from the OS
drop-down list.
• Select Linux from the Vendor drop-down list and
you can enter the name of the operang system
in the OS eld.
• If you select Other Vendor, the Vendor Name and
OS Name elds are enabled. You can enter the
name of the vendor of your choice in the Vendor
124
(Connued)
Aributes Descripon
Name eld and the corresponding operang
system for the vendor in the OS eld.
Consider the following example. If the operang
system of a vendor (listed in the Vendor drop-
down list) is not listed (in the OS drop-down list),
you can select the Other Vendor opon to enter
name of the vendor and operang system of your
choice.
Starng with Paragon Insights Release 4.0.0, Paragon
Insights supports Arista Networks, Paloalto
Networks, and Linux vendors.
Timezone Timezone for this device, specied as
+
or
-
hh:mm.
For example, +07:00
Syslog Source IPs List of IP addresses for the device sending syslog
messages to Paragon Insights. For example,
10.10.10.23, 192.168.10.100.
Syslog Hostnames List of hostnames for the device sending syslog
messages to Paragon Insights. For example,
router1.example.com.
SNMP
SNMP Port Number Port number required for SNMP. The port number is
set to the standard value of 161.
SNMP Version Select either v2c or v3 in the drop-down menu.
125

(Connued)
Aributes Descripon
SNMP Community This eld appears if you selected v2c in SNMP
Version eld.
Enter an SNMP Community string if you congure
SNMPv2c for traps and ingest.
In SNMPv2c, Community string is used to verify the
authencity of the trap message issued by the SNMP
agent (devices such as routers, switches, servers, and
so on).
Authencaon None This eld appears if you selected v3 in SNMP Version
eld.
Enable this opon on if you want to set SNMPv3
authencaon to
None
.
Protocol None This eld appears if you selected v3 in SNMP Version
eld.
Enable this opon on if you want to set SNMPv3
protocol to
None
.
SNMPv3 Username This eld appears if you selected v3 in SNMP Version
eld.
Enter a username for trap nocaons. The
username
you enter here is checked against the
SNMPv3 users congured in Paragon Insights.
If there is a match, the trap message is further
processed else, the message is dropped.
Context Engine ID This eld appears if you selected v3 in SNMP Version
eld.
Enter the
Engine ID
of the device (SNMP agent) that
sends the trap nocaon.
For inform nocaons, the
Engine ID
must be set to
that of Paragon Insights.
126

(Connued)
Aributes Descripon
SNMPv3 Authencaon Protocol This eld appears if you selected v3 in SNMP Version
eld and disabled
Authencaon None
.
Select an authencaon protocol from the drop-
down menu.
SNMP authencaon protocol hashes the SNMP
username
with the passphrase you enter. The hashed
output is sent along with the trap nocaon
message. Paragon Insights again hashes the
username
with the passphrase you entered for
authencaon. If the output matches, the trap
nocaon is further processed.
SNMPv3 Authencaon Passphrase This eld appears if you selected v3 in SNMP Version
eld and disabled
Privacy None
.
Enter a passphrase for SNMPv3 authencaon.
SNMPv3 Privacy Protocol Select a privacy protocol from the drop-down menu.
Privacy algorithm encrypts the trap nocaon
message with the protocol passphrase so that the
message cannot be read by an unauthorized
applicaon in the network.
SNMPv3 Privacy Passphrase This eld appears if you selected v3 in SNMP Version
eld and disabled Privacy None.
Enter a passphrase to encrypt the trap nocaon.
Source IP Address This eld appears if you selected v3 in SNMP Version
eld.
Enter the source IP address of the device.
If you use NAT or an SNMP Proxy, the
Context
Engine ID
cannot be used to idenfy the device that
send trap nocaons. In such cases, the source IP
address of the device is used to verify the source of
trap nocaons.
127

(Connued)
Aributes Descripon
Authencaon (Required either here or at Device Group level)
Password
Username Authencaon username.
Password Authencaon password.
SSL
Server Common
Name
Server name protected by the
SSL cercate.
CA Prole* Choose the applicable CA
prole(s) from the drop-down
list.
Local Cercate* Choose the applicable local
cercate prole(s) from the
drop-down list.
SSH
SSH Key Prole* Choose the applicable SSH key
prole(s) from the drop-down list.
Username Authencaon username.
Outbound SSH
Reset The reset opon is set by default. If you disabled
outbound SSH for this device, you can enable it back
by selecng Reset in the dropdown menu.
Disable You can disable outbound SSH connecons for a
device by selecng Disable from the dropdown
menu.
*To edit or view details about saved security proles, go to the Security page under the Sengs
menu in the le-navigaon bar.
128

4. Click Save to save the conguraon or click Save and Deploy to save and deploy the conguraon.
For informaon on how to use the Devices table, see "Monitor Device and Network Health" on page
172.
Eding a Device
To edit a device:
1. Click the Conguraon > Device opon in the le-nav bar.
2. Click anywhere on the line that contains the device name in the table under DEVICES.
You can search and lter the device names in the table.
3. Click the Pencil (Edit Device) icon.
4. Modify the aributes, as needed.
See "Adding a Device" on page 122 for a descripon of each aribute.
5. Click Save to save the conguraon or click Save and Deploy to save and deploy the conguraon.
For informaon on how to use the Devices table, see "Monitor Device and Network Health" on page
172.
6. (Oponal) A device can be deleted by clicking the Trash Can (Delete Device) icon with the device
selected.
Adding a Device Group
To add a device group:
1. Click the Conguraon > Device Group opon in the le-nav bar.
2. Click the add group buon (+).
The Add Device Group page appears.
3. Congure the device group with the details described in Table 8 on page 130.
4. Do one of the following:
• Click Save—Paragon Insights saves the conguraon but does not iniate operaons based on the
saved conguraon.
You can use this opon to save make mulple changes in Paragon Insights conguraons and
commit the changes in bulk or to roll back the changes. See "Commit or Roll Back Conguraon
Changes in Paragon Insights" on page 307 for more informaon.
• Click Save & Deploy—Paragon Insights saves and deploys the conguraon.
129

The conguraon changes are applied to the IFA ingest service in Paragon Insights.
Table 8: Fields in Device Group Conguraon
Aributes Descripon
Name Name of the device group. (Required)
Descripon Descripon for the device group.
Devices Add devices to the device group from the drop-down list. (Required)
Starng in Paragon Insights Release 4.0.0, you can add more than 50 devices per
device group. However, the actual scale of the number of devices you can add
depends on the available system resources.
For example, consider that you want to create a device group of 120 devices. In
releases earlier than release 4.0.0, it is recommended that you create three device
groups of 50, 50, and 20 devices respecvely. With Paragon Insights Release 4.0.0,
you just create one device group.
Nave Ports (Nave GPB sensors only) List the port numbers on which the Junos Telemetry
Interface (JTI) nave protocol buers connecons are established.
Flow Ports (NetFlow sensors only) List the port numbers on which the NetFlow data is received
by Paragon Insights. The port numbers must be unique across the enre Paragon
Insights installaon.
Syslog Ports Specify the UDP port(s) on which syslog messages are received by Paragon Insights.
Retenon Policy Select a retenon policy from the drop-down list for me series data used by root
cause anaylsis (RCA). By default, the retenon policy is 7 days.
Disable Trigger
Acon Scheduler
(for a parcular
device group)
By default, this eld is marked False because the opon to add a UDA scheduler in
Trigger Acon page is enabled.
You can set this eld to True if you want to disable UDA scheduler sengs in Trigger
Acon page.
130

Table 8: Fields in Device Group Conguraon
(Connued)
Aributes Descripon
Reports In the Reports eld, select one or more health report prole names from the drop-
down list to generate reports fo the device group. Reports include alarm stascs,
device health data, as well as device-specic informaon (such as hardware and
soware specicaons).
To edit or view details about saved health report proles, go to the System page under
the Sengs menu in the le-nav bar. The report proles are listed under Report
Sengs.
For more informaon, see "Alerts and Nocaons" on page 252.
SNMP
SNMP Port Number Port number required for SNMP. The port number is set to the standard value of 161.
SNMP Version Select either v2c or v3 in the drop-down menu.
• If you select v2c, the SNMP Community name eld appears. The string used in v2c
authencaon is set to
public
by default. It is recommended that users change the
community string.
• If you select v3, you are given an opon to set username, authencaon and
privacy methods, and authencaon and privacy secrets.
Nocaon Ports Enter nocaon ports separated by comma.
Paragon Insights listens on these nocaon ports for trap nocaon messages.
SNMP Community
This eld appears if
you selected v2c in
SNMP Version eld.
Enter an SNMP Community string if you congure SNMPv2c for traps and ingest.
In SNMPv2c, Community string is used to verify the authencity of the trap message
issued by the SNMP agent.
Authencaon
None
This eld appears if you selected v3 in SNMP Version eld.
Enable this opon on if you want to set SNMPv3 authencaon to
None
.
131

Table 8: Fields in Device Group Conguraon
(Connued)
Aributes Descripon
Protocol None This eld appears if you selected v3 in SNMP Version eld.
Enable this opon on if you want to set SNMPv3 protocol to
None
.
SNMPv3 Username This eld appears if you selected v3 in SNMP Version eld.
Enter a username for trap nocaons. The
username
you enter here is checked
against the SNMPv3 users congured in Paragon Insights.
If there is a match, the trap message is further processed else, the message is dropped.
SNMPv3
Authencaon
Protocol
This eld appears if you selected v3 in SNMP Version eld and disabled
Authencaon None
.
Select an authencaon protocol from the drop-down menu.
SNMP authencaon protocol hashes the SNMP
username
with the passphrase you
enter. The hashed output is sent along with the trap nocaon message. Paragon
Insights again hashes the
username
with the passphrase you entered for
authencaon. If the output matches, the trap nocaon is further processed.
SNMPv3
Authencaon
Passphrase
This eld appears if you selected v3 in SNMP Version eld and disabled
Privacy None
.
Enter a passphrase for SNMPv3 authencaon.
SNMPv3 Privacy
Protocol
Select a privacy protocol from the drop-down menu.
Privacy algorithm encrypts the trap nocaon message with the protocol passphrase
so that the message cannot be read by an unauthorized applicaon in the network.
SNMPv3 Privacy
Passphrase
This eld appears if you selected v3 in SNMP Version eld and disabled Privacy None.
Enter a passphrase to encrypt the trap nocaon.
132

Table 8: Fields in Device Group Conguraon
(Connued)
Aributes Descripon
Summarizaon To improve the performance and disk space ulizaon of the Paragon Insights me
series database, you can congure data summarizaon methods to summarize the raw
data collected by Paragon Insights. Use these elds to congure data summarizaon:
Time Span The me span (in minutes) for which you want to group the data
points for data summarizaon.
Summarizaon
Proles
Choose the data summarizaon proles from the drop-down list
for which you want to apply to the ingest data. To edit or view
details about saved data summarizaon proles, go to the Data
Summarizaon Proles page under the Sengs menu in the le-
nav bar.
For more informaon, see "Congure Data Summarizaon" on page 290.
Ingest Frequency Select exisng Ingest Frequency Proles to override rule or sensor frequency sengs.
Authencaon(Required here or at Device level)
Password
Username Authencaon user name.
Password Authencaon password.
SSL
Server Common Name Server name protected by the SSL cercate.
CA Prole* Choose the applicable CA prole(s) from the drop-down list.
Local Cercate* Choose the applicable local cercate prole(s) from the
drop-down list.
SSH
SSH Key Prole* Choose the applicable SSH key prole(s) from the drop-down list.
Username Authencaon username.
133

Table 8: Fields in Device Group Conguraon
(Connued)
Aributes Descripon
Nocaons
• You can use the Alarm Manager feature to organize, track, and manage KPI event
alarm nocaons received from Paragon Insights devices.
• To receive Paragon Insights alarm nocaons for KPI events that have occurred
on your devices, you must rst congure the nocaon delivery method for each
KPI event severity level (Major, Minor, and Normal). Select the delivery method
from the drop-down lists.
To edit or view details about saved delivery method proles, go to the System page
under the Sengs menu in the le-nav bar. The delivery method proles are listed
under Nocaon Sengs.
For more informaon, see "Alerts and Nocaons" on page 252.
Logging
Conguraon
You can collect dierent severity levels of logs for the running Paragon Insights
services of a device group. Paragon Insights Release 4.0.0 supports collecng log data
for SNMP nocaon.
Use these elds to congure which log levels to collect:
Global Log
Level
From the drop-down list, select the level of the log messages that you
want to collect for every running Paragon Insights service for the
device group. The level is set to error by default.
Log Level for
specic
services
Select the log level from the drop-down list for any specic service
that you want to congure dierently from the Global Log Level
seng. The log level that you select for a specic service takes
precedence over the Global Log Level seng.
For more informaon, see "Logs for Paragon Insights Services" on page 309.
134

Table 8: Fields in Device Group Conguraon
(Connued)
Aributes Descripon
Publish You can congure Paragon Insights to publish sensor and eld data for a specic
device group:
Desnaons Select the publishing proles that dene the nocaon type
requirements (such as authencaon parameters) for publishing the
data.
To edit or view details about saved publishing proles, go to the System
page under the Sengs menu in the le-nav bar. The publishing
proles are listed under Nocaon Sengs.
Field Select the Paragon Insights rule topic and rule name pairs that contain
the eld data you want to publish.
Sensor (Device group only) Select the sensor paths or YAML tables that
contain the sensor data you want to publish. No sensor data is
published by default.
Outbound SSH
Ports Enter one or more port numbers for outbound SSH connecons for this device group.
IFA Deploy Nodes Enter IP address of the node where the IFA ingest must be deployed in Paragon
Insights.
IFA Ports Enter the UDP port number on which Paragon Insights receives IFA sensor data.
Range: 1 to 65,535.
Root Cause Analysis
RCA Support RCA is enabled by default. Disable RCA if you do not want the device group to be a
part of root cause analysis.
Exclude Resources Exclude Resources eld allows you to select device resources that must be excluded
from resource and dependency formaon.
135

Eding a Device Group
To edit a device group:
1. Click the Conguraon > Device Group opon in the le-nav bar.
2. Click on the device group name under DEVICE GROUPS.
3. Click on the Pencil (Edit Device Group) icon.
4. Modify the aributes, as needed.
See "Adding a Device Group" on page 129 for a descripon of each aribute.
5. Click Save to save the conguraon or click Save and Deploy to save and deploy the conguraon.
For informaon on how to use the device group cards, see "Monitor Device and Network Health" on
page 172.
6. (Oponal) A device group can be deleted by clicking the Trash Can (Delete Device Group) icon with
the device group selected.
Conguring a Retenon Policy for the Time Series Database
To congure a retenon policy for the me series data used for root cause analysis (RCA):
1. Click the Sengs > System opon in the le-nav bar.
2. Select Retenon Policy Sengs.
3. Click the + Retenon Policy buon.
4. Enter the necessary values in the text boxes for the retenon policy.
The following table describes the aributes in the Add a Retenon Policy window:
Aributes Descripon
Name Name of the retenon policy.
136

(Connued)
Aributes Descripon
Duraon Amount of me the root cause analysis (RCA) data is retained in the Paragon Insights RCA
database. By default, data is retained for 7 days.
The data must be entered in hours or days. For example, 1 day is entered as 1d or 24h.
5. Click Save to save the conguraon or click Save and Deploy to save and deploy the conguraon.
You can now apply the retenon policy to a device group. For informaon on how to apply a
retenon policy to a device group, see "Adding a Device Group" on page 129.
Adding a Network Group
To add a network group:
1. Click the Conguraon > Network opon in the le-nav bar.
2. Click the + (Add Network) buon.
3. Enter the necessary values in the text boxes and select the appropriate opons for the network
group.
The following table describes the aributes in the Add a Network Group window:
Aributes Descripon
Name Name of the network group. (Required)
Descripon Descripon for the network group.
137

(Connued)
Aributes Descripon
Reports In the Reports eld, select one or more health report prole names from the drop-down
list to generate reports fo the network group. Reports include alarm stascs, device
health data, as well as device-specic informaon (such as hardware and soware
specicaons).
To edit or view details about saved health report proles, go to the System page under
the Sengs menu in the le-nav bar. The report proles are listed under Report
Sengs.
For more informaon, see "Alerts and Nocaons" on page 252.
Disable Trigger
Acon Scheduler
(for a parcular
network group)
By default, this eld is marked False because the opon to add a UDA scheduler in
Trigger Acon page is enabled.
You can set this eld to True if you want to disable UDA scheduler sengs in Trigger
Acon page.
Nocaons
• You can use the Alarm Manager feature to organize, track, and manage KPI alarm
nocaons received from Paragon Insights devices.
• To receive Paragon Insights alarm nocaons for KPI events that have occurred on
your devices, you must rst congure the nocaon delivery method for each KPI
event severity level (Major, Minor, and Normal). Select the delivery method from the
drop-down lists.
To edit or view details about saved delivery method proles, go to the System page
under the Sengs menu in the le-nav bar. The delivery method proles are listed
under Nocaon Sengs.
For more informaon, see "Alerts and Nocaons" on page 252.
Ingest Frequency Select exisng Ingest Frequency Proles to override rule or sensor frequency sengs.
138

(Connued)
Aributes Descripon
Logging
Conguraon
You can collect dierent severity levels of logs for the running Paragon Insights services
of a network group. Paragon Insights Release 4.0.0 supports collecng log data for
SNMP nocaon.
Use these elds to congure which log levels to collect:
Global Log
Level
From the drop-down list, select the level of the log messages that you
want to collect for every running Paragon Insights service for the
network group. The level is set to error by default.
Log Level for
specic
services
Select the log level from the drop-down list for any specic service that
you want to congure dierently from the Global Log Level seng. The
log level that you select for a specic service takes precedence over the
Global Log Level seng.
For more informaon, see "Logs for Paragon Insights Services" on page 309.
Publish You can congure Paragon Insights to publish Paragon Insights sensor and eld data for
a specic network group:
Desnaons Select the publishing proles that dene the nocaon type
requirements (such as authencaon parameters) for publishing the data.
To edit or view details about saved publishing proles, go to the System
page under the Sengs menu in the le-nav bar. The publishing proles
are listed under Nocaon Sengs.
Field Select the Paragon Insights rule topic and rule name pairs that contain
the eld data you want to publish.
Root Cause Analysis
RCA Support RCA is enabled by default. Disable RCA if you do not want the network group to be a
part of root cause analysis.
Exclude
Resources
Exclude Resources eld allows you to select network resources that must be excluded
from resource and dependency formaon.
139

4. Click Save to save the conguraon or click Save and Deploy to save and deploy the conguraon.
For informaon on how to use the network, see "Monitor Device and Network Health" on page 172.
Eding a Network Group
To edit a network group:
1. Click the Conguraon > Network opon in the le-nav bar.
2. Click anywhere on the line that contains the group name in the table under NETWORK LIST.
3. Click on the Edit Network (Pencil) icon.
4. Modify the aributes, as needed.
See "Adding a Network Group" on page 137 for a descripon of each aribute.
5. Click Save to save the conguraon or click Save and Deploy to save and deploy the conguraon.
For informaon on how to use the network group cards, see "Monitor Device and Network Health"
on page 172.
6. (Oponal) A network can be deleted by clicking the Delete Network (Trash Can) icon.
Change History Table
Feature support is determined by the plaorm and release you are using. Use Feature Explorer to
determine if a feature is supported on your plaorm.
Release
Descripon
4.0.0 Starng in Paragon Insights Release 4.0.0, you can add more than 50 devices per device group.
4.0.0 Paragon Insights Release 4.0.0 supports collecng log data for SNMP nocaon.
4.0.0 Paragon Insights Release 4.0.0 supports collecng log data for SNMP nocaon.
RELATED DOCUMENTATION
Paragon Insights Rules and Playbooks | 141
Monitor Device and Network Health | 172
140

Paragon Insights Rules and Playbooks
IN THIS SECTION
Add a Pre-Dened Rule | 141
Create a New Rule Using the Paragon Insights GUI | 142
Edit a Rule | 159
Add a Pre-Dened Playbook | 159
Create a New Playbook Using the Paragon Insights GUI | 160
Edit a Playbook | 161
Clone a Playbook | 162
Manage Playbook Instances | 163
The device or network performance elements that are important to one company may not be important
to another. Paragon Insights (formerly HealthBot) uses Rules and Playbooks to dene key performance
indicators (KPIs) and organize them into groups that are applied to network devices.
This document presents the tasks involved in creang, eding, and deleng Paragon Insights rules and
playbooks.
Add a Pre-Dened Rule
Juniper has created a set of pre-dened rules that you can use to gather informaon from various
Juniper components and the networks they reside in. You can add these rules to Paragon Insights at any
me. Aer installaon, many default pre-dened rules appear in the Rules and Playbooks pages. Pre-
dened rules cannot be changed or removed; however, you can clone any rule (pre-dened or user
dened) simply by clicking the CLONE buon on the upper-right part of the rule denion. A cloned
rule goes to the
external
topic and can be re-congured at will.
To upload addional pre-dened rules to Paragon Insights:
1. Using a browser, go to hps://github.com/Juniper/healthbot-rules and download the pre-dened rule
le to your system.
2. In the Paragon Insights GUI, click the Conguraon > Rules icon in the le-nav bar.
141

3. Click the ↑ Upload Rule Filesbuon.
4. Click the Choose Files buon.
5. Navigate to the rule le and click Open.
6. Select one of the following opons:
Upload Upload the le and save the rule within the dened topic area but do not deploy the
updated conguraon. You can use this opon when, for example, you are making several
changes and want to deploy all your updates at the same me.
Upload &
Deploy
Upload the le, save the rule within the dened topic area, and immediately deploy the
conguraon.
NOTE: You can use the Upload and Upload & Deploy to upload user-dened acon (UDAs)
and user-dened funcon (UDFs) les.
Create a New Rule Using the Paragon Insights GUI
IN THIS SECTION
Rule Filtering | 144
Sensors | 145
Fields | 147
Vectors | 149
Variables | 151
Funcons | 152
Triggers | 154
Rule Properes | 156
Pre/Post Acon | 157
142

To create a new rule using the Paragon Insights GUI, you’ll rst ll out general descripve informaon
about the rule and then navigate through several rule denion blocks in the Rules page to provide the
specic conguraon for the Paragon Insights rule.
To start creang a new Paragon Insights rule:
1. Click the Conguraon > Rules icon in the le-nav bar. A list of Paragon Insights rules organized by
Paragon Insights topic is displayed along the le side of the Rules page.
2. Click the add rule buon (+ Add Rule).
3. Enter general descripve informaon about the rule using the following input parameters:
Parameter Descripon
Rule For a new rule, this parameter is pre-populated with
external
/
user_rule_
random characters
, for example, external / user_rule_2p0ghk.
The elds separated by the slash (/) represent Paragon Insights topic
name and Paragon Insights rule name, respecvely.
external
is the topic name used for user-dened topics. For the Paragon
Insights rules pre-dened by Juniper, Juniper has curated a set of pre-
dened device component-based topic names. For more informaon
about Paragon Insights topics, see Paragon Insights Topics.
Replace the user_rule_
random characters
rule name with a name that
appropriately represents the rule’s descripon such as packets-in,
packets-out, system_memory, etc.
Rule frequency (Network rule only) Specify how oen data for the network rule is
collected by Paragon Insights. This seng is overridden if the rule is
included in a frequency prole that is applied to a network group.
Descripon (Oponal) Enter a detailed descripon for the rule.
Synopsis (Oponal) Enter a brief descripon for the rule. The synopsis is displayed
when you hover over the rule name listed along the le side of the Rules
page.
Field Aggregaon Time Range This oponal value denes how oen Paragon Insights aggregates the
data received by the sensor. This helps reduce the number of data point
entries in the me series database.
143

4. (Network rule only) If the new rule is a network rule, toggle the Network rule switch to the right.
5. Congure the rule denion blocks as needed.
Located directly below the Synopsis input parameter, you’ll nd links to the following rule denion
blocks: Sensors, Fields, Vectors, Variables, Funcons, Triggers, and Rule Properes. The following
secons describe the input parameters for each of these rule denion blocks.
6. Select one of the following opons to save the new rule:
Save Save the rule within the dened topic area but do not deploy the updated conguraon. You
can use this opon when, for example, you are making several changes and want to deploy
all your updates at the same me.
Save & Deploy Immediately deploy the conguraon and save the rule within the dened topic area.
The following secons describe the input parameters for each of the Paragon Insights rule denion
blocks:
Rule Filtering
Starng in HealthBot Release 3.0.0, you can lter the Topics and Rules displayed on the le side of the
Rules page. This allows you to quickly nd rules that you are looking for. The search funcon works for
topics, rules, sensor-types and other categories; working not only on tles, but also on the dened
contents of rules.
The following procedure explains this ltering feature.
1. Navigate to Conguraon > Rules in the le-nav bar.
The Rules page is displayed. To the le of the rule denion area is a new secon as shown in Figure
39 on page 145 below.
144

Figure 39: Rule Filtering
2. From the pull-down menu, select the type of search you want to perform.
3. In the search eld, begin entering your search text.
The topic list below shrinks to display only topics and rules that match your search criteria.
Sensors
Start conguring the new rule using the Sensor block. Figure 40 on page 146 shows the sensor
denion for the OpenCong sensor pppoe-error-statistics.
145

Figure 40: A Sensor Denion
1. Click the add sensor buon (+ Add Sensor).
A new sensor denion appears and is named Sensor_
random characters
, like Sensor_2kgf04.
2. Change the sensor name to something that makes sense for the rule you are dening.
3. From the drop-down list, choose the sensor type. You can choose one of: OpenCong, Nave GPB,
iAgent, SNMP, Syslog, or NetFlow.
The required elements for dening the Sensor Type change depending on the selecon you make.
The frequency is expressed in #s, #m, #h, #d, #w, #y, or #o where # is a number and s, m, h, d, w, y
species seconds, minutes, hours, days, weeks, years, and oset respecvely. The o expression is
used for dening an oset mulplier for use in formulas, references, triggers, learning periods, and
hold-mes.
The following list describes the elements that change based on your choice of Sensor Type. None of
the other rule elements change because of a Sensor Type selecon.
•
OpenCong
Sensor path is dened from a drop-down list of available OpenCong sensors.
Frequency refers to how oen, in seconds, the sensor reports to Paragon Insights.
The frequency can be overridden if the sensor is included in a frequency prole.
•
Nave
GPB Sensor path refers to the path for a Nave GPB sensor. Port refers to the GPB port
over which the sensor communicates with Paragon Insights.
146

•
iAgent File is the name of a YAML-formaed le that denes the NETCONF-accessible sensor.
Table is dened from a drop-down list of available PyEZ tables and views in the YAML
le. Frequency refers to how oen the sensor is polled by Paragon Insights and can be
overridden by including the sensor in a frequency prole.
Based on the table you’ve selected, input elds for a target or dynamic arguments might
also be provided. For these addional elds, you can do one of the following:
• Leave the input eld blank. No default value will be applied.
• Enter a xed value that will remain constant.
• Enter a variable name enclosed in double curly/ower brackets (for example, {{test-
variable}}) The variable name must belong to a variable that was previously dened in
the Paragon Insights rule, and the variable’s Type opon must be set to Sensor
Argument.
•
SNMP Table is dened from a drop-down list of available SNMP tables. Frequency refers to how
oen, in seconds, Paragon Insights polls the device for data and can be overridden by
including the sensor in a frequency prole.
•
Syslog
Paern set is a user-congured element that includes one or more paerns (you
congure a paern for each event you want to monitor). The Maximum hold period is
used in advanced cases and refers to the maximum me that the system will wait when
correlang events using mulple paerns within a paern set.
NOTE: The syslog sensor requires some pre-conguraon. See Syslog Ingest for more
details.
•
Flow
Template Name is a Juniper-supplied built-in list of NetFlow v9 and IPFIX templates.
Fields
A sensor will generally carry informaon about mulple things. For example, a sensor that watches
interfaces has informaon about all of the interfaces on the device. In Paragon Insights, we call these
things Fields. Now that you’ve dened a sensor, you’ll need to tell Paragon Insights which elds you’re
interested in.
1. Click the Fields link.
147
The screen updates and shows the dened eld objects.
2. Click the add eld buon (+ Add Field).
3. Replace the random eld name with a name that make sense for the rule you are dening, such as
interface-name, congured-threshold, etc.
4. (Oponal) Add descripve text for the new eld.
5. Set the appropriate Field Type. The opons for eld type are: string, integer, oat, and unsigned
integer. String is the default eld type.
Starng in Paragon Insights Release 4.2.0, you can also select unsigned integer as a eld type. An
unsigned integer is a data type that can contain values from 0 through 4,294,967,295.
6. (Oponal) Toggle the Add to rule key switch.
The add rule to key switch tells Paragon Insights that this eld should be indexed and searchable. For
example, when you enable this switch, the eld name will be listed on the Devices page under the
Keys column.
7. Select the appropriate ingest type (Field source) from the pull-down menu.
The following list shows the opons available for the Ingest type (Field source) menu.
• Sensor–Use this or another sensor denion.
• Path-Follow this Open Cong or Netconf path within the sensor denion to gather specic
data like the names of the interfaces. For iAgent sensors the Path refers to the path dened in
the YAML le.
• Where–Filter the available data to gather informaon about a specic element within, like a
specic interface. This eld can reference the Variables dened elsewhere within the rule.
When referencing variables, use moustache notaon, enclosed in slashes, such as:
{{interface_name}}.
• Zero suppression-For some sensors associated with devices running Junos OS, such as Junos
Telemetry Interface Open Cong and nave GPB sensors, no eld data is sent from the sensor
when the data’s value is zero. Enable the zero suppression switch to set the eld data value to
zero whenever no eld data is sent from the sensor.
• Data if missing-Specify a value as the default data value whenever no data is sent from the
sensor. The format of the specied value should match the dened eld type (string, integer,
or oat). If the zero suppression switch is also enabled, then the specied data-if-missing value
is ignored, and the default sensor data value is set to zero.
• Reference–A reference to a eld or trigger value from another rule.
148

• Data if missing-Specify a value as the default data value whenever no reference data is
fetched. The format of the specied value should match the dened eld type (string, integer,
or oat).
• Constant–Use a constant when referring to a Variable dened within the rule, whose value
doesn’t change, such as IO_Drops_Threshold A constant can also be a string or numeric value that
does not change and is not a reference to a variable.
• Constant value–Use moustache notaon to reference the variable like this:
{{IO_Drops_Threshold}}.
• Formula–Select the desired mathemacal formula from the Formula pull-down menu.
8. (Oponal) Set the Field aggregaon me-range. Located above the Fields tab with the general rule
parameters, this periodic aggregaon seng helps to reduce the number of data points entered in
the database. For example, if the sensor sengs specify that Paragon Insights ingests data every 10
seconds, you could congure this seng to aggregate and record the relevant eld data, say, every
60 seconds. Note that when using this seng, any eld-specic me ranges must use the same
value.
NOTE: Starng in HealthBot Release 3.1.0, you can add elds and keys to rules based on
whether the incoming data meets user-dened condions dened in tagging proles. Tagging
proles are dened in Paragon Insights under Sengs > Ingest Sengs on the le-nav. See
"Paragon Insights Tagging" on page 33 for details.
Vectors
(Oponal) Now that you have a sensor and elds dened for your rule, you can dene vectors.
A vector is used when a single eld has mulple values or when you receive a value from another eld.
1. Click on the Vectors link.Figure 41 on page 150 shows the Vectors block for a newly added vector.
149

Figure 41: Vectors Block
2. Click the add vector buon (+ Add Vector)
3. Replace the random vector name with a name that makes sense for your rule.
4. Select an ingest type from the drop-down list. The addional input elds will vary depending on the
selecon you make.
For path:
Parameter Descripon
List of elds Select a eld from the drop-down list. The list of elds is derived from all
of the dened elds in this rule.
Time-range Specify a me range from which the data should be collected. The me
range is expressed in #s, #m, #h, #d, #w, #y where # is a number and s, m,
h, d, w, y species seconds, minutes, hours, days, weeks, and years
respecvely. For example, enter 7 days as 7d.
For formula:
150

Parameter Descripon
Formula Type Select a formula type from the drop-down list:
unique Creates a vector with unique elements from another vector.
and Compares two vectors and returns a vector with elements
common to both vectors.
or Compares two vectors and returns a vector with elements from
both vectors.
unless Compares two vectors and returns a vector with elements from
the le vector but not the right vector.
Vector name (Unique formula type only) Select a vector name from the drop-down list.
The list of vectors is derived from all of the dened vectors in this rule.
Le vector Select a vector name from the drop-down list. The list of vectors is
derived from all of the dened vectors in this rule.
Right vector Select a vector name from the drop-down list. The list of vectors is
derived from all of the dened vectors in this rule.
Variables
(Oponal) The Variables block is where you dene the parts of the sensor that you are interested in. For
example, a rule that monitors interface throughput needs to have a way to idenfy specic interfaces
from the list of available interfaces on a device. The eld details are discussed below.
1. Click on the Variables tab.
2. Click the add variable buon (+ Add Variable)
3. Replace the random Variable name with a variable name that makes sense for your rule, such as pem-
power-usage-threshold.
BEST PRACTICE: The accepted convenon within Juniper for naming of elements within
Paragon Insights is to always start with a lower-case leer and use hyphens to separate
151

words. Make sure that your variable names are unique, clearly named, and follow a
recognizable paern so that others can understand what the variable is for. Any
abbreviaons should be used consistently throughout.
4. Set an appropriate default value in the Default value eld.
Default values vary depending on eld type. Integer eld types use numeric default values, while
string eld types use strings to set exact defaults and regular expressions that allow you to set the
default from a list. Any default values set during rule denion can be overridden at apply-me at
either the device or device group level.
5. Select the appropriate variable type from the Type drop-down list.
Available eld types are: Integer, Floang Point, String, Boolean, Device, Device Group, and Unsigned
Integer.
Starng in Paragon Insights Release 4.2.0, you can also select unsigned integer as a variable type. An
unsigned integer is a data type that can contain values from 0 through 4,294,967,295.
Funcons
(Oponal) Dene any needed funcons.
The Funcons block allows users to create funcons in a python le and reference the methods that are
available in that le. The python le must be created outside of Paragon Insights. You must know about
the method names and any arguments because you will need those when dening the funcons.
Starng with Paragon Insights 4.2.0 release, you can use a Python user-dened funcon to return
mulple values.
For example, consider that you have a funcon example_funcon.py that has three return values. When
you call the example_funcon.py in a rule, the rst return value in the user-dened funcons (UDF) is
stored in the rule eld that calls the funcon. You only need to congure return elds, such as
r2
and
r3
,
for the remaining two return values. You can congure these elds for return values in the Return List of
the Funcons tab.
In the me-series database, the name of Return List elds are prexed with the name of the rule eld
that uses the UDF. For example,
rule_eld_name-r2
.
Figure 42 on page 153 shows the Funcons block for the chassis.power/check=pem-power-usage rule. The eld
details are discussed below.
152

Figure 42: The Funcons Block
To congure a funcon:
1. Click on the Funcons link.
2. Click + Add Funcon.
3. Enter a funcon name such as used-percentage.
4. In the Path to funcon eld, enter the name of the python le that contains the funcons. These les
must be stored in the /var/local/healthbot/input/hb-default directory. The pull-down list is
populated with all the Python (.py) les in that directory.
5. In the Method Name eld, enter the name of the method as dened in the python le. For example,
used_percentage.
6. (Oponal) Enter a descripon for the funcon in the descripon box.
7. (Oponal) For each argument that the python funcon can take, click the add argument buon (+
Add Argument).
Each me you click the add argument buon, you’ll need to enter the name of the argument and set
the toggle switch as to whether the argument is mandatory or not. The default is that none of the
arguments are mandatory.
8. (Oponal) If there are more than one return value in the funcon, click +Add Return List.
153
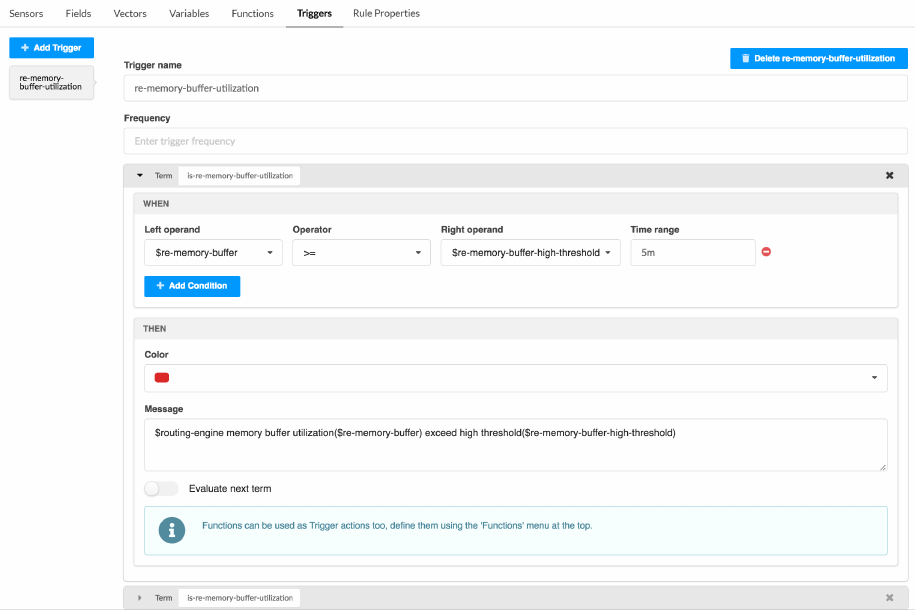
9. Enter a name for the return value and the data type, such as an integer.
Triggers
A required element of rule denion that you’ll need to set is the trigger element. Figure 43 on page
154 shows the Triggers block for the system.memory/check-system-memory rule. The eld details are discussed
below.
Figure 43: The Triggers Block
Seng up triggers involves creang terms that are used to set policy. If the terms within a trigger are
matched, then some acon is taken. Terms can evaluate the elds, funcons, variables, etc that are
dened within the rule against each other or in search of specic values. Terms are evaluated in order
from the top of the term list to the boom. If no match is found, then the next term (if any) is evaluated
unl a match is found or unl the boom of the term stack is reached.
1. Click on the Triggers link.
2. Click on the add trigger buon (+ Add Trigger).
154

3. Replace the random trigger name with one that makes sense for the trigger you are dening, such as
foo-link-operaon-state. We recommend using a name that is very unique to the rule and trigger to
avoid having the same trigger name across two or more rules.
4. (Oponal) Enter a value in the Frequency eld. This value tells Paragon Insights how oen the eld
data and triggers should be queried and evaluated. If no entry is made here, then the sensor
frequency is applied for this value. The frequency entered here can be entered as a mulple or, an
oset, of the sensor frequency such as 2o. For example, if the sensor frequency is 10s and the trigger
frequency is 2o, then the trigger frequency would be 20s (2*10s).
5. Click the add term buon (+ Add Term).
The Term area will expand and show an add condion buon, (+ Add Condion) in the When secon
and Color and Message elds in the Then secon.
6. To dene a condion that the term will evaluate, click the + Add Condion buon.
The When secon expands to show Le operand, Operator, and Time range elds.
NOTE: Seng a condion is not required. If you want to guarantee that a Term takes a
specic acon, don’t set a condion. This could be useful, for example, at the boom of a
term stack if you want some indicaon that none of the terms in your trigger matched.
7. Select values from the pull-down menus for each of these elds.
Depending on which Operator is chosen, a new eld, Right operand may appear in between the
Operator and Time range elds.
The le and right operand pull-down menus are populated with the elds and variables dened in
the rule. The operator eld determines what kind of comparison is done. The me range eld allows
the trigger to evaluate things such as if there were any dropped packets in the last minute.
8. (Oponal) Set values for the Color and Message elds, and add Acon Engine informaon in the
Then secon.
These elds are the acon elds. If a match is made in the condion set within the same term, then
whatever acon you dene here is taken. A color value of green, yellow, or red can be set. A message
can also be set and is not dependent on whether any color is set.
Starng in Paragon Insights Release 4.2.0, you link acon workows (Acon Engine) to rules while
seng up triggers. You can also add input arguments while linking acon workows. The Acon
Engine secon is enabled only with a PIN-Advanced license. For more informaon, see "Paragon
Insights Licensing Overview" on page 326.
155

If color or message are set, a toggle buon labelled Evaluate next term appears at the boom of the
Then secon. The default value for this buon is o (not acve).
NOTE: If no match is made in the When secon of a term, the Then secon is ignored. If this
happens, the next term down, if any, is evaluated.
If a match is made in the When secon, then the acons in the Then secon, if any, are taken
and processing of terms stops unless the Evaluate next term buon is set to on (acve).
Seng the Evaluate next term buon allows you to have Paragon Insights make more
complex evaluaons like ’if one condion and another condion are both true, then take this
acon’.
Rule Properes
(Oponal) Specify metadata for your Paragon Insights rule in the Rule Properes block. Available opons
include:
Aributes Descripon
Version Enter the version of the Paragon Insights rule.
Contributor Choose an opon from the drop-down list.
Author Specify a valid e-mail address.
Date Choose a date from the pop-up calendar.
Supported Paragon
Insights Version
Specify the earliest Paragon Insights release for which the rule is valid.
Supported Device >
Juniper Devices
Choose either Junos or Junos Evolved. Device metadata includes Product Name,
Release Name, Release Support (drop-down list), and plaorm. You can add metadata
for mulple devices, mulple products per device, and mulple releases per product.
Starng in Paragon Insights Release 4.2.0, you can select default sensors that you want
to apply to all supported devices. You also have the opon to select default sensors that
you want to apply to Juniper devices, and to Juniper devices that run a specic OS.
156

(Connued)
Aributes Descripon
Supported Device >
Other Vendor Devices
Paragon Insights Release 4.1.0 and earlier—You can add metadata for mulple devices.
Paragon Insights Release 4.2.0 and later—You can add vendor idener, vendor name,
product, plaorm, release, and operang system-related informaon for non-Juniper
vendors.
Starng in Paragon Insights Release 4.2.0, you can select default sensors that you want
to apply to all non-Juniper devices.
Helper Files Specify les that are required by the Paragon Insights rule.
For more informaon on rules and telemetry sensors supported in a Junos OS and Junos OS Evolved
soware release for a specic hardware plaorm, see Telemetry Sensor Explorer.
Pre/Post Acon
You can use the following general workow to work with pre- or post-acon tasks:
1. Congure Acon Engine Workows. See "Manage Acon Engine Workows" on page 244 for more
informaon.
2. Congure Pre-Acon or Post-Acon tasks depending on your use case.
See "Pre-acon Tasks" on page 157 to congure pre-acon tasks and see "Post-acon Tasks" on page
158 to congure post-acon tasks.
3. Create a playbook with rules that have pre or post-acon tasks. See "Paragon Insights Rules and
Playbooks" on page 141 for more informaon.
4. Run an instance of the new playbook on device groups to execute pre-acon tasks. See "Paragon
Insights Rules and Playbooks" on page 141 for more informaon.
5. Stop the instance of the new playbook to execute post-acon tasks. See "Paragon Insights Rules and
Playbooks" on page 141 for more informaon.
6. Monitor the status of pre-acon and post-acon tasks. See "Manage Acon Engine Workows" on
page 244 for more informaon.
Before you congure pre-acon and post-acon tasks in rules, you must congure Acon Engine
workows. See "Manage Acon Engine Workows" on page 244 to congure Acon Engine workows.
To congure pre-acon tasks:
157
1. Click the Pre/Post Acons tab on the Rules page.
2. In the Pre-Acon secon, select an acon engine workow in the Acon Engine eld.
3. Enter the input argument from the list in the device eld. The list shows arguments you previously
congured in the selected acon engine workow as the pre-acon task.
4. Enable execute-once if you want Paragon Insights to execute the pre-acon task only once on each
device in a device group.
5. Do one of the following:
• Click Save to save your conguraon changes but do not deploy the updated conguraon. You
can use this opon when, for example, you are making several changes and want to deploy all
your updates at the same me later. See "Commit or Roll Back Conguraon Changes in Paragon
Insights" on page 307 for more informaon.
• Click Save and Deploy to save the rule conguraon in the GUI and deploy the conguraon.
When the rule is included in a playbook and a playbook instance runs on a device group, Paragon
Insights executes the pre-acon task parallel to ingesng telemetry data.
Before you congure pre-acon and post-acon tasks in rules, you must congure Acon Engine
workows. See "Manage Acon Engine Workows" on page 244 to congure Acon Engine workows.
To congure post-acon tasks:
1. Click the Pre/Post Acons tab on the Rules page.
2. In the Post-Acon secon, select an acon engine workow in the Acon Engine eld.
3. Enter the input argument from the list in the device eld. The list shows arguments you previously
congured in the selected acon engine workow as the post-acon task.
4. Enable execute-once if you want Paragon Insights to execute the post-acon task only once on each
device in a device group.
5. Do one of the following:
• Click Save to save your conguraon changes but do not deploy the updated conguraon. You
can use this opon when, for example, you are making several changes and want to deploy all
your updates at the same me later. See "Commit or Roll Back Conguraon Changes in Paragon
Insights" on page 307 for more informaon.
• Click Save and Deploy to save the rule conguraon in the GUI and deploy the conguraon.
When you stop the playbook instance (with this rule) from running on a device group, Paragon
Insights executes the post-acon task aer it stops the service for playbooks.
158

Edit a Rule
To edit a rule:
1. Click the Rules icon in the le-nav bar.
2. Click the name of the rule listed along the le side of the Rules page.
3. Modify the necessary elds.
4. Select one of the following opons:
Save Save your edits but do not deploy the updated conguraon. You can use this opon when,
for example, you are making several changes and want to deploy all your updates at the
same me.
Save & Deploy Immediately deploy the conguraon and save the rule.
5. (Oponal) Delete a rule by clicking the Delete buon located to the right of the rule name.
Add a Pre-Dened Playbook
Juniper curates a set of pre-dened playbooks designed to address common use cases. You can add
these playbooks to your Paragon Insights installaon at any me. The default pre-dened playbooks
cannot be changed or removed.
To add a pre-dened playbook to Paragon Insights:
1. Using a browser, go to hps://github.com/Juniper/healthbot-rules and download the pre-dened
playbook le to your computer.
2. In the Paragon Insights GUI, click the Conguraon > Playbooks icon in the le-nav bar.
3. Click the upload playbook buon (↑ Upload Playbook).
4. Click the Choose Files buon.
5. Navigate to the playbook le and click Open.
6. Select one of the following opons:
Upload Upload the le and add the playbook but do not deploy the updated conguraon. You can
use this opon when, for example, you are making several changes and want to deploy all
your updates at the same me.
159

Upload &
Deploy
Upload the le, add the playbook, and immediately deploy the conguraon.
NOTE: You can use the Upload and Upload & Deploy to upload user-dened acon (UDAs)
and user-dened funcon (UDFs) les.
Create a New Playbook Using the Paragon Insights GUI
Paragon Insights operates on playbooks, which are a collecon of rules for solving a specic customer
use case. For example, the system-kpi-playbook monitors the health of system parameters such as
system-cpu-load-average, storage, system-memory, process-memory, etc. and noes the operator or
takes correcve acon in case any of the KPIs cross pre-set thresholds. Any single rule can be a part of
0, 1, or more playbooks. The playbook is the rule element that gets deployed on devices. Rules that are
not included in any playbook will not be deployed to any device.
NOTE: Click the Name, Running, Paused, or Synopsis column headers in the Playbooks table to
organize the data in ascending or descending order.
Starng with Release 4.2.0, Paragon Insights supports splat operator in ICMP outlier detecon playbook.
The icmp-outlier playbook earlier required that you enter the round trip me (RTT) XPath for each
device (using device id). As the playbook is applied to all devices in a device group, you can enter the
splat operator (*) in the regular expression format instead of device id of each device.
For example:
/device-group[device-group-name=core]/device[device-id=~/.*/]]
/topic[topic-name=protocol.icmp]/rule[rule-name=check-icmp-statistics]/rtt-average-ms
NOTE: If you delete or add a device in a device group on which an ICMP outlier playbook
instance runs, you must pause the playbook instance, modify the XPath conguraon to reect
the addion or deleon of devices, and re-apply the playbook instance for the device group.
To create a new playbook using the Paragon Insights GUI:
160

1. Click the Conguraon > Playbooks icon in the le-nav bar.
2. Click the create playbook buon (+ Create Playbook).
A new window appears with 4 elds: Name, Synopsis, Descripon, and Rules. We describe the use of
each eld below.
3. Enter a name for the playbook in the Name eld.
4. Enter a short descripon for the playbook in the Synopsis eld.
This text appears in the Synopsis column of the table on the Playbooks page.
5. (Oponal) Enter a descripon of each of the rules that make up this playbook in the Descripon eld.
This text can only be seen if you click on the playbook name on the Playbooks page.
6. From the rules drop-down list, select the rules that make up this playbook.
7. Select one of the following opons:
Save Save and add the playbook but do not deploy the updated conguraon. You can use this
opon when, for example, you are making several changes and want to deploy all your
updates at the same me.
Save & Deploy Immediately deploy the conguraon and save and add the playbook.
Edit a Playbook
To edit a playbook:
1. Click the Conguraon > Playbooks icon in the le-nav bar.
2. Click the name of the playbook.
3. Modify the necessary text boxes.
4. Select one of the following opons:
Save Save your edits to the playbook but do not deploy the updated conguraon. You can use
this opon when, for example, you are making several changes and want to deploy all your
updates at the same me.
Save & Deploy Immediately deploy the conguraon and save your edits to the playbook.
5. (Oponal) Delete a playbook by clicking the trash can icon in the Delete column.
161

NOTE: You cannot edit or delete a system dened (Juniper provided) playbook.
When you update a playbook, the new changes on the playbook will not be applied to the exisng
instances of the playbook. For example, a playbook instance that is associated to a device group will not
be updated when the playbook is edited or updated. You must delete the exisng playbook instance and
create a new one for updates to be applied.
Clone a Playbook
Starng with HealthBot Release 3.2.0, you can clone an exisng playbook and modify conguraons.
Follow these steps to clone a playbook by using the Paragon Insights UI.
1. Click Conguraon>Playbooks in the le-nav bar.
The Playbooks page is displayed.
2. Click the Clone icon as show in Figure 44 on page 162.
Figure 44: Clone a Playbook
The Clone Playbook: <
name of playbook
> page is displayed.
162

You can now edit Name, Synopsis, and Descripon secons. You can also add new rules or remove
exisng rules from the Rules drop-down list.
3. Click Save to save conguraons and conrm cloning the playbook.
Alternavely, click Save & Deploy to save conguraons, conrm cloning the playbook, and deploy
the newly cloned playbook.
Manage Playbook Instances
IN THIS SECTION
View Informaon About Playbook Instances | 163
Create a Playbook Instance | 166
Manually Pause or Play a Playbook Instance | 167
Create a Schedule to Automacally Play/Pause a Playbook Instance | 169
The term
playbook instance
refers to a specic snapshot of a playbook that is applied to a specic
device group or network group. You can manually play and pause playbook instances. Alternavely, you
can apply a customized schedule to a playbook instance that will automacally perform play and pause
acons.
The following secons describe tasks that you can perform to manage playbook instances:
View Informaon About Playbook Instances
To view informaon about playbook instances:
1. Click the Conguraon > Playbooks opon in the le-nav bar.
The saved playbooks are listed in the table on the main Playbooks page.
163

• Playbooks that have been applied to a device group or network group are idened in the table
by a right caret next to the playbook name.
• The Instances column in the table shows the number of playbook instances running and paused.
• Starng with HealthBot Release 3.1.0, some playbooks require the purchase and installaon of
advanced or premium licenses. These playbooks are idened by the green circle with a white
star in it. As shown above, it tells you which license is required when you hover your mouse over
the icon.
• The Live column (in the Acon secon of the table) shows a colored circle indicator that
represents the overall status of the playbook instances for each playbook. The following table
provides the color denions:
Table 9: Color
Denions for the Live Column
Color Denion
Green All instances associated with this playbook are currently running.
Yellow One or more instances associated with this playbook are paused.
Gray/Black There are no instances associated with this playbook, or an instance is associated with this
playbook but the conguraon has not been deployed yet.
164

2. Click on the caret next to the playbook name to expand or collapse the playbook instance details. If
no caret is present, then the playbook has not been applied to any device groups or network groups.
The following playbook instance details are displayed:
Column Name or Widget Descripon
Instance Name User-dened instance name.
Schedule Name of the schedule prole applied to the playbook instance. For
informaon on how to congure a schedule prole, see "Create a Schedule
to Automacally Play/Pause a Playbook Instance" on page 169
Click on the name to display the schedule details.
Device/Network Group Device group or network group to which the schedule is applied.
No. of devices Number of devices on which this playbook instance is deployed. This is
applicable for device group instances only, not for network group
instances.
Status Current status of the playbook instance. Status can be either Running or
Paused. The Status column also indicates whether the acon was
performed automacally or manually.
Note: If the status of a playbook instance is Running (automac), you can
manually pause the schedule for this instance using the Pause Schedule
buon. In this case, the status will change to Paused (manual). To resume
running the schedule for this instance, you must manually run the instance
using the Play Schedule buon. In this case, the status will change back to
Running (automac), and the play and pause acons associated with the
schedule will resume.
Started/Paused at Date and me when the playbook instance was last started or paused. The
date reects local browser me zone.
Next Acon This column applies only to playbook instances associated with a schedule.
It indicates whether the playbook instance is scheduled to automacally
pause or play in the future. This column is blank if no schedule is
associated with the playbook instance or if the status of the instance is
Paused (manual).
165

(Connued)
Column Name or Widget Descripon
Play/Pause buon Pauses or plays a playbook instance or the schedule for a playbook
instance.
The Play/Pause buon toggles between the two states. For more
informaon, see "Manually Pause or Play a Playbook Instance" on page
167.
Trash can icon Deletes the playbook instance.
Create a Playbook Instance
To create a playbook instance for a device group:
1. Click the Conguraon > Playbooks opon in the le-nav bar.
2. Click the Apply icon (in the Acon secon of the table) for the desired playbook.
A pane tled
Run Playbook: <playbook-name>
appears.
3. In the Name of Playbook Instance eld, ll in an appropriate name for this instance of the playbook.
This is a required eld.
4. (Oponal) In the Run on schedule eld, choose the name of the schedule that you want to apply to
this playbook instance. You can apply only one schedule per playbook instance. If you want a specic
playbook instance to run on mulple schedules, you must create mulple versions of the instance,
each with its own unique name and schedule.
For informaon on how to congure a schedule, see "Create a Schedule to Automacally Play/Pause
a Playbook Instance" on page 169.
To view informaon about an exisng schedule:
a. Click the Sengs opon in the le-nav bar.
b. In the Scheduler Sengs secon, a summary of the properes for each saved schedule is shown
in the table. Click on a specic schedule name to view addional details.
5. In the Device Group secon under Rules, apply this playbook instance to the appropriate device
group using the drop-down list.
The list of devices in the Devices secon changes based on the device group selected.
166

NOTE: If your playbook contains network rules, the Device Group secon does not appear.
Instead, it is replaced with a Network Groups secon (not shown).
6. Click one of the devices listed in the Devices secon.
Here is where you can customize the variable values that will be set for this device when the
playbook is run.
7. In the secon tled Variable values for Device
<Device Name>
, the variables for each rule in the
playbook can be seen by clicking on the rule name. The default values for each variable are displayed
as grey text in each eld. You can leave these values as-is or override them by entering a new value.
Repeat steps 6 and 7 for each device in the device group, as needed.
8. When you are sased that all of the variable values are appropriate for all the devices in the device
group, select one of the following opons.
Save Instance Save your edits but do not deploy the updated conguraon and do not run the instance. You
can use this opon when, for example, you are making several changes and want to deploy all
your updates at the same me.
Run Instance Deploy the conguraon, and, if no schedule prole was applied, immediately run the
instance. If a schedule prole was applied, the instance will run according to the conguraon
of the prole.
Manually Pause or Play a Playbook Instance
When an instance is paused, Paragon Insights does not collect, analyze or raise an alarm on the device or
network group data associated with the playbook rules. Data collected prior to pausing the instance is
retained in the system, but no new data is collected or analyzed unl the instance is played again.
The following table describes the state of the playbook instance when a parcular buon is displayed in
the Play/Pause column:
167

If the displayed Play/Pause buon
is...
Then the state of the playbook instance is...
Pause Instance
• The instance is running.
• The instance is not associated with a schedule.
• Data is being collected.
Pause Schedule
• The instance is associated with a schedule.
• The schedule is running.
• The schedule determines when the instance is running.
Play Instance
• The instance is not running.
• The instance is not associated with a schedule.
• No data is being collected.
Play Schedule
• The instance is associated with a schedule.
• The schedule and the instance is not running.
• No data is being collected.
To manually pause a playbook instance or schedule:
1. Click the Conguraon > Playbooks opon in the le-nav bar.
The list of exisng playbooks is displayed.
2. Click the caret next to the name of the playbook that you want to pause.
3. Choose one of the following opons:
• Click the Pause Instance buon to pause a playbook instance (not associated with a schedule).
• Click the Pause Schedule buon to pause the schedule that’s associated with a playbook instance.
4. The Play/Pause Playbook Instance dialog box appears. Select one of the following opons:
168

Pause Flags this playbook instance to be paused the next me you deploy the conguraon. Use this
opon if you are making several changes and want to deploy all your edits at the same me.
Pause &
Deploy
Immediately pause the playbook instance and deploy the conguraon. It will take a few
seconds for the playbook table to update to show the instance is paused.
There is a slight delay in updang the table because the play and pause acons are
asynchronous and run in the background, allowing you to perform other acons. The status of
this asynchronous acvity can be tracked through the deploy icon located in the upper right
corner of the window (as indicated in the success message of deploy acon). Once this acon is
complete, the status is reected in the playbook table as well.
Once the playbook table is refreshed, the playbook name shows a yellow icon in the Live column as a
visual indicator that an instance is paused.
5. To resume a paused playbook instance, follow the same steps as above except choose one of the
following opons for Step 3:
• Click the Play Instance buon to resume running a playbook instance (not associated with a
schedule).
• Click the Play Schedule buon to resume running the schedule associated with a playbook
instance. The schedule determines when the instance resumes playing.
Create a Schedule to Automacally Play/Pause a Playbook Instance
To automacally play/pause a playbook instance, you must rst create a schedule and then apply the
schedule to the playbook instance. You can apply only one schedule per playbook instance. If you want a
specic playbook instance to run on mulple schedules, you must create mulple versions of the
instance, each with its own unique name and schedule.
To create a schedule for a playbook instance:
1. Click the Sengs > System opon in the le-nav bar.
2. Click the Scheduler tab.
3. In Scheduler Sengs, click the add scheduler buon (+ Scheduler).
4. Enter the necessary values in the text boxes and select the appropriate opons for the playbook
instance schedule.
The following table describes the aributes in the Add a scheduler and Edit a scheduler panes:
169

Aributes Descripon
Name Enter the name of the playbook instance schedule.
Scheduler
Type
Choose discrete.
You can congure a discrete length of me to play the playbook instance using the Run for
eld. Once the run me has ended, Paragon Insights will automacally pause the instance.
You can also congure Paragon Insights to automacally resume playing the instance using
the Repeat eld.
Start On Use the pop-up calendar to select the date and me to play the playbook instance for the
rst me.
Run for Congure a discrete length of me to play the playbook instance. First enter an integer value
and then choose the unit of measure (minute, hour, or day) from the drop-down list.
Once the run me has ended, Paragon Insights will automacally pause the instance. You
can also congure Paragon Insights to automacally resume playing the instance using the
Repeat eld.
End On (Oponal) Use the pop-up calendar to select the date and me to pause the playbook
instance indenely. Leave blank if you want the playbook instance to play indenitely.
Note: If a playbook instance is associated with a schedule and is running when the End On
me is reached, then the instance will connue to run unl the congured Run for length of
me is reached. At this me, the instance will pause indenitely.
Repeat Congure the Run for eld before conguring the Repeat eld. The Repeat interval must be
larger than the congured Run for length of me.
In the drop-down list, choose one of the following:
• The frequency (every day, week, month, or year) at which you want the playbook
instance to play.
• The Never opon if you want the playbook to play only once.
• The Custom opon to specify a custom frequency at which you want the playbook
instance to play. Use the Repeat Every eld to congure the custom frequency.
170

(Connued)
Aributes Descripon
Repeat Every (Oponal) If you chose the Custom opon for the Repeat eld, enter the custom frequency
at which you want the playbook instance to play. First enter an integer value and then
choose the unit of measure (minute, hour, or day) from the drop-down list.
5. Click Save to save the conguraon or click Save and Deploy to save and deploy the conguraon.
6. Now you’re ready to apply the schedule to a playbook instance. For more informaon, see "Create a
Playbook Instance" on page 166.
Change History Table
Feature support is determined by the plaorm and release you are using. Use Feature Explorer to
determine if a feature is supported on your plaorm.
Release Descripon
3.1.0 Starng in HealthBot Release 3.1.0, you can add elds and keys to rules based on whether the incoming
data meets user-dened condions dened in tagging proles.
3.1.0 Starng with HealthBot Release 3.1.0, some playbooks require the purchase and installaon of
advanced or premium licenses.
3.0.0 Starng in HealthBot Release 3.0.0, you can lter the Topics and Rules displayed on the le side of the
Rules page.
RELATED DOCUMENTATION
Paragon Insights Concepts | 6
Manage Devices, Device Groups, and Network Groups | 121
Telemetry Sensor Explorer
171

Monitor Device and Network Health
IN THIS SECTION
Dashboard | 172
Health | 183
Network Health | 192
Graphs Page | 192
Paragon Insights (formerly HealthBot) oers several ways to detect and troubleshoot device-level and
network-level health problems. Use the informaon provided by the following Paragon Insights GUI
pages to invesgate and discover the root cause of issues detected by Paragon Insights:
Dashboard
IN THIS SECTION
Device Dashlets | 174
Device Group List Dashlet | 175
Network Group List Dashlet | 177
Health Alert Dashlets | 178
TSDB Dashlets | 180
Paragon Insights Release 4.0.0 introduces GUI enhancements brought about by the migraon to a new
framework. This change does not have an impact on exisng funconality or resources in the GUI but
introduces the following changes in the interface:
• Favorites opon
• Launchpad icon
172
• TSDB (me series database) dashlets
The Favorites opon, denoted by a star buon at top right corner of all pages, allows users to mark
pages under the Favorites secon for easier access.
In the top right corner of the UI, if you click the Launchpad buon (rocket icon), you get a drop down
menu that takes you to the Sizing Tool and the Github repository for Paragon Insights rules called
Playbooks (github). Sizing Tool allows you to esmate the compute (vCPU), memory (RAM), and storage
requirements to deploy or scale Paragon Insights in your network. Visit the sizing tool app to esmate
your requirements.
Starng with Paragon Insights Release 4.0.0, the Alarms opon is renamed as Alerts. To access the
Alerts page, go to Monitor > Alerts.
Use the Dashboard to create a custom view of what you’re most interested in. Paragon Insights pre-
populates the dashboard with the Device List, Device Group List, and Netwok Group List dashlets and
calls this view My Dashboard. You can create your own dashboard view by clicking the + to the right of
My Dashboard. Custom views can be added, renamed, and deleted as you see t.
The Dashboard also has a graphical list of pre-dened dashlets across the top that is inially hidden from
view. Click the cluster of 9 blue dots on the upper right part of the page to display or hide the available
dashlets. Each dashlet provides graphical informaon from a specic point of view. Many of the dashlets
can be clicked on to drill down deeper into the informaon presented.
•
Devices
Consists of devices dashlet, device vendor dashlet, and device status dashlet (see "Device
Dashlets" on page 174).
•
Device Groups
Consists of device group dashlets (see "Device Group List Dashlet" on page 175).
•
Network Groups
Consists of network group dashlets (see "Network Group List Dashlet" on page
177).
•
Health Alert
Consists of health alert dashlets (see "Health Alert Dashlets" on page 178).
•
TSDB (Time
Series Database)
Consists of TSDB dashlets that have line charts for Buer Bytes, Buer Length,
and bar charts for Read Error for Last 5 Minutes, Write Error for Last 5 Minutes,
and Buer Length (see "TSDB Dashlets" on page 180).
The Dashboard uses two types of colored objects to provide health status: halos and bars. The following
table describes the meaning of the severity level colors displayed by the status halos and bars on the
Dashboard:
173

Color Denion
Green The overall health of the device, device group, or network group is normal.
No problems have been detected.
Yellow There might be a problem with the health of the device, device group, or
network group. A minor problem has been detected. Further invesgaon is
required.
Red The health of the device, device group, or network group is severe. A major
problem has been detected.
Gray No data is available.
Device Dashlets
The following table describes the main features of the Devices dashlet, Device Vendor dashlet, and
Device Status dashlet on the dashboard.
Figure 45: Devices Dashlets
174

Dashlets Descripon
Devices Devices dashlet lists the status and hostname of all devices congured in Paragon Insights.
Click on the number under the Device Groups column in the dashlet to trace the device group to
which the device is added. It goes to the Device Group Conguraon page.
Click the circular arrow at the top of the dashlet to refresh the dashlet.
Click the X at the top of the dashlet to remove the dashlet from the dashboard.
Device
Vendor
The half pie chart in this dashlet shows the total number of devices classied by vendor name.
Each vendor is disnguished by a unique color.
If you hover over the chart, the status halo displays the number of devices from a vendor and the
percentage share of the devices in the total.
The legend by the chart displays the names of the vendors. If you click on the name of a parcular
vendor, the devices from that vendor is ltered out from the data shown in the pie chart.
Device
Status
The pie chart in this dashlet shows the total number of devices in the plaorm classied by health
status. Each health status is disnguished by a unique color.
If you hover over the chart, the status halo of each segment displays the number of devices with
the health status denoted by the segment color and the percentage share of the devices in the
total.
The legend by the chart displays the health statuses of devices. If you click on the name of a
parcular status, the devices with that health status is ltered out from the pie chart.
Device Group List Dashlet
The following table describes the main features of the Device Groups dashlet and Device Group Health
dashlet on the dashboard.
175

Figure 46: Device Group Dashlets
Dashlets Descripon
Device
Groups
To edit device group properes, click the device group name. For informaon on device group
properes, see "Manage Devices, Device Groups, and Network Groups" on page 121.
To display the list of devices that belong to a device group, click the integer number on this dashlet
that represents the number of devices included in the device group.
To display the list of playbooks applied on a device group, click the integer number that represents
the number of playbooks applied on the device group.
To remove this dashlet from the dashboard, click the X buon at the top corner of the dashlet.
The color of each segment in the pie chart represents the health status of the devices in the
device group. For example, if a chart has one half segment as green and the other half segment as
yellow, then no problems are detected in the number of devices displayed in the green segment
and minor problems are detected in the number of devices displayed in the yellow segment.
Clicking on a segment takes you to the Monitor > Device Conguraon page.
The coloring of the status halo in the pie chart segments represents the percentage of devices in
the device group that have the health status dened by the color. For example, if the circle halo is
all green, then the health of 100% of the devices in the device group is normal.
The legend by the pie chart displays the dierent health statuses of device groups. If you click on
the name of a parcular status such as healthy, the device groups with that status are ltered out
from the pie chart.
176

(Connued)
Dashlets Descripon
Device
Group
Health
The pie chart in this dashlet classies all device groups in the plaorm by their health status. Each
health status is disnguished by a unique color.
If you hover over the chart, the status halo of each segment displays the number of devices in the
device group with the health status denoted by the segment color and the percentage share of the
devices in the total.
The legend by the chart displays the device groups. If you click on the name of a parcular device
group, the devices in that device group are ltered out from the pie chart.
Network Group List Dashlet
The following table describes the main features of the Network Groups dashlet and Network Health
dashlet.
Figure 47: Network Group Dashlets
177

Dashlets Descripon
Network
Groups
To edit network group properes, click the network group name. For informaon on network
group properes, see "Manage Devices, Device Groups, and Network Groups" on page 121.
Click the X at the top of the dashlet to remove the dashlet from the dashboard.
Click the name of a network group in the dashlet to open the Network Health page of a parcular
network group.
The status icons displayed against a network group name represents the overall health status of
the network group. It can read no data or display an icon to indicate warning, alert, and healthy
status.
Network
Health
This dashlet shows a pie chart with several segments to classify the network groups based on their
network health. The segment size denotes the number of network groups with the status of that
segment. The segment color represents the overall health status of the network group(s) in that
segment.
For example, if you hover over a red segment in the chart, it displays the name(s) of the network
group(s) with major alerts and the total count of network groups with major alerts.
The legend by the pie chart displays the names of all network groups. If you click on the name of a
parcular network group, that group is ltered out from the pie chart.
Health Alert Dashlets
The following table describes the properes of the Health Alert dashlets.
178

Figure 48: Health Alert Dashlets
Dashlets Descripon
Health Alert
Severity
The pie chart in this dashlet shows the total number of health alerts generated in Paragon Insights
classied by the alert severity level.
Each segment of the pie chart represents a severity level disnguished by a unique color.
If you hover your cursor over the chart, the status halo of each segment displays the number of
alerts with the severity level denoted by the segment color and the percentage share of the alerts
in the total.
The legend by the chart displays the severity levels of the alerts. If you click on the name of a
severity level, the alerts marked with that severity level are ltered out from the pie chart.
Health Alert
Status
The pie chart in this dashlet shows alerts generated in Paragon Insights classied by their status in
the plaorm: open, closed, and expired.
Each segment of the pie chart represents a status disnguished by a unique color.
If you hover your cursor over the chart, the status halo of each segment displays the number of
alerts with the status denoted by the segment color and the percentage share of the alerts in the
total.
The legend by the chart displays the three main statuses of alerts. If you click on the name of an
alert status, the alerts marked with that status are ltered out from the pie chart.
179

(Connued)
Dashlets Descripon
Health Alert
Summary
The chart in this dashlet shows a me line view of alerts generated in Paragon Insights classied
by their severity levels.
Each severity level in the chart is disnguished by a unique color.
If you hover your cursor over any me point in the chart, the number of alerts per severity level is
displayed for that me.
The legend by the chart displays the severity levels of alerts. If you click on the name of an alert
severity level, alerts marked with that severity are ltered out from the chart.
TSDB Dashlets
Each TSDB table row, that is also known as a point, contains data for a parcular key at a given me. In
TSDB, write or read requests are executed by grouping mulple points into a batch point.
Buer Length denotes the number of batch points that are buered per node at a given me. Buered
Bytes denotes the total size of the batch points buered per TSDB node. In TSDB, a maximum of 1GB
of batch point can be buered per node.
Read or write errors occur when TSDB does not accept more requests as the buer is full or because of
issues in Kubernetes clusters. Errors can be minimized through database sharding. For more informaon,
see "Paragon Insights Time Series Database (TSDB)" on page 57.
Figure 49 on page 181 shows a sample TSDB dashboard.
180

Figure 49: Paragon Insights TSDB Dashlets
The following table describes the main features of the me series database dashlet on the Dashboard.
For informaon on how TSDB works, see "Paragon Insights Time Series Database (TSDB)" on page 57.
Dashlets Descripon
TSDB Buer
Bytes
The chart in this dashlet shows a me line view of buered bytes classied by the number of
nodes.
Each TSDB node in the chart is disnguished by a unique color.
If you hover your cursor over any me point in the chart, the total buered bytes per node for
that me is displayed.
The legend by the chart displays the nodes. If you click on the name of a node, buered bytes
data of that node is ltered out from the chart.
When the chart refreshes, the vercal axis of buered bytes is auto adjusted based on the data.
The data in vercal axis is in bytes.
To delete the dashlet, click the X at the top of the dashlet.
181

(Connued)
Dashlets Descripon
TSDB Buer
Length
The chart in this dashlet shows a me line view of buer length classied by the number of
nodes.
Each TSDB node in the chart is disnguished by a unique color.
If you hover your cursor over any me point in the chart, the buer length per node for that
me is displayed.
The legend by the chart displays the nodes. If you click on the name of a node, buer length
data of that node is ltered out from the chart.
The vercal axis shows data of buer length in terms of absolute number of batch points.
To delete the dashlet, click the X at the top of the dashlet.
TSDB Read
Errors Last 5
Minutes
The bar chart in this dashlet shows the number of TSDB read errors collected every 5 minutes
classied by the number of nodes.
The legend displays the nodes. If you click on the name of a node, the read error data of that
node is ltered out from the chart.
The horizontal axis shows read errors in absolute number.
To delete the dashlet, click the X at the top of the dashlet.
TSDB Write
Errors Last 5
Minutes
The bar chart in this dashlet shows the number of TSDB write errors collected every 5 minutes
classied by the number of nodes.
The legend displays the nodes. If you click on the name of a node, the write error data of that
node is ltered out from the chart.
The horizontal axis shows write errors in absolute number.
To delete the dashlet, click the X at the top of the dashlet.
Latest TSDB
Buer Length
The bar chart in this dashlet shows the number of TSDB buer length classied by the number
of nodes.
The legend displays the nodes. If you click on the name of a node, the buer length data of that
node is ltered out from the chart.
The horizontal axis shows buer length in absolute number.
To delete the dashlet, click the X at the top of the dashlet.
182
Health
IN THIS SECTION
Timeline View | 183
Tile View | 185
Table View | 187
Time Inspector View | 190
Use the Health page (Monitor > Health) to monitor and track the health of a single device, a device
group, or a network. You can also troubleshoot problems. Select a device group using the enty type
selectors (DEVICE, DEVICE GROUP, or NETWORK) located in the top le corner of the page. Once
selected, you can then select individual devices or all of the devices from the group by clicking the Select
devices pull-down menu. The page is divided into the following three main views that, when used
together, can help you invesgate the root cause of problems detected on your devices:
• "Timeline View" on page 183
• "Tile View" on page 185
• "Table View" on page 187
• "Time Inspector View" on page 190
Timeline View
In meline view, you can monitor real-me and past occurrences of KPI events agged with a minor or
major severity level health status. The general characteriscs and behaviors of the meline include (see
Figure 50 on page 184):
• Clicking on the right caret next to the Timeline View heading expands or collapses the meline.
• Each dot or line in the meline represents the health status of a unique KPI event (also known as a
Paragon Insights rule trigger) for a pre-dened KPI key with which Paragon Insights has detected a
minor or major severity level issue. The name of each event is displayed (per device) directly to the
le of its associated health status dot or line.
• The health status dot or line for each unique KPI event in the meline can consist of several dierent
KPI keys. Use le view and table view to see the health status informaon for the individual KPI keys.
183

• Only minor or major severity level KPI events are displayed in the meline. Yellow represents a minor
event, and red represents a major one.
• A KPI event that occurs once (at only one point in me) and does not recur connuously over me is
represented as a dot.
• A KPI event that occurs connuously over me is represented as a horizontal line.
• Timeline data is displayed for a 2-hour customizable me range.
• The red vercal line on the meline represents the current me.
• The blue vercal line on the meline represents the user-dened point of me for which to display
data.
Figure 50: Timeline view
The following table describes the main features of the meline:
Feature Descripon
Display informaon about a
dot or horizontal line in the
meline.
Hover over the dot or horizontal line to display the associated KPI event name,
device name, health status severity level, and event start and end mes.
Addional health status informaon about the KPI event can be found in le
view. For informaon about le view, see the "Tile View" on page 185 secon.
For the displayed data,
change the range of me (x-
axis) that is visible on the
page.
Opons:
• Click and drag the x-axis of the meline to the le or to the right.
• Click the Zoom In or Zoom Out buons in the top right corner of the
meline.
184

(Connued)
Feature Descripon
Choose a dierent 2-hour
me range of data to display.
Use the blue vercal line to customize the me range of data to display. Opons
for enabling the blue vercal line:
• Click inside the meline grid at the parcular point in me you want to
display data.
• In the date/me drop-down menu (located above the meline), select the
parcular point in me you want to display data ..
Data is generally displayed for 1 hour before and 1 hour aer the blue line.
Hover over the blue line to display the exact point in me that it represents.
Drag the blue line le or right to adjust the me.
NOTE: Auto-refresh is disabled whenever you enable the blue line. Re-enabling
auto-refresh disables the blue line and resets the meline to display the most
recent 2-hour me range of data.
Freeze the meline (disable
auto-refresh).
Toggle the auto-refresh switch to the le.
Unfreeze the meline (enable
auto-refresh).
Toggle the auto-refresh switch to the right.
Tile View
The le view uses colored les to allow you to monitor and troubleshoot the health of a device. The les
are organized rst by device group, then by device component topic, and lastly by unique KPI key (see
Figure 51 on page 186). By default, the le view data corresponds to the most recent data collected. To
customize the point in me for which data is displayed in le view, select a parcular point in me from
the date/me drop-down menu (located above the meline) or enable the blue vercal line in meline
view. For informaon about how to enable the blue vercal line, see the "Timeline View" on page 183
secon. The Composite toggle switch (not shown) at the upper right of the TILE VIEW, allows you to
select data from more than one device component topic to be shown in the Table View and, thus, the
Time Inspector View. This can be useful when topics must be combined to nd root cause for an issue.
For example, system memory usage could combine with output queue usage to create a performance
issue in an overloaded system.
185

Figure 51: Tile View
The following table describes the meaning of the severity level colors displayed by the status les:
Color Denion
Green The overall health of the KPI key is normal. No problems have been detected.
Yellow There might be a problem with the health of a KPI key. A minor problem has been
detected. Further invesgaon is required.
Red The health of a KPI key is severe. A major problem has been detected.
Gray No data is available.
The following table describes the main features of the le view:
186

Feature Descripon
Display informaon about
a status le.
Opons:
• Hover over a status le to display the name of the key, KPIs associated with the
key, and the status messages associated with the KPIs.
• Click on a status le. Informaon about the status le is displayed in table view.
For informaon about table view, see the "Table View" on page 187 secon.
Note: If the number of KPI keys exceeds 220, the keys are automacally
aggregated and grouped.
Display informaon in
table view about the
status les associated with
a single device component
topic.
Click on a device component topic name in le view. For informaon about table
view, see the "Table View" on page 187 secon.
Composite Toggle When acve, users can click on specic keys within the le groups. This allows you
to pass mulple KPIs to the Time Inspector View.
Table View
The table view allows you to monitor and troubleshoot the health of a single device based on Paragon
Insights data provided in a customizable table. You can search, sort, and lter the table data to nd
specic KPI informaon, which can be especially useful for large network deployments. To select which
aributes are displayed in the table, check the appropriate check box in the eld selecon bar above the
table (see Figure 52 on page 188). The checkbox on the le side of each row is used to help acvate the
Time Inspector view. Mulple rows can be selected at one me.
187

Figure 52: Table View
The following table describes the Paragon Insights aributes supported in table view:
Aributes Descripon
Time Time and date the event occurred.
Device Device name.
Group Device group name.
Topic Rule topic name.
Keys Unique KPI key name.
KPI Key Performance Indicator (KPI) name associated with an event.
Status Health status color. Each color represents a dierent severity level.
Message Health status message.
The following table describes the meaning of the severity level colors displayed by the Status column:
188

Color Denion
Green The overall health of the KPI key is normal. No problems have been detected.
Yellow There might be a problem with the health of a KPI key. A minor problem has been
detected. Further invesgaon is required.
Red The health of a KPI key is severe. A major problem has been detected.
Gray No data is available.
The following table describes the main features of the table view:
Feature Descripon
Sort the data by ascending or
descending order based on a specic
data type.
Click on the name of the data type at the top of the column by which
you want to sort.
Filter the data in the table based on a
keyword.
Enter the keyword in the text box under the name of a data type at the
top of the table (see Figure 52 on page 188).
Navigate to a dierent page of the
table.
Opons:
• At the boom of the table, click the Previous or Next buons.
• At the boom of the table, select the page number using the up/
down arrows (or by manually entering the number) and then press
Enter.
If the data in a cell is truncated, view
all of the data in a cell.
Opons:
• Hover over the cell.
• Resize the column width of the cell by dragging the right side of the
tle cell of the column to the right.
Row selecon checkbox Make this row’s data available for Time Inspector view.
189

Time Inspector View
Time Inspector is a composite view that provides a meline view of trigger condions on KPI data that
you selected in Table View. You can also drag and drop trigger condions to view the condions in one
graph or as separate graphs. Time Inspector was inially available only when the enty type DEVICE
GROUP is selected. However, starng with Paragon Insights Release 4.3.0, Time Inspector View is also
available when you select Device or Network enty type. Aer you select an enty type, you can access
me inspector view by clicking the TIME INSPECTOR buon.
This view allows you to drill down into eld-level data for specic triggers over a me line.
When the Health page is rst accessed, the TIME INSPECTOR buon is disabled. To acvate the TIME
INSPECTOR buon, you must:
• Select the Enty Type from the Health page.
In releases earlier than Paragon Insights Release 4.3.0, Time Inspector View was available only when
the enty type DEVICE GROUP is selected. However, starng with Paragon Insights Release 4.3.0,
Time Inspector View is also available when you select Device or Network enty type.
• Select one or more devices, device groups, or networks from the drop-down list next to the enty
type that you have selected.
• Have valid data in at least one device, device group, or network component topic in TILE VIEW.
NOTE: Topics showing “no data” will not work for enabling the Time Inspector view.
• Have data appearing in the TABLE VIEW secon. You can achive this by clicking the device, device
group, or network component topic header in TILE VIEW.
• Select the checkbox to the le of at least one of the rows in TABLE VIEW.
When clicked, the TIME INSPECTOR buon opens a pop-up window above the Health page. Figure 53
on page 191 below shows a me inspector window created from the system.storage usage topic for a
specic device.
190

Figure 53: Time Inspector Window
As you can see, the Time Inspector window has a mini meline at the top, an incremented line chart
below, and a chart selector secon at the boom. This parcular chart was created as a composite
(indicated by the merging blue arrow) of a le-system-ulizaon in the check-storage rule of the
system.storage topic.
Note that there are three elds in the check-storage rule: used-percentage, low-threshold, and high-
threshold. Since the chart was created as a composite (elds charted together) there are three lines on
the displayed chart. If the “chart elds separately” buon (diverging arrows) were clicked instead, you
would see 3 single-line charts showing the same data.
The more rules you select with the TABLE VIEW checkboxes, the more charts you can create in the
Time Inspector view.
191

Network Health
Use the Network Health page (Monitor > Network Health) to monitor and track the health of a Network
Group and troubleshoot problems. Select a Network Group using the drop-down list located in the top
le corner of the page. Comparable to the Device Group Health page (see the "Health" on page 183
secon), the Network Health page is divided into three main views: meline, le, and table. The
Network Health page provides similar features and funconality for a network group as the Device
Group Health page provides for a single device.
Graphs Page
IN THIS SECTION
Graph Types | 195
How to Create Graphs | 195
Managing Graphs | 195
Graph Tips and Tricks | 195
Use Cases | 195
You can use graphs to monitor the status and health of your network devices. Graphs allow you to
visualize data collected by Paragon Insights from a device, showing the results of rule processing. Access
the page from the le-nav panel Monitor>Graphs>Charts
NOTE: Graphs are refreshed every 60 seconds.
192

Figure 54: Example of Mulple Graph Panels on a Single Canvas
Graph types include me series graphs, histograms, and heatmaps.
Time series
graphs are the kind you are used to, showing the data in a ’2D’ format where the x-axis
indicates me while the y-axis indicates the value. Time series graphs are useful for real-me
monitoring, and also to show historical paerns or trends. This graph type does not provide insight into
whether a given value is ’good’ or ’bad’, it simply reports ’the latest value’.
Histograms
work quite dierently. Rather than show a connuous stream of data based on when each
value occurred, histograms aggregate the data to show the
distribuon
of the values over me. This
results in a graph that shows ’how many instances of each value’. Histograms also show data in a ’2D’
format, however in this case the x-axis indicates the value while the y-axis indicates the number of
instances of the given value.
Heatmaps
bring together the elements above and provide a ’3D’ view to help determine the deviaons
in the data. Like a me series graph, the x-axis indicates me, while the y-axis indicates the value. Then
the ’how many’ aspect of a histogram is added in. Finally, the third dimension—
color
—is added. It is
common to think of the colors as showing heath, i.e., red means ’bad, yellow means ’OK’, and green
means ’good’. However, this is not correct; the color adds context. For each column, the bars indicate the
various values that occurred. The color then indicates how oen the values occurred relave to the
neighboring values. Within each vercal set of bars, the values that occurred more frequently show
as ’hoer’ with orange and red, while those values that occurred less frequently show as shades of
green.
To help illustrate these graph types, consider the graphs shown below.
193

All three graphs are showing the same data—the running 1-minute average of CPU ulizaon on a
device over the last 24 hours. However, the way they visualize the data varies:
• The me series graph provides the typical view; each minute it adds the latest data point to the end
of the line graph. Time moves forward along the x-axis from le to right, and the data values are
indicated on the y-axis. What this graph doesn’t show is how oen each data point has occurred.
• The histogram groups together the values to show
how many
of each data point there are. Noce
the tallest bar is the one between 30 and 40, which means the most common 1-minute CPU average
value is in the 30-40% range. And how many mes did this range of values occur? Based on the y-
axis, there have been over 350 instances of values in this range. The next most frequently occurring
values are in the 40-50% range (almost 300 occurrences), while the 0-10% range has almost no
194
occurrences, suggesng this CPU is rarely idle. What this graph doesn’t show is how many of each
data point occurred within a given me range.
• The heatmap makes use of elements from the other two graph types. Each small bar indicates that
some number of instances occurred within the value range shown in the y-axis, at the given me
show in the x-axis. The color indicates which value ranges, for each given me, occurred
more
than
others. To illustrate this, noce the vercal set of bars towards the right of the graph, at 18:00. In this
example (at this zoom level), each column of vercal bars represents 12 minutes, and each small bar
represents a bucket of 15 values. So the rst (lowest) bar indicates that within this me range there
were some values in the 0-14 range. The bar above indicates that within this me range there were
some values in the 15-29 range, and so on. The color then indicates which bars have more values
than others. In this example, the third bar is red indicang that for those 12 minutes most of the
values fell into the 30-44 range (in this example the count is 21). By contrast, the rst bar is the most
green indicang that for those 12 minutes the least number of values fell into the 0-14 range (in this
example the count is 1). This ’heat’ informaon is also supported by the histogram; the most
frequently occurring values were those in the 30-40 range, which indeed is the ’hoer’ range in the
heatmap.
The conguraon model for graphs is to create graph panels and group them into one or more canvases.
To create a new graph panel on a canvas:
Graph Types
How to Create Graphs
Managing Graphs
Graph Tips and Tricks
Use Cases
1. Click the Monitor > Graph opon in the le-nav bar.
2. Choose one of the following two opons:
• To create a graph in a new canvas, click the + New Canvas buon.
• To create a graph within an exisng canvas, select the desired canvas in the Saved Canvas and
then click the Add Graph +buon.
195
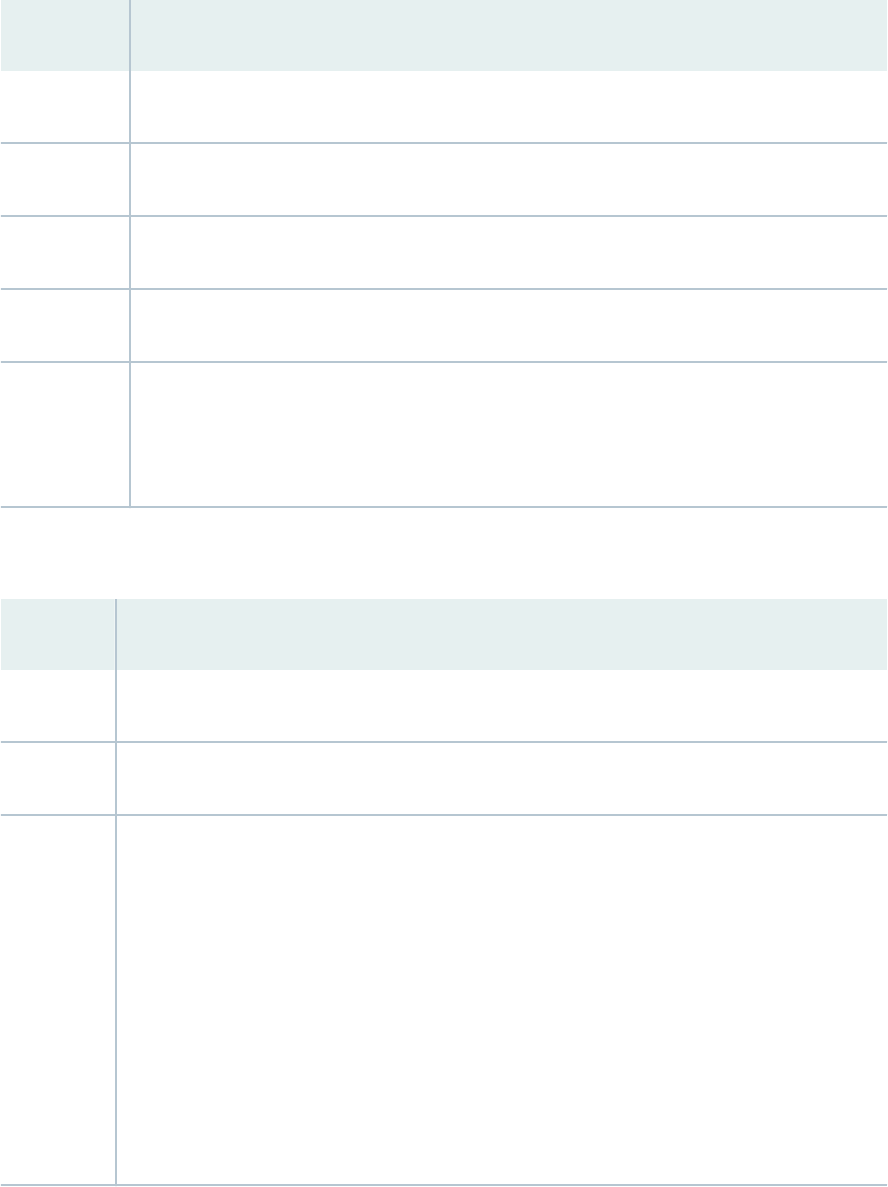
3. In the General secon, provide the general descripve informaon for the canvas (new canvas only)
and graph:
Aribute Descripon
Canvas Name Name of the canvas
Descripon (Oponal) Descripon for the canvas.
Graph Name Name of the graph panel.
Graph Type Opons include Time Series, Histogram, and Heatmap.
Time Range Choose the me range for the graph.
In real-me graphs, the me range sets the x-axis range. For example, selecng 12 hrs means
the x-axis shows the last 12 hours of data.
4. Move down to the Query secon. In the FROM secon, dene from where the data for the graph is
coming:
Aribute Descripon
Group Choose the device group or network group.
Device Choose a device from the group.
Topic / Rule Choose the Paragon Insights topic/rule name.
You can choose rolled-up measurements of elds you congured in rules. The rolled-up
measurements are displayed in the list as topic/rule_roll-up-order. For example, my-rule_hourly
and my-rule_yearly.
The roll-up measurement’s elds are listed as original-eld-name_aggregaon-type. For
example, eld-name_count and eld-name_mean.
Rolled-up measurements use aggregate funcons on eld data collected over a me to
summarize the data into a single data point. You can congure how frequently the eld data
must be rolled-up or summarized. The default roll-up order (frequency) available in Paragon
Insights are daily, hourly, monthly, weekly, or yearly.
196

5. In the SELECT secon, select the data eld and apply aggregaon and transformaon types to the
data:
Aribute Descripon
Field Choose a eld name.
This list is derived based on the elds dened in the selected topic/rule.
Aggregaon (Oponal) In the drop-down list, choose a data aggregaon type.
Transformaon (Oponal) In the drop-down list, choose a data transformaon type.
6. In the WHERE secon, lter data based on eld and KPI key:
Aribute Descripon
Tag Key / Field (Oponal) Choose a key or eld. A key is an index eld such as interface name.
This list is derived based on the keys and elds dened in the selected topic/rule.
7. In the GROUP BY secon, specify how to group the data based on me interval, ll, and KPI keys:
Aribute Descripon
$_interval (Oponal) Specify a me interval by which to group the data.
ll(null) (Oponal) Choose how to show a me interval when no data arrives from the device:
null (default) Report the mestamp and null as the output value.
none Report no mestamp and no output value.
0 Report 0 as the output value.
previous Report the value from the previous me interval as the output value.
linear Report the results of linear interpolaon as the output value.
197

(Connued)
Aribute Descripon
Tag Key (the +
icon)
(Oponal) Choose a tag by which to group the data. A key is an index eld such as
interface name.
This list is derived based on the keys and elds dened in the selected topic/rule.
8. (Oponal) Move down to the Visualizaon secon, and dene y-axis details.
9. Click Save to save the graph and display the data.
Managing Graphs
• To edit a graph, click the pencil icon located in the top right corner of the graph itself.
• To delete a graph, click the trash can icon located in the top right corner of the graph itself.
• To delete a canvas, click the trash can icon located in the top right corner of the canvas.
Graph Tips and Tricks
• To sort canvases on the Saved Canvas page, click on the column headings.
• To reorganize graphs on the screen, hover your mouse near the upper-le corner of a graph panel
and click-and-drag it to the desired posion.
• To resize a graph, hover your mouse over the lower-right corner of the graph panel and click-and-
drag it to the desired size.
• To change the color of graph elements, click the color bar for the desired line item under the graph.
• To zoom in on a graph, click and drag across the desired secon of the graph; to zoom out, double-
click on the graph.
• To isolate an element on the graph, click its related line item under the graph; to view all elements
again, click the same line item.
Use Cases
How do I monitor interface aps for a single interface?
1. Playbook used: interface-kpis-playbook
2. Graph conguraon
198

3. Graph panel
How do I monitor interface aps for all ’ge’ interfaces on a device in a single graph?
1. Playbook used: interface-kpis-playbook
2. Graph conguraon
199

3. Graph panel
How do I monitor system memory usage for all devices in a device group in a single graph?
1. Playbook used: system-kpis-playbook
2. Graph conguraon
200

3. Graph panel
201

How do I monitor RE CPU usage for mulple devices in a single graph?
1. Playbook used: system-kpis-playbook
2. Graph conguraon
202

203

3. Graph panel
How do I monitor RE CPU usage for mulple devices side by side?
1. Playbook used: system-kpis-playbook
2. Graph conguraon
204

3. Graph panel
Change History Table
Feature support is determined by the plaorm and release you are using. Use Feature Explorer to
determine if a feature is supported on your plaorm.
Release
Descripon
4.0.0 Paragon Insights Release 4.0.0 introduces GUI enhancements brought about by the migraon to a new
framework.
205

RELATED DOCUMENTATION
Manage Devices, Device Groups, and Network Groups | 121
Paragon Insights Rules and Playbooks | 141
Understand Resources and Dependencies
IN THIS SECTION
Resources | 207
Resource Dependencies | 208
Use Cases | 209
Paragon Insights monitors network resources — such as devices, interfaces, protocols, label switched
paths — through rules deployed in the network. A rule can capture specic informaon about a key
performance indicator (KPI) in a network and generate alerts when the KPI experiences an error event,
but rules cannot decipher the root cause of the error event. You require a wider view to correlate an
error event in one resource to a failure in another resource.
Paragon Insights tackles the need to connect events in a network through resources. A resource is a
building block that creates a wider network view by forming single-level dependencies vis-à-vis other
resources.
The following list has frequently used terms and concepts connected with resources:
Resource
A resource is a specic component that constute the network.
For example, chassis, line card, protocols, system memory, interfaces, and so on.
Resource
instances
Resources such as an interface, Flexible PIC Concentrators (FPC), router ids, or
virtual private networks can have many instances. An instance is a specic
realizaon of the resource. For example, an interface includes instances such as
ge-0/0/1, et-1/0/0, xe-2/0/1, and so on.
Property
Properes dene characteriscs of a resource. A property is comparable to elds in
rules.
206

For example, neighbor-id and maximum transmission unit (MTU) are characteriscs
of roung-opons resource and interface resource, respecvely.
Key properes in
resources
A key property uniquely idenes all instances of a resource.
For example,
interface-name
property uniquely idenes interface resource instance
with name ge-0/0/0 from other instances. MTU cannot be a unique property.
Resource
dependency
Denes the relaonship between two resources.
Dependent
resource
In a resource dependency, a dependent resource is the one that depends on another
resource. In a single-level resource dependency, a dependent resource is a child
resource of another resource.
Dependency
resources
In a resource dependency, a dependency resource is the one that impacts another
resource. In a single-level resource dependency, a dependency resource is a parent
resource of another resource.
Resources
A resource can be part of a device or the network. Device resources can be an interface, line cards,
chassis, OSPF, etc. Network resources are resources that span mulple devices in a network, such as
IPSec tunnels, VPN, etc.
As with rules, you congure resources under the topic hierarchy in Paragon Insights. A resource and its
properes are derived from rules. In this process, resources consolidate the following aspects in rule
conguraons.
• A resource, such as interface, is congured in dierent rules depending on which aspect of interface
the rule monitors.
• Each rule has dierent eld conguraon for a resource property.
An interface name can be congured as
interface-name
in one rule and
in-name
in another rule.
When you congure interface as a resource, you can choose the specic interface rules from which
Paragon Insights detects instances of interface resource. The exact rules you select to idenfy a
resource depend on your use case.
A resource property aggregates instances from referenced rules. When you congure a resource
property, you can refer mulple rules where the eld conguraons are dierent for that property.
207
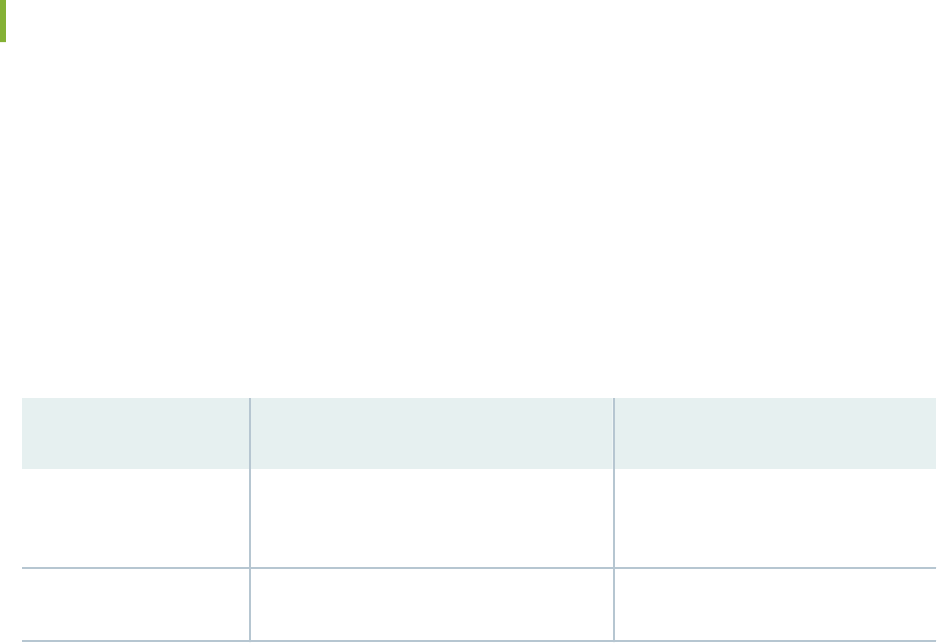
Resource Dependencies
Resource dependency denes the relaonship between a dependent resource (child resource) and a
dependency resource (parent resource). While conguring dependency, you begin with a dependent
resource and refer dependency resources that the child resource depends on. A dependency
conguraon also has terms that contain the logic to map dependency between two resources.
There are three types of dependency based on the type of resources involved, as described in Table 10
on page 208. You can dene dependencies between resources in the same device (Local Device and
Network), between resources in dierent devices (Other Device), between a network resource to
another network resource (Other Network), and a network resource to a device resource (Other Device).
Table 10: Types of Resource Dependency
Local Device and Network Other Device Other Network
Interface → line card Interface 1 (device 1) → interface 2 (device
2)
virtual private network (VPN)→
interface 1 (device 1)
Line card → chassis OSPF (device 1) → OSPF (device 2) VPN → IPSec tunnel
You can congure mulple single-level dependencies for a resource. Consider the following chains of
dependencies:
• VPN → LSP → interface → Line card
• VPN → interface → Line card
When you congure VPN as a resource, you can dene VPN’s dependency on Label Switched Paths
(LSPs) as one dependency and VPN’s dependency on interface as a second dependency. For LSP as a
resource, you can dene its dependency on interface. For interface as a resource, you can dene its
dependency on line card.
A dependency term logic can involve checking parts of a dependent resource property with parts of
dependency resource's property, checking all instances of the dependency resource, checking all devices
that have dependency resource instances, checking all or specic device groups, and checking all or
specic network groups.
Paragon Insights supports
matches-with
and user-dened funcons in the dependency condion.
As dependency conguraons can involve complex operaons, Paragon Insights also allows you to
execute such operaons in a funcon. The funcon returns a Boolean value that can be used to check
dependency.
208

Use Cases
Resource and dependency conguraons serve the following use cases:
Root cause
analysis
You can understand the root cause of a failure in your network. Refer the resource
dependencies and use the relaonship between resources to diagnose alerts generated
by triggers in rules.
Smart alarms
Through smart alarms, Paragon Insights links several resources that have a failure to
another resource that is the cause of the failure.
RELATED DOCUMENTATION
About the Resources Page | 209
About the Resources Page
IN THIS SECTION
Tasks You Can Perform | 210
Fields in Resources Table | 211
You can access the Resources page from Conguraon > Resources.
209

Figure 55: Resources and Dependency Visual Panel
The Resources page displays a visual representaon of default resources in the Paragon applicaon. It
also shows that a dependent (child) resource depends on the preceding dependency (parent) resource in
the model. The visualizaon is synchronous with Resources table so that you can work with resources
from either the visual model or the table. Starng with Paragon Insights Release 4.3, you can reset the
zoom level of the visual panel of resources using the reset buon aer zooming in or zooming out. You
can also drag and change the posion of resources on the visual panel. Paragon Insights retains any
change to the posion of resources, even aer you leave the Resources page.
When you click on a resource on the visualizaon, Paragon Insights shows key properes of the
resource, dependency resource (parent resource) of the current resource, and dependent resources of
the current resource (child resources).
When you click on the dependency arrow on the visualizaon, Paragon Insights shows the terms and
dependency type congured in the child resource.
Tasks You Can Perform
You can perform the following tasks in the Resources page:
• Add a resource from the resource visualizaon or table. See "Add Resources for Root Cause Analysis"
on page 212
• Congure dependency resource. See "Congure Dependency in Resources" on page 215
• Example Dependency Conguraon of OSPF protocol. See "Example Conguraon: OSPF Resource
and Dependency" on page 221
210

• Edit a resource from the resource visualizaon or table. See "Edit Resources and Dependencies" on
page 232
• Upload a resource from the visual panel or the resource table. See "Upload Resources" on page 235
• Download a resource from the visual panel. See "Download Resources" on page 236
• Clone and modify resource conguraon from the visual panel. See "Clone Resources" on page 236
• Delete a resource from the resource visualizaon or table. See "Delete Resources and Dependencies"
on page 237
• Filter a resource from the resource visualizaon or table. See "Filter Resources" on page 234
Fields in Resources Table
Table 11 on page 211 displays the elds on the Resource Dependency Model page.
Table 11: Fields on the Resource Dependency Model Page
Field Descripon
Name Names of topics that expands to resources within the respecve topic.
Descripon Descripon you enter for the resource during resource conguraon.
Keys When you expand the topics, you can view key properes you congured for each resource.
Dependency Parent resource that impacts the resource.
Generated Shows Paragon for system-generated (default) resources.
RELATED DOCUMENTATION
Understand Resources and Dependencies | 206
211
Add Resources for Root Cause Analysis
Resource conguraon requires references to rules you want to link to the resource. Ensure that you
congure the rules before you start resource conguraon.
To congure a resource:
1. Select Conguraon > Resources.
The Resources page appears.
2. Do one of the following:
• Click +Add Resource on the model map.
• Click + on the Resources table.
The Add Resource page appears.
3. Enter the details as described in Table 12 on page 212.
Table 12: Fields of Properes and Funcons in Resource Conguraon
Field Descripon
General Informaon
A resource, like rules, is dened under the
topic
hierarchy.
Resource Name Enter name of the resource. The name can follow the
regex paern: [a-zA-Z][a-zA-Z0-9_-]* and can have
up to 64 characters.
For example, chassis, interface, or system.
Topic Select the topic to which the resource belongs.
For example, interface, chassis, or protocol.
Descripon Enter a short descripon of the resource and the
resources on which this resource is dependent.
212

Table 12: Fields of Properes and Funcons in Resource Conguraon
(Connued)
Field Descripon
Properes
Properes are characteriscs such as name, MTU, neighbor-id etc. of a parcular resource. A property of one
resource can be matched with property of another resource to establish dependency.
Property name Enter name of the resource property. The name can
follow the regex paern: [a-zA-Z][a-zA-Z0-9_-]* and
can have up to 64 characters.
For example, neighbor-id and interface-name.
Property type Select the type of property input.
You can choose from string, integer, oang point, or
unsigned.
Add as a key If you enable a resource property as key, Paragon
Insights uses this property to uniquely idenfy
mulple instances of that property as a resource. You
can mark more than one property as key.
For example, in interface property that uses
interface-name as a key, Paragon Insights idenes
ge-0/0/1, ge-1/2/0, ge-1/0/0 as unique instances of
interface resource.
Source Conguraon
Rules and elds are the sources from which Paragon Insights discovers a resource property.
Rule Name Add a rule name in the topic/rule format.
For a resource property, you can add one or more
rules as sources.
Field Name Select a eld congured in the rule.
213

Table 12: Fields of Properes and Funcons in Resource Conguraon
(Connued)
Field Descripon
(Oponal) Funcons
You can enter a funcon in condional statements that check for resource dependency.
Funcon name Enter a funcon name that follows the [a-zA-Z][a-zA-
Z0-9_-]* paern.
Path to funcon Select the le name where funcons are dened.
Paragon Insights supports only Python funcons.
Method name Select the name of the funcon you want to execute
from the given le.
Descripon Enter a descripon of the funcon.
Arguments (Add Item)
Name Add argument or parameters dened in the funcon.
Mandatory Toggle the switch on if the funcon arguments you
added must be included when Paragon Insights calls
the funcon.
4. Click Save & Exit.
The Save Resource Conguraon dialog appears.
5. Do one of the following:
• Click Save and Deploy.
You can save the resource conguraon and deploy it.
• Click Save.
You can only save the resource conguraon but not deploy it.
If you save your conguraon by only entering the details in the table, you complete the resource
conguraon. You can see the new resource on the Resources page.
214

To connect the resource you add to another resource on the visual panel, you must congure
dependency for this resource.
RELATED DOCUMENTATION
Congure Dependency in Resources | 215
Congure Dependency in Resources
Before you congure dependency for a dependent (child) resource, you must complete conguring the
dependency (parent) resources. See "Add Resources for Root Cause Analysis" on page 212 for more
informaon.
When you congure dependency for a child (dependent) resource, you congure terms that have the
logical condions to check for dependency. Starng with Paragon Insights Release 4.3, you can swap the
order of dependency terms in the Dependency page. Paragon Insights executes the terms based on the
sequence in which the terms appear in the GUI. The rst term is evaluated rst, followed by the second,
the third, and so on.
To congure a resource dependency:
1. Select Conguraon > Resources.
The Resources page appears.
2. Select a resource from Resources table and click edit (pencil icon).
The Edit Resource page appears.
3. Click Next unl you view the Dependency page.
4. Enter the details as described in Table 13 on page 216.
5. Click Save.
The Dependency page appears.
6. Click Next.
You can a see visual representaon of the resource and dependency conguraon that you added.
7. (Oponal) Click View Tree to view a collapsed view of the resource and the dependency
conguraons.
8. (Oponal) Click View JSON to preview the JSON format of the conguraon.
9. Click Save & Exit.
The Save Resource Conguraon dialog appears.
10. Do one of the following:
215

• Click Save and Deploy.
Paragon Insights saves and deploys the conguraon to form dependency between the
resources and generate smart alarms.
• Click Save.
Paragon Insights saves the conguraon to form dependency but does not generate smart
alarms.
You can see the new resource and its dependency mapped in the Resources page.
Table 13: Fields in Dependency Conguraon
Field Descripon
Dependent-resource-name
depends on
Enter conguraon details of dependency (parent) resource to establish dependency with dependent (child)
resource.
Resource Name Select the dependency resource that impacts your dependent (child) resource.
Add Variables
Variables in this secon are used to extract parts of the child resource’s property. Such variables are used to
check dependency using condional statements.
Variables congured here can be used to check dependency in all terms.
Name Enter name for the variable. The name can follow the regex paern: [a-zA-Z]
[a-zA-Z0-9_-]* and can have up to 64 characters.
For example, interface-name-split.
216

Table 13: Fields in Dependency Conguraon
(Connued)
Field Descripon
Expression Enter a regular expression to extract parts of a property value.
See regex package for more informaon.
For example, if you use the regular expression “.*(\d+)/(\d+)/\d+” on
interface-name property of interface resource, you can extract line card
number and PIC number.
The example regex forms two capture groups to extract line card number and
PIC number. The rst capture group, which is line card number, can be
referred as interface-name-split-1 and second capture group, which is PIC
number, can be referred as interface-name-split-2.
Resource label Select the name of the dependent (child) resource.
Field Select a property in the child resource on which regex expression should be
applied.
Case sensive Enable this eld.
If you enable this eld, Paragon Insights ignores the case of resource
properes when processing condions.
Add Terms (Terms > Add Item)
Terms contain the logic to check for a dependency relaon between resources.
Term Name Enter a term name that follows the [a-zA-Z][a-zA-Z0-9_-]* paern.
Depends on Mulple
Instances
Enable this eld if your dependency logic involves checking if a child resource
property is dependent on mulple instances of a parent resource property.
For example, you congured Aggregated Ethernet (link aggregaon group) as a
dependent (child) resource to interface resource. As AE depends on mulple
links (interface resource), you must enable Depends on Mulple Instances
knob.
217

Table 13: Fields in Dependency Conguraon
(Connued)
Field Descripon
Dependency Type Select the type of dependency.
Local Device and Network dependency is the default opon.
If you select Other Device dependency, congure details in For Every Device
secon.
If you select Other Network dependency, congure details in For Every
Network Group secon.
See "Understand Resources and Dependencies" on page 206 for more
informaon.
Evaluate Next Term This eld is disabled by default.
Enable this eld if your dependency logic involves checking condion in other
terms.
(Oponal) Add Variable Enter the following details of a child resource property:
• Name
• Regular Expression
• Resource Name
• Resource Property Field
You can congure a variable for a child resource property. Variable you
congure here can only be used in condional statements within the term.
For Every Device
Selects a device from a list of devices in device groups.
Label As Enter a name for the dependency (parent) resource instance that is selected.
The name must follow the [a-zA-Z][a-zA-Z0-9_-]* paern.
Across all device groups Enable this eld if you want Paragon Insights to check devices in all device
groups for dependency.
218

Table 13: Fields in Dependency Conguraon
(Connued)
Field Descripon
In device groups Enter the names of device groups. The child resource property will be checked
against devices in the specied device groups for dependency.
For Every Network Group
Instructs Paragon Insights to perform the dependency logic in all or select network groups.
Label As Enter a name for the dependency (parent) resource instance that is selected.
The name must follow the [a-zA-Z][a-zA-Z0-9_-]* paern.
Across all network groups Enable this eld if you want Paragon Insights to check all network groups for
dependency.
In network groups Enter the names of network groups. The child resource property will be
checked against instances of network resource property in the specied
network groups.
Locate Resource
The locate resource iterates through all instances of a given resource.
Resource Name Select a resource.
If the resource type is Local Device & Network, the resource in the list is of
the format
topic-name/resource-name
.
If the resource type is Other Device or Other Network, then the resource in
the list is of the format
for every device/network label-as:topic-name/
resource-name
.
Label As Enter a label name.
Paragon Insights stores each instance of the selected resource in the label. For
example, instances such as interface instances or OSPF sessions.
219

Table 13: Fields in Dependency Conguraon
(Connued)
Field Descripon
(Oponal) Add Variable Enter the following details of a resource property of the selected resource:
• Name
• Regular Expression
• Resource Name
• Resource Property Field
You can congure a variable for a property of the selected resource. Variable
you congure here can only be used in condional statements within the
term.
Condions Condions in Locate Resource are used to idenfy if the selected resource is
correct one or not. If the condion does not match for a parcular instance it
picks the next instance and checks the condion. This connues unl we get
an instance where condions matches, or all the instances of the resources
are exhausted.
To check dependency, select a resource property in le-hand side (LHS), a
remote resource property in RHS and the operator to check for a condion.
Paragon Insights supports
matches-with
as a condion. You can also add
funcons in the LHS eld of the condional statement.
RELATED DOCUMENTATION
Add Resources for Root Cause Analysis | 212
Example Conguraon: OSPF Resource and Dependency | 221
Understand Resources and Dependencies | 206
220

Example Conguraon: OSPF Resource and
Dependency
Before you begin conguring the OSPF resource and dependency, you must deploy the following
conguraons:
• Sub-interface as a resource with interface-name and sub-interface index as key properes.
• Roung opons as a resource with router-id as a key property.
The example conguraons create OSPF protocol dependency between two devices. The OSPF
protocol runs on an interface between two devices. So, the protocol forms two types of dependencies in
the example conguraon. The rst dependency is between OSPF and the device, known as Local
Device and Network dependency in the conguraon. The second dependency is between OSPF
protocol and the remote device, known as Other Devices dependency in the conguraon. Paragon
Insights establishes the two dependencies using the following properes in device 1 and device 2 as
shown in Figure 56 on page 221.
Figure 56: Resources and Properes Used for OSPF Dependencies
The sub-interface properes and OSPF interface names are used to create local dependency between a
local device and the OSPF session at one end and between the remote device and the OSPF session at
the other end.
The neighbor ID, designated router address and the device's router ID are used to create device-to-
device (Other Device) dependency.
221
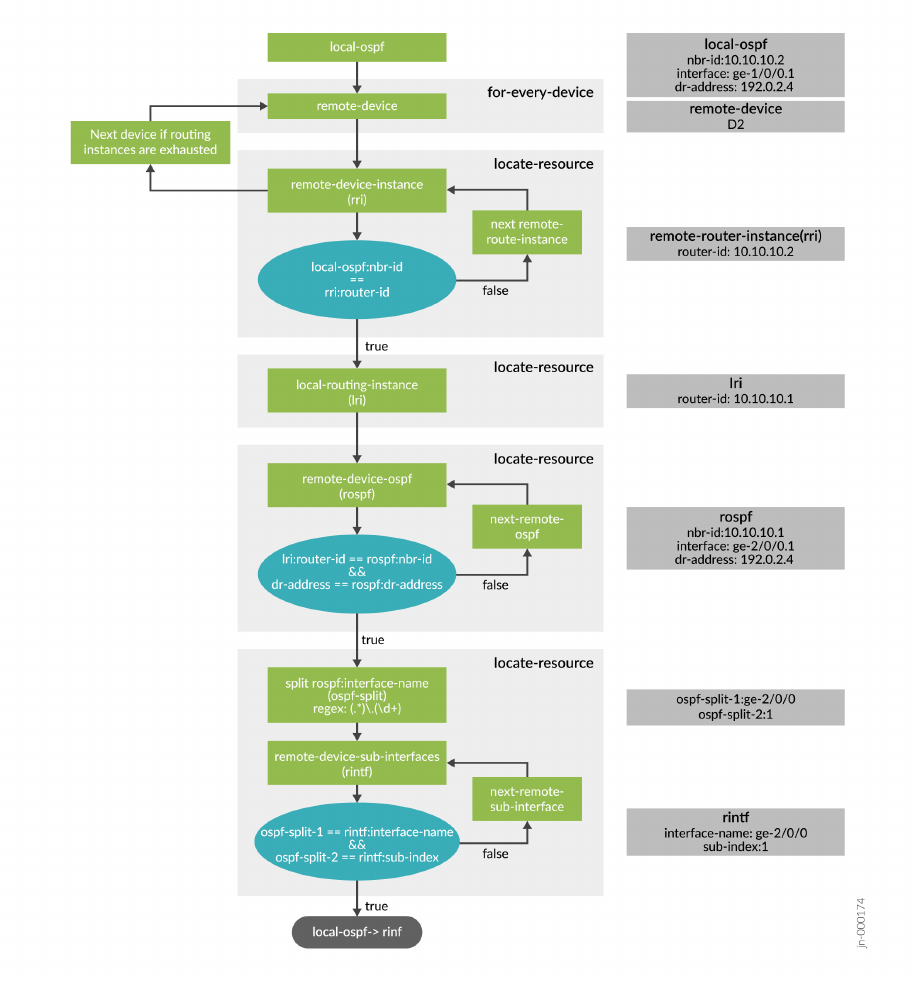
FIGURE2 shows how the iteraon in locate resource conguraons creates the device-to-device
dependency.
Figure 57: Locate Resource Flowchart of OSPF Other Device Dependency
To congure OSPF resource and its dependencies:
1. Select Conguraon > Resources.
222

The Resources page appears.
2. Select OSPF resource from the Resources table and click edit (pencil icon).
The Edit Resource page appears.
3. Enter the details as described in Table 14 on page 223.
Table 14: Fields of Properes in OSPF Resource Conguraon
Field Descripon
General Informaon
A resource, like rules, is dened under the
topic
hierarchy.
Resource Name Enter ospf.
The name can follow the regular expression paern:
[a-zA-Z][a-zA-Z0-9_-]* and can have up to 64
characters.
For example, the name can also be Ospf-1.
Topic Select protocol.
Descripon Enter a short descripon of OSPF dependencies.
Property Designated Router Address
Properes are characteriscs such as name, MTU, neighbor-id etc. of a parcular resource. A property of
one resource can be matched with the property of another resource to establish dependency.
Property name Enter dr-address.
The name can follow the regular expression paern:
[a-zA-Z][a-zA-Z0-9_-]* and can have up to 64
characters.
Property type Select String.
223

Table 14: Fields of Properes in OSPF Resource Conguraon
(Connued)
Field Descripon
Add as a key Not applicable.
If you enable a resource property as key, Paragon
Insights uses this property to uniquely idenfy
mulple instances of that property as a resource.
You can mark more than one property as key.
For example, in interface property that uses the
interface name as a key, Paragon Insights idenes
ge-0/0/1, ge-1/2/0, ge-1/0/0 as unique instances
of the interface resource.
Source Conguraon
Rules and elds are the sources from which Paragon Insights discovers a resource property.
Rule Name Select protocol.ospf/check-ospf-neighbor-
informaon.
Field Name Select dr-address.
Property Interface Name
Properes are characteriscs such as name, MTU, neighbor-id etc. of a parcular resource. A property of
one resource can be matched with the property of another resource to establish dependency.
Property name Enter interface-name.
The name can follow the regex paern: [a-zA-Z][a-
zA-Z0-9_-]* and can have up to 64 characters.
Property type Select String.
224

Table 14: Fields of Properes in OSPF Resource Conguraon
(Connued)
Field Descripon
Add as a key Enable this opon.
If you enable a resource property as key, Paragon
Insights uses this property to uniquely idenfy
mulple instances of that property as a resource.
You can mark more than one property as key.
For example, in interface property that uses the
interface name as a key, Paragon Insights idenes
ge-0/0/1, ge-1/2/0, ge-1/0/0 as unique instances
of the interface resource.
Source Conguraon
Rules and elds are the sources from which Paragon Insights discovers a resource property.
Rule Name Select protocol.ospf/check-ospf-neighbor-
informaon.
Field Name Select interface-name.
Property Neighbor ID
Properes are characteriscs such as name, MTU, neighbor-id etc. of a parcular resource. A property of
one resource can be matched with the property of another resource to establish dependency.
Property name Enter neighbor-id.
The name can follow the regular expression paern:
[a-zA-Z][a-zA-Z0-9_-]* and can have up to 64
characters.
Property type Select String.
225
Table 14: Fields of Properes in OSPF Resource Conguraon
(Connued)
Field Descripon
Add as a key Enable this opon.
If you enable a resource property as key, Paragon
Insights uses this property to uniquely idenfy
mulple instances of that property as a resource.
You can mark more than one property as key.
For example, in interface property that uses the
interface name as a key, Paragon Insights idenes
ge-0/0/1, ge-1/2/0, ge-1/0/0 as unique instances
of the interface resource.
Source Conguraon
Rules and elds are the sources from which Paragon Insights discovers a resource property.
Rule Name Select protocol.ospf/check-ospf-neighbor-
informaon.
Field Name Select neighbor-id.
4. Click Next twice to go to the Dependency page.
The Dependency page appears.
5. Click + in the Dependency page.
A new Resource secon appears.
6. Enter the details as described in Table 15 on page 226.
Table 15: Local Device and Network Dependency
Conguraon
Field Descripon
OSPF depends on
Resource Name Select interfaces/sub-interfaces.
226

Table 15: Local Device and Network Dependency Conguraon
(Connued)
Field Descripon
Add Terms (Terms > Add Item)
Terms contain the logic to check for a dependency relaon between resources.
Term Name Enter i-dependency
The name follows the [a-zA-Z][a-zA-Z0-9_-]* paern.
Depends on Mulple Instances Enable this opon.
Paragon Insights checks with mulple instances of the property
interface name and the property sub-interface index congured in
resource sub-interface.
Dependency Type Select Local Device & Network.
See "Understand Resources and Dependencies" on page 206 for
more informaon on dependency types.
Add Variable Name: Enter ospf-interface-split.
Expression: Enter (.*)\.(\d+)
Field: Enter $interface-name.
Locate Resource
Iterates over all instances of the interfaces and the sub-interface index in resource sub-interfaces to nd
local dependency.
Resource Name Select interfaces/sub-interfaces
Label As Enter i.
Paragon Insights stores each instance of the interface resource to
check for dependency.
227

Table 15: Local Device and Network Dependency Conguraon
(Connued)
Field Descripon
Condions
Condions in Locate Resource are
used to idenfy if the selected
resource is the correct one or not. If
the condion does not match a
parcular instance, Paragon Insights
picks the next instance and checks for
the condion. This connues unl we
get an instance where the condion
matches, or all the instances of the
resource are exhausted.
The rst condion checks for a match between the OSPF
resource’s interface property and the interface resource’s
interface instances.
In the le-hand side (LHS), select $ospf-interface-split-1.
Select
matches-with
as operator.
In the right-hand side (RHS), select $i:interface-name.
Click + to add a second condion that checks for a match
between the OSPF interface’s sub-interface index and the
resource sub interface’s sub-interface index.
In the LHS, select $ospf-interface-split-2.
Select
matches-with
as operator.
In the RHS, select $i:sub-interface-index.
7. Click Save.
The Edit Resource page appears.
You can nd the new term in Terms secon. The OSPF's interface name and interface sub-index is
checked against the sub interface resource's interface name and sub-index. When Paragon Insights
nds a match, the interface from the OSPF resource monitored in a device forms a local
dependency with the interface from the interface resource of the same device.
8. Click + in the Terms secon.
You can add a second term to congure Other Device dependency for OSPF resource.
9. Enter the details as described in Table 16 on page 228.
Table 16: Other Device Term
Conguraon
Field Descripon
Add Terms (Terms > Add Item)
Terms contain the logic to check for a dependency relaon between resources.
228
Table 16: Other Device Term Conguraon
(Connued)
Field Descripon
Term Name Enter i-remote-dependency.
The name must follow the [a-zA-Z][a-zA-Z0-9_-]* paern.
Dependency Type Select Other Device dependency.
See "Understand Resources and Dependencies" on page
206 for more informaon on dependency types.
For Every Device
Selects a device from a list of devices in device groups.
Label As Enter remote-device.
The name follows the [a-zA-Z][a-zA-Z0-9_-]* paern.
Locate Resource
Dene condion to check if the local device’s OSPF neighbor-id is the remote device’s router-id.
Resource Name Enter remote-device:protocols/roung-instance.
Label As Enter remote-roung-instance.
Condions
Condions in Locate Resource are used to
idenfy if the selected resource is the correct
one or not. If the condion does not match a
parcular instance, Paragon Insights picks the
next instance and checks for the condion.
This connues unl we get an instance where
the condion matches, or all the instances of
the resource are exhausted.
In the LHS, select $neighbor-id.
In the operator eld, select
matches-with
.
In the RHS, select $remote-roung-instance:router-id.
229

Table 16: Other Device Term Conguraon
(Connued)
Field Descripon
Locate Resource
Use resource Roung Instance to collect router-id of the local device.
Resource Name Enter protocol/roung-instance.
Label As Enter label name as local-roung-instance.
Locate Resource
Dene condion to check if the remote device’s OSPF neighbor-id matches with the router-id of the local
device.
Resource Name Enter remote-device: protocols/ospf.
Label As Enter remote-ospf.
Condions
Condions in Locate Resource are used to
idenfy if the selected resource is the correct
one or not. If the condion does not match a
parcular instance, Paragon Insights picks the
next instance and checks for the condion.
This connues unl we get an instance where
the condion matches, or all the instances of
the resource are exhausted.
In the LHS, enter $local-roung-instance:router-id.
In the operator eld, select
matches-with
.
In the RHS, enter $remote-ospf:neighbor-id.
Click + to add a second condion that checks for a match
between local device OSPF’s designated router address
and remote OSPF’s designated router address.
In the LHS, enter $dr-address
In the operator eld, select
matches-with
.
In the RHS, enter $remote-ospf:dr-address
Locate Resource
Dene a condion to check if interface name and sub-index in the remote OSPF matches with interface
name and sub-index of the remote device’s interface.
230

Table 16: Other Device Term Conguraon
(Connued)
Field Descripon
Resource Name Enter remote-device: interfaces/sub-interface.
Label As Enter remote-i.
Condions
Condions in Locate Resource are used to
idenfy if the selected resource is the correct
one or not. If the condion does not match a
parcular instance, Paragon Insights picks the
next instance and checks for the condion.
This connues unl we get an instance where
the condion matches, or all the instances of
the resource are exhausted.
The rst condion checks for a match between remote
OSPF resource’s interface property and remote interface
resource’s interface instances.
In the LHS, select $ospf-remote-interface-split-1.
Select
matches-with
as operator.
In the RHS, select $remote-i:interface-name.
Click + to add a second condion that checks for a match
between remote OSPF interface’s sub interface index and
remote interface instance’s sub interface index.
In the LHS, select $ospf-remote-interface-split-2.
Select
matches-with
as operator.
In the RHS, select $remote-i:sub-interface-index.
10. Click Next.
You can see a collapsed view of the resource and the dependency conguraon you added.
11. (Oponal) Click View JSON to preview the JSON format of the conguraon.
12. Click Save & Exit.
The Save Resource Conguraon dialog appears.
Do one of the following:
a. Click Save and Deploy.
Paragon Insights saves and deploys the conguraon to generate smart alarms.
b. Click Save.
Paragon Insights saves the conguraon but does not generate smart alarms based on the new
resource and dependency conguraon you add.
You can see the OSPF resource and its dependency in the visual panel of the Resources page.
231
RELATED DOCUMENTATION
Congure Dependency in Resources | 215
Add Resources for Root Cause Analysis | 212
Edit Resources and Dependencies
IN THIS SECTION
Edit a Resource | 232
Edit Resource Dependency | 233
Users can edit Paragon Insights-generated (system) resources, user-generated resources, and
dependencies from the Resources page (Conguraon > Resources). If you want to restore original
conguraon of system resources, you can restore by uploading the conguraon les. Conguraon
les for system resources are available on Paragon Insights server and GitHub. See "Upload Resources"
on page 235 for more informaon.
NOTE: If you edit a system resource and later restore it to the original conguraon, Paragon
Insights connues to display the resource status as modied.
Edit a Resource
To edit a resource:
1. Select Conguraon > Resources.
The Resources page appears.
2. Do one of the following:
• Select the resource from Resources table and click edit (pencil icon).
• Select the resource on the visual panel and click Edit in the informaon pane of the resource.
The Edit Resources page appears.
232

3. Make changes to the conguraon.
See "Add Resources for Root Cause Analysis" on page 212 for eding resource conguraon.
See "Congure Dependency in Resources" on page 215 for eding dependency conguraon.
4. Click Save & Exit.
Do one of the following:
• Click Save and Deploy.
Paragon Insights saves and deploys the conguraon to generate smart alerts.
• Click Save.
Paragon Insights saves the conguraon but does not generate smart alerts based on the edits in
resource conguraon.
You can view changes in the informaon pane when you click on the edited resource.
SEE ALSO
Delete Resources and Dependencies | 237
Edit Resource Dependency
To edit a resource:
1. Select Conguraon > Resources.
The Resources page appears.
2. Click on the arrow that shows dependency from the resource you want to edit to a parent resource.
The dependency page of the child resource appears.
3. Edit the dependency conguraon.
See "Congure Dependency in Resources" on page 215 for eding dependency conguraon.
4. Click Save & Exit.
Do one of the following:
• Click Save and Deploy.
Paragon Insights saves and deploys the conguraon.
• Click Save.
Paragon Insights saves the conguraon but does not deploy it.
233

If you changed the dependency type or Term name, you can view the changes in dependency
informaon when you hover over the arrow. If you changed the depends on (parent) resource, you
can view the edited resource connected to the new parent resource.
RELATED DOCUMENTATION
Delete Resources and Dependencies | 237
Filter Resources
The Resource Dependency map (visual panel) has many system resources. The visual panel expands as
you add other resources. You can focus on select resources and their dependencies through a keyword
search for a resource in the Resources page and by ltering resources.
When you lter or search a resource, the other resources gray out on the visual panel and in the
Resources table.
To lter a resource:
1. Select Conguraon > Resources.
The Resources page appears.
2. Click the lter icon (funnel) on the visual panel.
3. Click Add Filter in the menu.
The Add Criteria page appears.
4. Enter the details as described in Table 17 on page 235.
You can see the ltered resources in the visual panel and the resources table.
5. (If you added mulple criteria) Do one of the following:
a. Select AND if you want Paragon Insights to lter resources based on both the criteria.
b. Select OR if you want Paragon Insights to lter resources based on either criterion.
6. Click Save if you want to reuse the lter you set.
The Save Filter page appears.
7. Enter a name for the lter.
8. Toggle the default switch on if you want that lter to appear rst on the saved lter list.
9. Click OK.
10. Click the lter icon (funnel) icon to view all your saved lters.
234

If you click the lter icon (funnel) aer saving lters, you can view only the saved lters and not the
Add Filter menu. You must hide lters to view the Add Filter menu.
Table 17: Aributes in Add Criteria Page
Field Descripon
Field Select Topic Name, Resource Name, or Keys to lter the resources.
Condion You can enter if the lter criterion includes, equal to, or not equal to your input in Value eld.
Value Enter a topic's name, resource's name, or a key name.
The entry in the Value eld depends on your selecon in the Field.
RELATED DOCUMENTATION
Edit Resources and Dependencies | 232
Upload Resources
You can upload resource conguraon from the Resources page (Conguraon > Resources). You can
upload one resource le at a me but add mulple resource conguraons in a resource le. Ensure
that .resource is the le extension of a resource le.
If you added dierent resource conguraons in a resource le, each conguraon appears as a disnct
resource on the Resources page. If a resource you add in the resource le already exists in Paragon
Insights, the new conguraon of that resource overrides the exisng conguraon when you upload
the .resource le.
NOTE: The name of each resource inside a resource conguraon le (.resource le) must be
unique.
To upload a resource le:
1. Click Conguraon > Resources.
235

The Resources page appears.
2. On the visual panel, click Upload Resource File.
An Upload Resource File page appears.
3. Click Browse and select the resource le saved in your local system.
4. Click OK.
You can see a conrmaon message aer the resource uploads successfully. The new resource or
resources appear on the Resources page (visual panel).
RELATED DOCUMENTATION
Download Resources | 236
Clone Resources | 236
Download Resources
To download a resource conguraon:
1. Click on the resource that you want to download.
A page that shows details of the resource appears.
2. On the page, click the download (down arrow) icon.
3. Click Save File and OK in the pop-up window to save the resource.
The resource conguraon is downloaded to your local system as a compressed tar le.
RELATED DOCUMENTATION
Upload Resources | 235
Clone Resources | 236
Clone Resources
To clone a resource:
1. Click on the resource that you want to clone.
236

A page that shows details of the resource appears.
2. On the page, click the copy icon.
The Clone Resource page appears with the resource and dependency conguraons of the resource
you cloned.
3. Enter a name for the new resource in the Resource Name eld.
4. Modify resource conguraon details, if necessary.
See "Add Resources for Root Cause Analysis" on page 212 for details about the resource
conguraon elds.
5. Modify resource dependency details, if necessary.
See "Congure Dependency in Resources" on page 215 for details about the dependency
conguraon elds.
6. Do one of the following:
• Click Save and Deploy.
Paragon Insights saves and deploys the resource and dependency conguraon to generate smart
alarms.
You can see the new resource on the Resources page.
• Click Save.
Paragon Insights saves the resource and dependency conguraon. When you only save the
conguraons, smart alarms are not generated.
You can see the new resource on the Resources page.
RELATED DOCUMENTATION
Upload Resources | 235
Download Resources | 236
Delete Resources and Dependencies
IN THIS SECTION
Delete a Resource | 238
237

Delete Resource Dependency | 239
NOTE: You cannot delete default (system-generated) resources.
Delete a Resource
To delete a resource:
1. Select Conguraon > Resources.
The Resources page appears.
2. Do one of the following:
a. Select the resource from Resources table and click delete (trash icon).
b. Select the resource you want to delete on the resource visualizaon.
The informaon pane of the resource page appears.
• Click Delete.
A delete conrmaon message appears.
3. Do one of the following:
a. Click Delete.
Paragon Insights deletes the resource.
b. Click Delete and Deploy.
Paragon Insights deletes the resource and deploy the conguraon changes that occur as a result
of the deleon.
SEE ALSO
Edit Resources and Dependencies | 232
238

Delete Resource Dependency
To edit a resource:
1. Select Conguraon > Resources.
The Resource Dependency Model page appears.
2. Click the resource dependency you want to delete on the resource visualizaon.
The informaon pane of the dependency appears.
3. Click Delete.
A delete resource dependency conrmaon dialog appears.
4. Click OK.
Paragon Insights removes the dependency you selected.
RELATED DOCUMENTATION
Edit Resources and Dependencies | 232
Monitor Network Device Health Using Grafana
IN THIS SECTION
Grafana Overview | 239
Access the Grafana UI | 240
Run a Query | 240
View Prepopulated Graphs | 242
Back Up and Restore Grafana Data | 243
Grafana Overview
Starng with Paragon Insights (formerly HealthBot) Release 4.1.0, you can use the Grafana user
interface (UI) to view data of your network devices. Grafana UI renders data from Paragon Insights me
239

series database (TSDB). You can view this data in the form of charts, graphs, histograms, and heat maps.
You can also query data and view the results from the Grafana UI.
In releases earlier than Paragon Insights Release 4.1.0, you could only create and view graphs from the
Charts page of the Paragon Insights UI.
Grafana is an open-source data visualizaon tool. You use Grafana to create and view charts, graphs,
and other visuals to help organize and understand data. Paragon Insights uses Grafana to render graphs
that you create from the Charts page of the UI. With Release 4.1.0, you can create graphs and other
visuals directly from the Grafana UI.
For more informaon on Grafana, see Grafana Documentaon.
Access the Grafana UI
You can access Grafana UI by selecng Monitor > Graphs > Grafana from the Paragon Insights UI.
You can access Grafana by logging into the Paragon Insights UI. All logged in users can access and use
Grafana and its features by clicking Monitor > Graphs > Grafana.
You use dashboards to monitor the status and health of devices. Follow these steps to view exisng
dashboards or create new dashboards from the Grafana UI:
• To create a new dashboard from the Grafana UI, click the plus (+) icon >Create > Dashboards > Add
Panel from the right-nav panel.
• To view exisng dashboards from the Grafana UI, click Dashboards from the right-nav panel.
Run a Query
You can run queries from the Grafana UI. For more informaon, see Query a Data Source.
When you create a chart, the data is rendered from the TSDB database, an open-source me series
database. Informaon sent to and received from the TSDB database is in the inuxDB format. With
Release 4.1.0, Paragon Insights also supports Grafana's open-source inuxDB plugin. Aer you run a
query from the Grafana UI, the open-source inuxDB sends a backend request to the Paragon Insights
TSDB. The Paragon Insights TSDB sends the response in inuxDB format.
In Paragon Insights Release 4.1.0, when you run a query from the Grafana UI using inuxDB as a data
source, you can only view data of a specic device of a device group. You use syntax parameters such as
FROM and SELECT that the inuxDB recognizes. You cannot view aggregate data of a device group, or view
240

aggregate data of mulple device groups using the inuxDB plugin. However, with Release 4.2.0,
Paragon Insights supports the Juniper Paragon Insights TSDB plugin.
The Juniper Paragon Insights TSDB plugin is based on the inuxDB plugin but also supports the ability
to view aggregate data of a device group, or view aggregate data of mulple device groups. You can
view aggregate data by using Syntax parameters such as DEVICE, DEVICE GROUPS, and MEASUREMENT. The default
data source for Paragon Insights in Grafana is based on the Juniper Paragon Insights TSDB plugin.
For more informaon on supported syntax parameters, see Table 18 on page 241.
Figure 58: Querying from Grafana UI
Table 18: Examples of InuxDB and TSDB Syntax Parameters
InuxDB Querying Opons TSDB Querying Opons
FROM—Select the data source (device,
device group, topic/rule).
DEVICE—Select one or more than one device for this query.
SELECT—Select the data eld, and apply
aggregaon and transformaon types
to the data.
DEVICE GROUP—Select one or more than one device group for this query.
241

Table 18: Examples of InuxDB and TSDB Syntax Parameters
(Connued)
InuxDB Querying Opons TSDB Querying Opons
GROUP BY—Specify how to group data
based on KPI keys.
MEASUREMENT—Select the Paragon Insights topic or rule name.
FORMAT AS—Specify if you want to
format as table, me series, or log.
WHERE—Filter data based on tags and elds.
FIELDS—Select the elds to which you want to apply the aggregaon.
GROUP BY—Specify how to group data based KPI keys.
FORMAT AS—Specify if you want to format as table, me series, or log.
PER DEVICE LIMIT—Set the per-device limit of the base query for each
device (database) that you have selected.
AGGREGATED LIMIT—Set the aggregate limit for the device (databases) aer
the base query is run.
ALIAS BY—Rename a eld. For example, if you select mean as an
aggregaon funcon for a eld named bps, you can give it an alias name
called mean_bps.
View Prepopulated Graphs
Starng with Paragon Insights Release 4.3.0, you can view prepopulated graphs from the Grafana
dashboard.
You can view prepopulated graphs from the Dashboards secon of the Grafana Home page. You can
also view these prepopulated graphs by clicking Dashboard > Manage > Paragon Insights Cluster Health.
With Paragon Insights Release 4.3.0, the following graphs are available by default:
• CPU Usage—View cluster-wise or node-wise informaon on CPU (%) usage at dierent levels.
242

• Disk Read Usage (r_await)—View cluster-wise or node-wise informaon on average me taken for
disk reads to be served.
• Disk Write Usage (w_await)—View cluster-wise or node-wise informaon on average me taken for
disk writes to be served.
• Node Memory Available—View informaon on free memory available on a node in a selected cluster.
Click the name of a graph to view more informaon of that graph. You can view a prepopulated graph of
all nodes in a cluster at a me, and also view prepopulated graphs of one or more nodes in a cluster.
Back Up and Restore Grafana Data
Back Up Grafana Data
1. Click Administraon > Backup.
The Backup page appears.
2. Click Backup Grafana to backup Grafana data. The Conrm Backup pop-up appears.
3. Click Ok to conrm.
Restore Grafana Data
1. Click Administraon > Restore. The Restore page appears.
2. Click Choose le and select the backed-up Grafana data le from your local system; click Ok to
conrm selecon.
3. Click Restore Grafana to restore Grafana data.
4. Click Ok to conrm.
Change History Table
Feature support is determined by the plaorm and release you are using. Use Feature Explorer to
determine if a feature is supported on your plaorm.
Release
Descripon
4.3.0 Starng with Paragon Insights Release 4.3.0, you can view prepopulated graphs from the Grafana
dashboard.
4.1.0 Starng with Paragon Insights (formerly HealthBot) Release 4.1.0, you can use the Grafana user
interface (UI) to view data of your network devices.
243

RELATED DOCUMENTATION
Monitor Device and Network Health | 172
Understanding Acon Engine Workows
NOTE: Acon engine workow is a Beta feature.
When creang rules, Paragon Insights includes the ability to run user-dened acons (UDAs) as part of a
trigger. UDAs are Python scripts that can be congured to be triggered by a Paragon Insights rule.
You cannot track and manage UDAs, pause an acon, retry a failed acon, and resume a paused acon.
However, with Release 4.1.0, Paragon Insights supports acon engine workow monitoring. An acon
engine workow is an acon engine that you can use to congure a set of tasks (instances). You can
congure acon engine workows, monitor exisng acon engine workows, and manage acon engine
workow instances from the Paragon Insights GUI.
You can view acon engine workows that you created by using the CLI in the Paragon Insights GUI.
You can perform the following acons from the CLI:
• run NETCONF command
• run arbitrary executable les such as Python, Bash, Ruby
• run a command to send nocaon messages
RELATED DOCUMENTATION
Manage Acon Engine Workows | 244
Manage Acon Engine Workows
NOTE: Acon engine workow is a Beta feature.
244

See "Understanding Acon Engine Workows" on page 244 for more informaon on acon engine
workows.
You can add new workows from the Conguraon > Acon Engine page of the Paragon Insights GUI.
You can manage exising acon engine workows, and acon engine workow instances from the
Monitor > Acon Engine page.
Add an Acon Engine Workow
Follow these steps to add an acon engine workow:
1. Click Conguraon > Acon Engine.
The Workows page apprears.
2. Click plus (+) icon to add an acon engine workow.
The Add New Workow page appears. The General tabbed page is displayed by default.
3. Enter the following informaon in the General tabbed page :
a. Enter a name for the acon engine workow in the Name text box.
b. Enter a descripon for the acon engine workow in the Descripon text box.
c. Select an entry task from the Entry Task drop-down list.
NOTE: You have to add a task before you can select the task from the Entry Task drop-
down list. To add a task, see Step 4.
An entry task is the rst task that is executed when you run an acon engine workow.
d. Select an exit task from the Exit Task drop-down list.
NOTE: You have to add a task before you can select the task from the Exit Task drop-down
list. To add a task, see Step 4.
An exit task is the last task (for example, a clean up task) that is executed at the end of an acon
engine workow sequence.
4. Click Tasks to view the Task tabbed page.
5. Click (+) to add a task.
Enter the following informaon:
a. Enter a name for the task in the Name text box.
b. Enable or Disable the Parallel toggle buon.
245
Enable the Parallel toggle buon to run all steps in a task simultaneously.
c. Follow these steps for Paragon Insights Release 4.1.0:
i. Click (+) to add a new step.
The Add Step overlay page appears.
ii. Enter a name for the step in the Name text box.
iii. Enter a value for Command Tag and Command Field in the CLI Command Sengs secon.
iv. Click Ok to conrm
Follow these steps for Paragon Insights Release 4.2.0:
i. Click the (+) icon to add a step.
A row is added to the Steps secon.
In the row that is added,
1. Enter a name for the step in the Name text box.
2. Enter a descripon for the step in the Descripon text box.
3. Select dependencies from the Dependencies drop-down list.
4. Select a step type from the Type drop-down list.
ii. Click Edit Commands to add a new command.
The ADD/EDIT COMMANDS pop-up appears.
Enter the following informaon:
1. Click +Add New Command to add a new command.
The New Command secon appears in the ADD/EDIT COMMANDS pop-up.
2. Enter a value for the command tag in the Command Tag text box.
3. Enter a value in the Commands list box. You can select more than one command.
Click X to remove the command that you selected.
4. Enter a value in the Arguments list box. You can select more than one argument.
Click X to remove the argument that you selected.
5. Enter a value in the Device list box. You can select more than one device.
246
Click X to remove the device that you selected.
6. Enter a value in the Device Group list box. You can select more than one device group.
Click X to remove the device group that you selected.
7. Enter a value in the Environment list box.
8. Select an output from the Output Type list box.
9. Enable or Disable the Ignore toggle buon.
Enable the Ignore toggle buon to ignore steps.
10. Set repeat parameters in the Repeat eld.
You can determine if you want to repeat a failed step or not.
11. The default delay value displayed is 10 seconds.
Aer you have set repeat parameters to repeat a step that has failed, there is a delay
of 10 seconds before the step is repeated again.
12. Click OK to conrm.
The new command is added.
iii. Click Edit Condions to add new condions.
The ADD/EDIT CONDITIONS pop-up appears.
Follow this procedure to set condions to run a step:
1. Enter the condions in the Condions text box.
2. Select a condion type from the Condions Type list box.
3. Enter a descripon for the condion in the Condion Descripon text box.
4. Click OK to conrm.
The new condions are added
iv. Click Edit Inputs to add new inputs.
The ADD/EDIT INPUTS pop-up appears.
Enter the following informaon:
1. Click the (+) icon to add new input.
2. Enter a name for the input in the Name eld.
247

3. Enter a value for the input in the Value eld.
4. Click OK to conrm.
The operaon is successful message is displayed in the ADD/EDIT INPUTS pop-up.
5. Click Close to close the ADD/EDIT INPUTS pop-up.
v. Click Edit Output to add new outputs.
The ADD/EDIT OUTPUT pop-up appears.
Enter the following informaon:
1. Click the (+) icon to add new input.
2. Select a name for the output from the Name drop-down list.
3. Enter a descripon for the output in the Descripon text box.
4. Enter a value for the command tag in the Command Tag eld.
5. Select output type from the Output Type drop-down list. See Table 19 on page 248.
6. The eld displayed depends on the output type that you have selected. See Table 19 on
page 248.
Table 19: Output Type and Corresponding Fields
Output Type Field
Grok Paern
XML XPath
JSON JQ path
Arfact Path
Regex Paern
Result
248
7. Click OK to conrm.
The operaon is successful message is displayed in the ADD/EDIT OUTPUT pop-up.
8. Click Close to close the ADD/EDIT OUTPUT pop-up.
d. Click the √ icon to add this row to the Steps secon.
6. Click the Arguments tab.
7. On the Arguments tabbed page, click the plus (+) icon to add a new argument.
Enter the following informaon:
• Enter a name for the argument in the Name text box.
• Click Ok to conrm.
8. Do any one of the following:
• Click Save to save the acon engine workow.
• Click Save & Deploy to save and deploy the acon engine workow.
You have now added and deployed an acon engine workow. To monitor the acon engine
workows that you have added, see Monitor > Acon Engine.
Run an Acon Engine Workow
Aer you add an acon engine workow from the Conguraon > Acon Engine page of the UI, you
can run the acon engine workow by following these steps:
1. Click Monitor > Acon Engine.
The Workows Monitor page apprears.
2. Select the acon engine workow you want to run by selecng the check box next to the name of
the acon engine workow.
3. Click Run Workow.
The Run Workow <
workow name
> pop-up appears.
4. In the Run Workow <
workow name
> pop-up that appears, you can:
• View the list of precongured arguments for the acon engine workow.
• Congure addional arguments.
To congure addional arguments:
a. Click (+).
The Addional Arguments elds that you can congure are displayed.
249

i. Enter a name in the Name text box to idenfy this addional argument.
The name you enter must be in the [a-zA-Z][a-zA-Z0-9_-]*$ regular expression format.
This format states that the rst character of the name can start with a-z or A-Z. The
name cannot start with a number or a special character. However, you can use numbers,
_, and - within the name. Maximum length is 64 characters.
ii. Select an addional argument type from the Type drop-down list.
Available opons: string, list, password, device, device-group, network-group
iii. Select a value from the opons available.
The opons you can choose from depend on the addional argument Type that you
have selected. You can add one or more than one arguments.
5. Click OK to conrm sengs and run the acon engine workow.
Stop an Acon Engine Workow Instance
You can stop an acon engine workow instance that is currently running.
NOTE: You cannot resume (restart) an instance that you have stopped.
To stop an instance:
1. Click Monitor > Acon Engine.
The Workows Monitor page appears.
2. Click a acon engine workow to view the instances listed under it.
3. Select the instance that is currently running by selecng the check box next to the name of the
instance.
4. Click Stop to stop the instance.
Resume a Suspended Acon Engine Workow Instance
You can resume (restart) an acon Engine workow instance that has been suspended. To resume a
suspended instance:
1. Click Monitor > Acon Engine.
The Workows Monitor page appears.
2. Click an acon engine workow to view the instances listed under it.
250

3. Select a suspended instance by selecng the check box next to the name of the instance.
4. Click Resume to restart the instance.
Filter Acon Engine Workow Instances
To lter acon engine workow instances within an acon engine workow:
1. Click Monitor > Acon Engine.
The Workows Monitor page appears.
2. Click Filter, and then click Add Filter from the Filter drop-down list.
The Add Criteria pop-up appears.
3. Enter the following informaon in the Add Criteria pop-up.
a. Select the eld that you want to apply the lter to, from the Field drop-down list .
b. Select the condions that you want to apply to the eld, from the Condion drop-down list .
c. Enter start and/or nish me that you want to apply to the lter, in the Value text box.
4. Click Add to apply the lter.
Delete an Acon Engine Workow
To delete an acon engine workow:
1. Click Conguraon > Acon Engine.
The Workows page appears.
2. Select the acon engine workow you want to delete by selecng the check box next to the name of
the instance.
3. Click the Delete icon.
The Delete Workow pop-up appears.
4. In the Delete Workow pop-up that appears, click Ok to delete the acon engine workow.
RELATED DOCUMENTATION
Understanding Acon Engine Workows | 244
251

Alerts and Nocaons
IN THIS SECTION
Generate Alert Nocaons | 252
Manage Alerts Using Alert Manager | 260
Stream Sensor and Field Data from Paragon Insights | 264
Generate Alert
Nocaons
IN THIS SECTION
Congure a Nocaon Prole | 253
Enable Alert Nocaons for a Device Group or Network Group | 259
Paragon Insights (formerly HealthBot) generates alerts that indicate when specic KPI events occur on
your devices. To receive Paragon Insights nocaons for these KPI events, you must rst congure a
nocaon prole. Once congured, you can enable alert nocaons for specic device groups and
network groups.
Paragon Insights supports the following nocaon delivery methods:
• Web Hook
• Slack
• Kaa Publish
• Microso Teams (HealthBot Release 2.1.0 and later)
• Email (HealthBot Release 2.1.0 and later)
• Advanced Message Queuing Protocol (AMQP) Publish (Paragon Insights Release 4.0.0 and later)
This secon includes the following procedures:
252

Congure a Nocaon Prole
A nocaon prole denes the delivery method to use for sending nocaons.
1. Click the Sengs > System opon in the le-nav bar.
2. Click the Nocaon tab on the le of the window. click the add nocaon buon (+ Nocaon).
3. Click the + Nocaon buon
4. In the Add Nocaon window that appears, congure the nocaon prole:
Aributes Descripon
Name Enter a name.
Descripon (Oponal) Enter a descripon.
Nocaon Type Select a nocaon type:
• Web Hook
• Slack
• Kaa Publish
• Microso Teams (HealthBot 2.1.0 and later)
•
EMails (HealthBot 2.1.0 and later)
•
Advanced Message Queuing Protocol (AMQP) Publish (Paragon Insights Release 4.0.0
and later)
Nocaon type aributes vary based on nocaon type selected. See below for
details.
5. Click Save and Deploy.
NOTIFICATION TYPE DETAILS
Web Hook
•
URL
URL at which the Web Hook nocaon should be posted.
•
Username
(Oponal) Username for basic HTTP authencaon.
253

•
Password (Oponal) Password for basic HTTP authencaon.
Slack
•
URL URL at which the Slack nocaon should be posted. Dierent from your Slack workspace
URL. Go to hps://slack.com/services/new/incoming-webhook and sign in to your Slack
workspace to create a Slack API endpoint URL.
•
Channel Channel on which the nocaon should be posted.
Kaa Publish
•
Bootstrap Servers Add Kaa host:port pairs from the drop-down list to establish the inial
connecon to the Kaa cluster.
•
Topic (Oponal) Name of the Kaa topic to which data will be published. By default, the Kaa
topic naming convenon for device group alert nocaons is
device-group
.
device-
id
.
topic
.
rule
.
trigger
.
Depending on the authencaon protocols being used, the required authencaon parameters are as
follows:
Protocol Required Parameters
SASL/SSL Username, password and cercate
SASL/Plaintext Username and password
SSL Cercate
Plaintext None
•
Username
Username for SASL/SSL or SASL/plaintext authencaon.
•
Password
Password for SASL/SSL or SASL/plaintext authencaon.
254
•
Cercate Kaa server’s CA cercate. Choose le from the drop-down list.
•
Upload
Cercate
Locaon from where the Kaa server’s CA cercate will be uploaded. Click
Choose les and navigate to the le locaon. File should be in Privacy Enhanced
Mail (PEM) format.
Microso Teams
As of HealthBot Release 2.1.0, you can send Paragon Insights (formerly HealthBot) nocaons to
Microso Teams. Teams can provide a connector which you can add to Paragon Insights to enable the
connecon.
Conguraon workow:
• In Teams, create a new connector set as an incoming webhook.
• Copy the URL provided by Teams.
• In Paragon Insights, congure a nocaon prole that sends to Microso Teams.
• Apply the nocaon prole to a device group.
To congure MS Teams nocaons:
1. In Teams, select the desired channel and click the ellipsis (...).
2. In the menu that appears, click Connectors.
255

3. Use the Incoming Webhook opon and click Congure.
4. On the next page, click Create.
256

5. Once the web hook is successfully created, copy the provided URL.
6. In Paragon Insights, go to the Sengs > System page select the Nocaon tab.
7. Click the + Nocaon buon.
8. Congure the nocaon prole as follows:
• Name - Enter a prole name.
• Nocaon Type - select Microso Teams.
• Channel - Paste the URL provided by the Teams UI above.
9. Click Save and Deploy.
10. Apply the nocaon prole to a device group or network group as shown in "Enable Alert
Nocaons for a Device Group or Network Group" on page 259
EMails
As of HealthBot Release 2.1.0, you can send Paragon Insights (formerly HealthBot) nocaons by
email. By default, email nocaons cover all running playbooks and rules for the device group or
network group to which they are applied, however you can narrow the focus by selecng specic rules.
NOTE: Paragon Insights includes its own mail transfer agent (MTA), so no other mail server is
required.
Conguraon workow:
• In Paragon Insights, congure a nocaon prole that sends to email.
• Apply the nocaon prole to a device group.
To congure email nocaons:
1. In Paragon Insights, go to the Sengs > System page.
2. Select the Nocaon tab and click the the + Nocaon buon.
257

3. Congure the nocaon prole as follows:
• Name - Enter a prole name.
• Nocaon Type - Select Emails.
• Email Addresses - Enter an email address and click Add
<email-address>
; repeat for more email
addresses.
• (Oponal) Rule lters - To narrow the scope of what triggers an email, dene rule lters. Enter a
lter and click Add
<rule-lters>
; repeat for more lters.
• Format is topic/rule; can use regular expressions
• Example: interface.stascs/check-interface-aps sends nocaons only for the rule check-
interface-aps.
• Example: system.processes/.* , system.cpu/.* , and interface.stascs/.* sends nocaons for
all rules under the topics system.processes, system.cpu, and interface.stascs.
4. Click Save and Deploy.
5. Apply the nocaon prole to a device group or network group as shown in "Enable Alert
Nocaons for a Device Group or Network Group" on page 259
AMQP Publish
If you select AMQP Publish as the nocaon type, you have to specify the following:
• Host (mandatory)—Specify a valid hostname or the IP address of the AMQP server.
• Port (mandatory)—Specify the listener port of the AMQP server.
• Exchange(mandatory)—Specify the name of the exchange or the roung agent of the AMQP server
on which the connecon must be instanated.
• Virtual Host(oponal)—Specify the virtual host of the AMQP server on which the connecon must be
instanated. If you do not specify, the default value(/) is used.
• Roung Key(oponal)—Specify the roung key. The roung key is a message aribute that the
exchange refers to when deciding how to route the message to the queue.
NOTE: If you have not congured the roung key, the following are the default value:
• For sensor or raw data,
<device-group>.<device>.sensors
258

• For eld data,
<device/network-group>.<device>.<topic>.<rule>.elds
• For trigger/alert data,
<device/network-group>.<device>.<topic>.<rule>.<trigger>
In case of a network group,
<device>
is rendered as “-”.
• Username—Specify the username for the Simple Authencaon Security Layer (SASL)
authencaon.
• Password—Specify the password for the SASL authencaon.
• CA Prole—Select the CA prole from the drop-down list. For more informaon on CA Proles and
local cercates, see "Congure a Secure Data Connecon for Paragon Insights Devices" on page
286.
• Local Cercate—Select the local cercate from the drop-down list. For more informaon on CA
Proles and local cercates, see "Congure a Secure Data Connecon for Paragon Insights Devices"
on page 286
• Server Common Name—Specify the server common name that is used while creang a cercate.
Enable Alert Nocaons for a Device Group or Network Group
To enable alert nocaons for a device group or network group:
1. For Device Groups, select the Conguraon > Device Group page from the le-nav bar.
For Network Groups, select the Conguraon > Network page from the le-nav bar.
2. Click the name of the device group or network group for which you want to enable alert
nocaons.
3. Click the Edit (Pencil) icon.
4. Scroll down to the Nocaon secon in the pop-up window and click the caret to expand that
secon.
5. Select a desnaon for any alert level (Major, Minor, or Normal) that you want. Nocaon can be
sent to zero or more dened desnaons for each alert level.
6. Click Save and Deploy.
259

Manage Alerts Using Alert Manager
IN THIS SECTION
Viewing Alerts | 260
Manage Individual Alerts | 262
Congure Alert Blackouts | 263
You can use the Alert Manager feature to organize, track, and manage KPI event alert nocaons
received from Paragon Insights devices. The Alert Manager does not track alerts by default; it is
populated based on which device groups or network groups are congured to send the nocaons.
Viewing Alerts
To view the alerts report table, go to the Monitor > Alerts page in the le-nav bar. Note that Alert
Manager consolidates duplicate alerts into one table entry and provides a count of the number of
duplicate alerts it has received.
Starng with release 4.2.0, Paragon Insights generates smart alerts if you congured resources and
dependencies. To congure resources, click Resource Discovery at the top right corner of the Alerts
page.
Smart alerts combine alerts from dierent rules into a collapsible tree structure. The main alert in the
tree displays the root cause that triggered the other alerts in the tree. See "Understand Resources and
Dependencies" on page 206 for more informaon.
The following table describes the alerts report table aributes.
Aributes Descripon
Severity Severity level of the alert. Opons include:
• Major
• Minor
• Normal
260

(Connued)
Aributes Descripon
Status Management status of the alert entry. Opons are Open, Acve, Shelved, Closed, and Ack. The
statuses available in the Status pull-down menu in the top row of the table only include statuses
of alerts visible in the table and those allowed by the status lter above the table.
Last Received Time the alert was last received.
Dupl. Duplicate count. Number of mes an alert with the same event, resource, environment, and
severity has been triggered.
Topic Device component topic name.
Resource Device name.
Event Name of the rule, trigger or eld, and event with which the alert is associated.
Text Health status message.
The following table describes the main features of the alerts report table:
Feature Descripon
Sort the data by ascending or
descending order based on a
specic aribute.
Click on the name of the data type at the top of the column by which you
want to sort.
Filter the data based on the
device group.
In the drop-down list at the top le corner of the page, select a device group
by which to lter.
261

(Connued)
Feature Descripon
Filter the data based on the
alert status.
Two opons:
1. In the drop-down list above the table at the top of the page, select one or
more status types on which to lter. Opons are open, acve, shelved,
closed, and ack. You can lter on mulple status types.
2. In the drop-down list at the top of the Status column, select a status type
by which to lter. Note that if there are status types shown in the lter list
at the top of the report, then the status column can only show those status
types.
Filter the data based on the
severity, topic, or resource
In the associated drop-down list for each aribute at the top of the table,
select an opon by which to lter.
Filter the data based on a
keyword.
In the associated text box under the Event or Text aribute name at the top
of the table, enter the keyword on which to lter.
Filter the data based on date or
me received.
In the Last Received eld, enter a date and me in the format: <Day> <DD>
<Mon> <HH:MM>
Navigate to a dierent page of
the table.
Two opons:
1. At the boom of the table, click the Previous or Next buons.
2. At the boom of the table, select the page number using the up/down
arrows (or by manually entering the number) and then press Enter.
Change the number of rows
displayed.
At the boom of the table, choose the number of rows to display in the drop-
down list. The table displays 20 rows by default.
If the data in a cell is truncated,
view all of the data in a cell.
Resize the column width of the cell by dragging the right side of the tle cell
of the column to the right.
Manage Individual Alerts
You can view detailed informaon about each alert in the alerts report table. You can also assign a
management status (such as open, ack, and close), and apply simple acons (such as shelve and delete)
to each alert.
262

To manage individual alerts:
1. Go to the Monitor > Alerts page from the le-nav bar to open the alert report table.
2. Click on a single alert entry in the table. The Alert Details pane displays detailed informaon about
the alert.
The following table describes the set of buons at the top of the Alert Details pane:
Buon Descripon
Open Changes the status of the alert to Open.
Shelve Removes the alert from the table for a set amount of me. Time opons are 1, 2, 4 and 8 hours. Click
Unshelve to disable this feature.
Ack Changes the status of the alert to Ack. The Ack status removes the alert from the table, but the alert
sll remains acve.
Close Changes the status of the alert to Closed. The Closed status indicates that the severity level of the alert
is now Normal.
Delete Deletes the alert from the table.
Congure Alert Blackouts
You can congure blackout periods to suppress or mute alerts during, for example, scheduled
downmes.
To congure blackouts:
1. Click the Sengs > System page from the le-nav bar.
2. Select the Alert tab on the le side of the page.
3. In Alert Blackout Sengs, click the + Alert Blackout buon.
4. Enter the necessary values in the text boxes for the blackout conguraon.
The following table describes the aributes in the Add an Alert Blackout pane:
263

Aributes Descripon
Duraon Select a start and end date and me for the blackout.
Device Group Select a device group from the drop-down list to which to apply the blackout conguraon.
Aribute (Oponal) Specify an aribute from the drop-down list to which to apply the blackout
conguraon.
Value (Oponal) If a blackout aribute is specied, provide an associated value (as shown in the
alerts report table). Only the alerts that match this aribute value exactly will be suppressed
from the alerts report table.
NOTE: For the Resource-Event aribute, you must specify a resource from the drop-down
list, as well as specify an Event value. Only the alerts generated by the specied resource that
match this Event value exactly will be suppressed from the alerts report table.
5. Click Save to save the conguraon.
6. (Oponal) Click the Delete buon to delete a blackout conguraon.
Stream Sensor and Field Data from Paragon Insights
IN THIS SECTION
Congure the Nocaon Type for Publishing | 264
Publish Data for a Device Group or Network Group | 267
You can congure Paragon Insights to publish Paragon Insights sensor and eld data for a specic device
group or network group. You must rst congure the nocaon type for publishing and then specify
the elds and sensors that you want published.
Congure the Nocaon Type for Publishing
Paragon Insights supports Apache Kaa and AMQP for publishing sensor and eld data.
264

You must rst congure a Kaa publishing prole before you can start publishing sensor and eld data
for a specic device group or network group.
To congure a Kaa publishing prole:
1. Select the Sengs > System page from the le-nav bar.
2. Click the Nocaon tab on the le part of the page.
3. In Nocaon Sengs, click the + Nocaon buon.
4. Enter the necessary values in the text boxes and select the appropriate opons for the Kaa
publishing prole.
The following table describes the relevant aributes in the Add a Nocaon Seng and Edit
Nocaon Conguraon panes:
Aributes Descripon
Name Name of the nocaon.
Descripon (Oponal) Descripon of the nocaon.
Nocaon
Type
Click the Kaa publish radio buon.
265

(Connued)
Aributes Descripon
Kaa Publish
•
Bootstrap
Servers
Add Kaa host:port pairs from the drop-down list to establish the
inial connecon to the Kaa cluster.
•
Topic (Oponal) Name of the Kaa topic to which data will be published. By default,
the Kaa topic naming convenons are:
• For device group eld data,
device-group
.
device-id
.
topic
.
rule
.elds
• For network group eld data,
network-group
.
topic
.
rule
.elds
• o For device group sensor data,
device-group
.
device-id
.sensors
Depending on the authencaon protocols being used, the required authencaon
parameters are as follows:
•
SASL/SSL—Username, password and cercate
•
SASL/Plaintext—Username and password
• SSL—Cercate
• Plaintext—None
Required authencaon parameters are:
•
Username Username for SASL/SSL or SASL/plaintext authencaon.
•
Password Password for SASL/SSL or SASL/plaintext authencaon.
•
Cercate Kaa server’s CA cercate. Choose le from the drop-down list.
•
Upload
Cercate
Locaon from where the Kaa server’s CA cercate will be
uploaded. Click Choose les and navigate to the le locaon. File
should be in Privacy Enhanced Mail (PEM) format.
5. Click Save to save the conguraon or click Save and Deploy to save and deploy the conguraon.
6. Apply the Kaa publishing prole to a device group or network group. For more details, see the
"Publish Data for a Device Group or Network Group" on page 267 secon.
266

Publish Data for a Device Group or Network Group
To publish Paragon Insights sensor or eld data for a device group or network group:
1. For Device Groups, select the Conguraon > Device Group page from the le-nav bar.
For Network Groups, select the Conguraon > Network page from the le-nav bar.
2. Click the name of the device group or the network group to which you want to publish data.
3. Click the Edit (Pencil) icon.
4. Under Publish, select the appropriate Desnaons, Field, or Sensor from the drop-down lists for the
data you want to publish. To publish eld or sensor data, you must congure a desnaon.
Parameter Descripon
Desnaons Select the publishing proles that dene the nocaon type requirements (such as
authencaon parameters) for publishing the data.
To edit or view details about saved publishing proles, go to the System page under the
Sengs menu opon in the le-nav bar. The publishing proles are listed under Nocaon
Sengs.
NOTE: Only Kaa and AMQP publishing are currently supported.
Field Select the Paragon Insights rule topic and rule name pairs that contain the eld data you want
to publish.
Sensor (Device group only) Select the sensor paths or YAML tables that contain the sensor data you
want to publish. No sensor data is published by default.
5. Click Save to save the conguraon or click Save and Deploy to save and deploy the conguraon.
Change History Table
Feature support is determined by the plaorm and release you are using. Use Feature Explorer to
determine if a feature is supported on your plaorm.
Release
Descripon
2.1.0 As of HealthBot Release 2.1.0, you can send Paragon Insights (formerly HealthBot) nocaons by
email.
RELATED DOCUMENTATION
Monitor Device and Network Health | 172
267

Generate Reports
IN THIS SECTION
Generate On-Demand Reports | 269
Generate Scheduled Reports | 270
Create a Schedule Prole | 271
Create a Report | 272
Associate the Report to a Device Group or Network Group | 273
View Reports | 273
Create a Field Snapshot | 276
Compare (Di) Reports | 278
You can generate Paragon Insights (formerly HealthBot) reports for device groups and network groups.
These reports include alarm stascs, device or network health data, as well as device-specic
informaon (such as hardware and soware specicaons).
Paragon Insights’s reporng funconality allows you to:
• Send reports by email, save them on the Paragon Insights server, or download them to your local
machine
• Schedule reports to run at regular intervals, or for a specic me
• Generate reports on demand (HealthBot Release 2.1.0 and later)
• Compare (di) two reports (HealthBot Release 2.1.0 and later)
• Capture a snapshot of a specic set of elds at a given point in me (HealthBot Release 3.1.0 and
later)
This secon includes the following procedures:
• "Generate On-Demand Reports" on page 269
• "Generate Scheduled Reports" on page 270
• "View Reports" on page 273
• "Create a Field Snapshot" on page 276
268
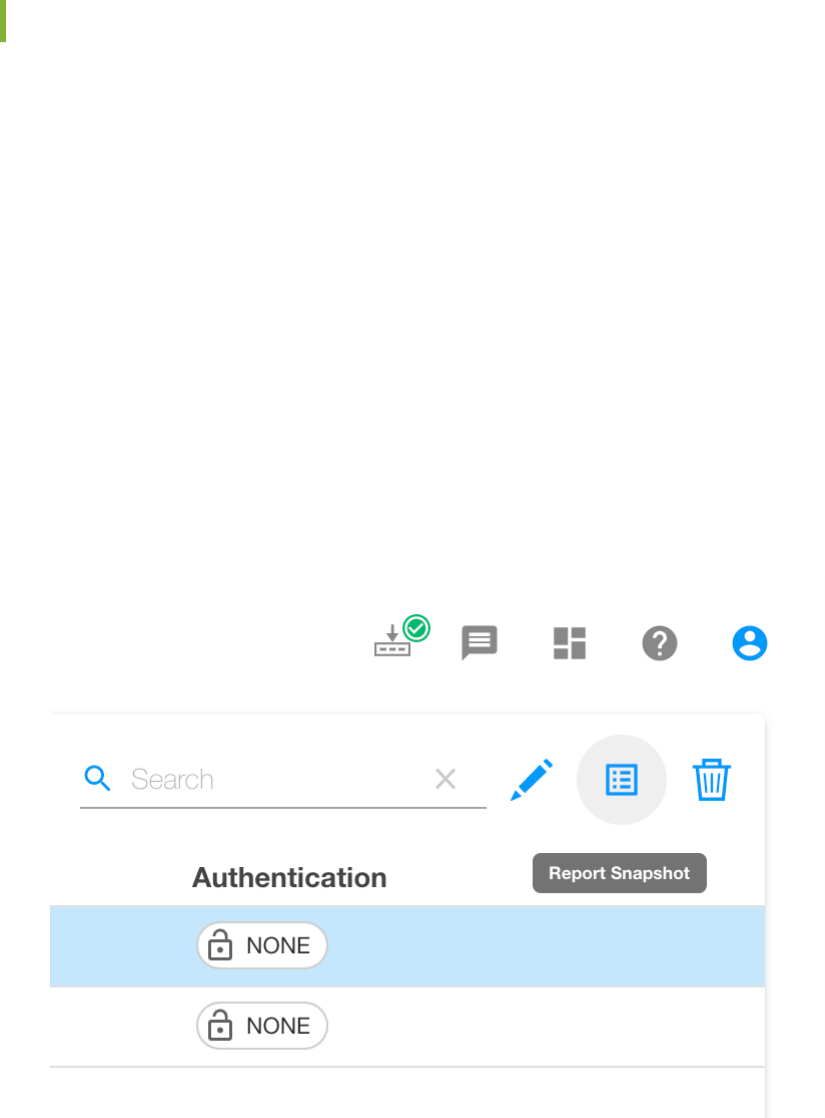
• "Compare (Di) Reports" on page 278
Generate On-Demand Reports
You can generate and download a report on demand for a device group or network group. As with
regular report generaon, formats supported include HTML or JSON, and you can download the report
or receive it by email.
Once generated, you can re-download on-demand reports from the Reports page. These reports have
the report name HB_MANUAL_REPORT.
1. For a device group, navigate to the Conguraon > Device Group page from the le-nav bar and
select the device group name from the list.
For a network group, navigate to the Conguraon > Network page from the le-nav bar and select
the network group name from the list.
2. Click the Report Snapshot (Page) icon in the upper right part of the page as shown in
Figure 59: Report Snapshot Buon
3. On the page that appears, enter report generaon details, including:
269

• Format - HTML or JSON
• Desnaon Type - save to your computer (disk) or send to email (which also saves to disk)
• If disk, specify the number of reports to save on the server before deleng older reports
• If email, add target email address(es)
• (Oponal) Select graph canvases to include in the report.
• (Oponal) Select the desired graph panels to include in the report.
4. Click Submit.
5. A dialog box appears allowing you to download the le. Addionally, if the desnaon is disk,
Paragon Insights stores a copy of the report on the server. If the desnaon is email, Paragon Insights
sends the report to the specied account.
Generate Scheduled Reports
The workow to congure and generate scheduled reports is as follows:
Create a Desnaon Prole
1. Select the Sengs > System page from the le-nav bar.
2. Click the Desnaon tab on the le of the page.
3. In the Desnaon Sengs secon, click the + Desnaonbuon.
4. Specify the desnaon prole sengs as appropriate.
The following table describes the aributes in the Add a desnaon and Edit a desnaon panes:
Aributes Descripon
Desnaon Name Enter a name. The name cannot be changed once saved.
270

(Connued)
Aributes Descripon
Desnaon Type Opons include Email or Disk.
Email > Email Id Enter an email address to which the report will be sent.
Disk > Maximum Reports Specify how many versions of this report will be stored on the server. Older
reports are deleted as newer reports are generated and saved.
NOTE: Using the email opon also saves a copy of the report to disk.
5. Click Save and Deploy.
Create a Schedule Prole
1. Click the Scheduler tab on the le side of the page.
2. In the Scheduler Sengs secon, click the + Scheduler buon.
3. Specify the schedule prole sengs as appropriate.
The following table describes the aributes in the Add a scheduler and Edit a scheduler panes:
Aributes Descripon
Name Enter a name .
Scheduler Type Select connuous.
Start On Select the date and me for the rst report to be generated.
Run for Not applicable.
271

(Connued)
Aributes Descripon
End On (Oponal) Select the date and me to stop generang reports.
Leave blank to generate the report indenitely.
Repeat Select one of the following:
• The frequency (every day, week, month, or year) at which you want the report to be
generated.
• Never—generate the report only once.
• Custom—select and use the Repeat Every elds to congure a custom frequency.
4. Click Save and Deploy.
Create a Report
1. Click the Report tab on the le side of the page.
2. In the Report Sengs secon, click + Reportbuon.
3. Specify the schedule prole sengs as appropriate.
The following table describes the aributes in the Add a report seng and Edit a report seng
panes:
Aributes Descripon
Name Enter a name.
Format Opons include HTML and JSON.
Schedule(s) Select the schedule prole you created above.
272

(Connued)
Aributes Descripon
Desnaon(s) Select the desnaon prole you created above.
Canvas(es) (Oponal) Select graph canvases to include in the report. The list of graph panels in the
Panel(s) drop-down list changes based on the canvas selected.
For informaon on creang graphs, see Graph Page.
Panel(s) (Oponal) Select the desired graph panels to include in the report.
NOTE: JSON reports include the raw me series data only, no graphs.
4.
Click Save and Deploy.
Associate the Report to a Device Group or Network Group
1. For a device group, select the Conguraon > Device Groups page from the le-nav bar.
For a network group, select the Conguraon > Network page from the le-nav bar.
2. Click the name of the device group or network group for which you want to generate reports.
3. Click the Edit (Pencil) buon.
4. In the Reports secon, click the caret to expand the menu.
5. Click the name(s) of the reports that you want to associate with this group.
6. Click Save and Deploy.
View Reports
To view reports for a device group or network group:
1. If the report’s nocaon parameters are set to use email, check the email box of the specied
account for the report and open the aachment.
273
2. If the report’s nocaon parameters are set to save to the server’s disk (or even if set to email),
select the Monitor > Reports page from the le-nav bar. The reports are organized by the date and
me at which they were generated. The most recent report is listed at the top of the table.
3. Find the report you wish to download. To help nd the desired report:
• Click the column headings to sort based on that column.
• Search within a column using the text box under the column heading.
• Use the boom of the page to view more rows or change pages.
4. Click on the name of the report to download it to your system.
The following is a sample report:
274

275

Create a Field Snapshot
You can capture elds (and their values) from rules applied to deployed devices. In the Paragon Insights
CLI, you idenfy the elds to capture by specifying an
xpath
as shown below (without spaces):
{
capture-fields: [
/device-group[device-group-name=’DevGrp1’]/device[device-id=/mx240-1/]/topic[topic-
name=’system.cpu’]/rule[rule-name=’check-system-cpu’]/re-cpu-utilization,
/device-group[device-group-name=’DevGrp2’]/device[device-id=/mx240-1/]/topic[topic-
name=’interface.statistics’]/rule[rule-name=’check-in-errors’]/in-errors-count
]
}
In the Paragon Insights GUI, you specify the elds during the creaon of a report. Paragon Insights takes
care of creang the xpath from your conguraon in the Sengs > System > Reports > Add a Report
Seng or the Sengs > System > Reports > Edit Report window as shown in Figure 60 on page 277
below:
276

Figure 60: Add/Edit Report Seng
277

Compare (Di) Reports
You can compare the dierences between two reports for a device group or network group. The di
allows you to view added/removed/modied alerts, devices, health informaon, and graphs.
1. On the Reports page, select two reports and click the Di Reports buon.
2. The di opens as an HTML page in a new tab.
Sample Report Di
A sample of a report di for a device group is shown below.
278

279
A sample of a report di for a network group is shown below.
280

281

Change History Table
Feature support is determined by the plaorm and release you are using. Use Feature Explorer to
determine if a feature is supported on your plaorm.
Release Descripon
3.1.0 Capture a snapshot of a specic set of elds at a given point in me (HealthBot Release 3.1.0 and later)
2.1.0 Generate reports on demand (HealthBot Release 2.1.0 and later)
2.1.0 Compare (di) two reports (HealthBot Release 2.1.0 and later)
Use Exim4 for E-Mails
Exim4 is a mail transfer agent (MTA) for Unix-like systems that connect to the internet. The Exim4 agent,
that is included in the Paragon Insights soware, sends network health reports and alert nocaons
(for network or device issues) to the e-mail account of the Exim4 host user. The Exim4 host is the
Paragon Insights primary node.
NOTE: In case of mulnode Paragon Insights installaon with more than one primary node, the
Exim4 host is one of the primary nodes.
To enable Paragon Insights to use Exim4 MTA, you must do the following:
• Congure the Exim4 hostname (the primary node hostname) in the le that has the environment
variables of all microservices. This conguraon ensures that Paragon Insights can reach the Exim4
host when an alert or a report is generated. If the Exim4 host is not reachable, Paragon Insights does
not forward the e-mail to the Exim4 agent.
• Congure your DNS server to resolve the Exim4 host's FQDN to the Paragon Insights virtual IP (VIP)
address. The format of the FQDN is hostname.domain.top-level-domain. This conguraon ensures
that the Exim4 agent discovers the DNS mail server for the domain based on the Exim4 host's
FQDN. The Exim4 agent then forwards the e-mail to this DNS mail server.
RELATED DOCUMENTATION
Congure the Exim4 Agent to Send E-mail | 283
282

Congure the Exim4 Agent to Send E-mail
Congure your DNS server to resolve the FQDN of the Exim4 host to the Paragon Insight's virtual IP
address (VIP).
To congure the Exim4 Agent to send email, you must rst congure the Paragon Insights primary node
as the Exim4 host. To do so, you must enter the node's FQDN in the healthbot.sys le. The healthbot.sys
le contains a list of all environment variables for the Paragon Insights microservices. Aer you modify
the healthbot.sys le with the Exim4 hostname, you must run the healthbot restart command to restart
the alerta microservice with the changes you made.
NOTE: Before you begin, congure your DNS server to resolve the FQDN of the Exim4 host to
the Ingress Controller's VIP.
Use the following steps to enable the Exim4 agent to send e-mails.
1. Log into the Paragon Insights primary node using your server credenals.
2. Type the following command to become a root user.
root@primary-node# su -root
3. Change to the /var/local/healthbot path.
root@primary-node# cd /var/local/healthbot
4. Type the following command to open the healthbot.sys le.
root@primary-node:/var/local/healthbot# vi healthbot.sys
5. Scroll down to the api-server secon in the healthbot.sys le.
6. Type the Paragon Insights primary node FQDN as the value for the
HOST_HOSTNAME
variable.
For example, HOST_HOSTNAME = example.domain.top-level-domain.
7. Type :wq! to save the changes and exit the le.
8. Type the following command to update and restart the alerta microservice.
root@primary-node# ./healthbot restart --device-group healthbot -s alerta
Now, you have enabled the Exim4 agent to send e-mails to the e-mail account associated with the
primary node.
To send e-mail alert nocaons, you must congure your e-mail address in a nocaon prole and
enable that nocaon prole on device groups. See "Alerts and Nocaons" on page 252 for more
informaon.
To e-mail reports, you must congure your e-mail address in the report sengs. See "Generate Reports"
on page 268 for more informaon.
283

RELATED DOCUMENTATION
Use Exim4 for E-Mails | 282
Manage Audit Logs
IN THIS SECTION
Filter Audit Logs | 284
Export Audit Logs | 285
Paragon Insights Commands and Audit Logs | 286
An audit log is a record of a sequence of acvies that have aected a specic operaon or procedure.
Audit logs are useful for tracing events and for maintaining historical data.
Audit logs contain informaon about tasks iniated by using the Paragon Insights GUI or APIs. In
addion to providing informaon about the resources that were accessed, audit log entries usually
include details about user-iniated tasks, such as the name of the user who iniated a task, the status of
the task, and date and me of execuon.
Audit logs from microservices, such as healthbot command and config server are collected in the audit log
client library, and are stored in the Postgres SQL database. The audit log client library is installed with
microservices during Paragon Insights installaon.
NOTE: Device-driven tasks (tasks not iniated by the user) are not recorded in audit logs.
Filter Audit Logs
You can lter audit logs from the Administraon > Audit Logs page of the Paragon Insights GUI. You can
apply lters to audit logs before you export audit logs in a CSV le.
1. Select Administraon > Audit Logs.
The Audit Logs page appears displaying the audit logs.
284

2. Click Filter > Add Filter.
The Add Criteria pop-up appears.
3. Enter the following informaon in the Add Criteria pop-up.
a. Select the column you want to apply the lter to from the Field drop-down list.
b. Select the condion you want to apply the column from the Condion drop-down list.
c. Enter the start or nish me in the Value text box, that you want to apply to the lter.
4. Click Add to apply the lter.
(Oponal) You can export audit logs as a CSV le or PDF le aer you apply a lter. For more
informaon, see "Export Audit Logs" on page 285.
Export Audit Logs
Starng in Release 4.1.0, you can export audit logs in a portable document format (PDF) le and comma-
separated values (CSV) le.
To export audit logs:
1. Select Administraon > Audit Logs.
The Audit Logs page appears.
2. Click Export Logs > CSV to download audit logs in a CSV format.
Click Export Logs > PDF to download audit logs in PDF format.
In the warning message that appears, do any one of the following:
• Click Connue to export all audit logs with all elds as CSV or PDF les.
• Click Filter to lter audit log elds before you export as a CSV le. You cannot lter audit logs
before you export as PDF le.
To lter audit logs, see "Filter Audit Logs" on page 284.
Aer you have applied a lter, click Export Logs>CSV again to start the export.
NOTE: You can export audit logs for a maximum of 30 days prior to the current date and me.
For example, if the current date is May 31, 2018, you can export the audit logs starng from May
1, 2018.
Depending on the sengs of the browser that you are using, the CSV/PDF le containing the audit logs
for the specied me period is either downloaded directly, or you are asked to open or save the le.
285

Paragon Insights Commands and Audit Logs
Starng with Paragon Insights Release 4.1.0, audit logs are generated when you run the following
commands from the CLI:
• add-node
• remove-node
• modify-uda-engine
• modify-udf-engine
• modify-workflow-engine
• remove-plugin
• load-plugin
The audit log generated will include informaon on who iniated the job, node name, and status of the
job. You must enter credenals (username and password) to run the commands. If you have already set a
username (HB_USERNAME) and password (HB_PASSWORD), you are not prompted to enter credenals when you
run a command.
Change History Table
Feature support is determined by the plaorm and release you are using. Use Feature Explorer to
determine if a feature is supported on your plaorm.
Release
Descripon
4.1.0 Starng in Release 4.1.0, you can export audit logs in a portable document format (PDF) le and comma-
separated values (CSV) le.
Congure a Secure Data Connecon for Paragon
Insights Devices
IN THIS SECTION
Congure Security Proles for SSL and SSH Authencaon | 288
286

Congure Security Authencaon for a Specic Device or Device Group | 288
Paragon Insights (formerly HealthBot) supports the following authencaon methods to provide a
secure data connecon for Paragon Insights devices:
Authencaon
Method
Sensor Type Descripon Required Paragon Insights
Security Parameters
Mutual SSL OpenCong Client authencates itself with
the server and the server
authencates itself with the
client.
• Local cercates (includes
the client cercate and
client key)
• CA cercate
• Server common name
Server-side SSL OpenCong Server authencates itself with
the client.
• CA cercate
• Server common name
Public key SSH iAgent Authencates users with
password-protected SSH key
les.
• SSH key le
• Passphrase
• Username
Password All Authencates users with a
password.
• Username
• Password
You can associate SSL or SSH cercates and keys with Paragon Insights devices through user-dened
security proles:
• "Congure Security Proles for SSL and SSH Authencaon" on page 288
• "Congure Security Authencaon for a Specic Device or Device Group" on page 288
287

Congure Security Proles for SSL and SSH Authencaon
To congure security proles for SSL and SSH authencaon:
1. Click the Sengs > Security opon in the le-nav bar.
2. Click the add prole buon for one of the following proles and enter the required informaon:
Security Prole Descripon of Parameters
CA
Name Enter prole name.
Upload Cercate Choose the CA cercate le and then click Open. The
supported le extension is CRT.
Local Cercates
Name Enter prole name.
Upload Cercate Choose the client cercate le and then click Open. The
supported le extension is CRT.
Upload Key Choose the client key le and then click Open. The
supported le extension is KEY.
SSH Keys
Name Enter prole name.
Upload Key File Choose the private key le generated by ssh-keygen and
then click Open.
Passphrase Enter the authencaon passphrase.
3. Click Save to save the conguraon or click Save and Deploy to save and deploy the conguraon.
4. Repeat Steps 4 and 5, as needed.
5. Apply the security proles to a specic device or device group. For more details, see "Congure
Security Authencaon for a Specic Device or Device Group" on page 288.
Congure Security Authencaon for a Specic Device or Device Group
288

1. Click the Dashboard opon in the le-nav bar.
2. Click the name of the device or device group for which you want to congure security
authencaon. The device or device group prole pane appears, respecvely.
3. Under Authencaon, enter the required parameters for each applicable authencaon method:
Password, SSL, or SSH. All methods can be congured together on a single device or device group
prole.
Authencaon Method Descripon of Parameters
Password
Username Enter the authencaon username.
Password Enter the authencaon password.
SSL
Server Common
Name
Enter the server name protected by the SSL
cercate.
CA Prole* Choose the applicable CA prole(s) from the drop-
down list.
Local Cercate* Choose the applicable local cercate prole(s) from
the drop-down list.
SSH
SSH Key Prole* Choose the applicable SSH key prole(s) from the drop-
down list.
Username Enter the authencaon username.
*To edit or view details about saved security proles, go to the Sengs > Security page in the le-
nav bar.
The following guidelines apply to the Authencaon conguraon:
• Paragon Insights decides which authencaon method to apply to a device or device group based
on which of the required security parameters are congured.
• When more than one method is valid, Paragon Insights priorizes SSL and SSH authencaon
over password-based authencaon.
• Paragon Insights priorizes device-level sengs over device group-level sengs.
4. Click Save to save the conguraon or click Save and Deploy to save and deploy the conguraon.
289

Congure Data Summarizaon
IN THIS SECTION
Creang a Raw Data Summarizaon Prole | 292
Creang a Data Rollup Summarizaon Prole | 294
Applying Data Summarizaon Proles to a Device Group | 297
Data summarizaon refers to the process of creang a concise version of raw data and eld data. Data
can be summarized as a funcon of me or when a change occurs. You can improve the performance
and disk space ulizaon of the Paragon Insights (formerly HealthBot) me series database (TSDB) by
conguring data summarizaon methods to summarize the raw data and eld data collected by Paragon
Insights.
Paragon Insights collects data by using push or pull data collecon methods. You can create Paragon
Insights rules or use the available predened rules to determine how and when data is collected. This
collected telemetry data provides informaon about the state of network devices and its components.
For more informaon on data collecon methods, see Paragon Insights Data Ingest Guide.
You can create a raw data summarizaon prole to improve the performance and disk space ulizaon
of the TSDB. Starng with Paragon Insights Release 4.0.0, you can create a rollup summarizaon prole
to summarize processed data that is stored in elds in the TSDB. Field data is processed data that is
stored in elds in the TSDB. A eld is a single piece of informaon that forms a record in a database. In
TSDB, mulple elds of processed data make a record. In releases earlier than Paragon Insights Release
4.0.0, only raw data can be summarized.
Table 20 on page 290 provides a list of the supported data summarizaon algorithms and a descripon
of their output:
Table 20:
Descripons of the Data Summarizaon Algorithms
Algorithm Descripon of output
Latest Value of the last data point collected within the me span.
Count Total number of data points collected within the me span.
290

Table 20: Descripons of the Data Summarizaon Algorithms
(Connued)
Algorithm Descripon of output
Mean Average value of the data points collected within the me span.
Min Minimum value of the data points collected within the me span.
Max Maximum value of the data points within the me span.
On-change Value of the data point whenever the value is dierent from the previous data point (occurs
independently from the user-dened me span).
Stddev Standard deviaon of the data points collected within the me span.
Sum Sum of the data points collected within the me span.
If no summarizaon algorithm is associated with the data, the following algorithms are used by default:
Data type Data summarizaon algorithm
Float, integer, unsigned Mean
Boolean, string On-change
You can use data summarizaon proles to apply specic summarizaon algorithms to raw data and eld
data collected by Paragon Insights for a specic device group:
These topics provide instrucons on how to create a data summarizaon prole.
• "Creang a Raw Data Summarizaon Prole" on page 292
• "Creang a Data Rollup Summarizaon Prole" on page 294
Aer you have created a data summarizaon prole, you can apply the prole to a device group. For
more informaon, see "Applying Data Summarizaon Proles to a Device Group" on page 297.
291

Creang a Raw Data Summarizaon Prole
To create a raw data summarizaon prole that can be applied to a device group:
1. Click Sengs > Summarizaon Proles link in the le-nav bar.
2. Select Raw Data from the Summarizaon Proles list.
The Raw Data Summarizaon Proles page is displayed.
3. Click (+) icon to add a summarizaon prole.
The Add Raw Data Summarizaon Prole page is displayed.
4. In the Name text box, enter the name of the prole.
5. Click Add Type Aggregate to add an aggregate type.
The Name and Funcon drop-down lists are displayed.
Follow these steps to select a name data type and associate it with a data summarizaon algorithm.
The algorithm congured for a specic sensor path name overrides the algorithm congured for the
corresponding data type.
a. Select a name data type from the Name drop-down list.
The available name data types to choose from are string, integer, boolean, oat, and unsigned
integer.
Starng in Paragon Insights Release 4.2.0, you can also select unsigned integer as a name data
type. An unsigned integer is a data type that can contain values from 0 through 4,294,967,295.
b. Aer you have selected a name data type, you associate it with a data summarizaon funcon.
To associate a name data type with a data summarizaon funcon, select a funcon from the
Funcons drop-down list.
The available funcons to choose from are latest, count, mean, min, max, on-charge, stddev, and
sum.
c. (Oponal) To add another aggregate type, click Add Type Aggregate, and repeat step "5.a" on page
292 and step "5.b" on page 292.
6. Click Add Path Aggregate to add an aggregate path.
The Name and Funcon drop-down lists are displayed.
To assign a sensor path name and associate it with a data summarizaon algorithm:
292
NOTE:
The algorithm congured for a specic sensor path name overrides the algorithm congured
for the corresponding data type.
a. Enter a sensor path name in the Name text box.
You can enter a path name for a sensor that is not supported by Paragon Insights. For sensors
supported by Paragon Insights, the path name must be entered in the following format:
Sensor Path Name Format Example
Open Cong
sensor-path
/components/component/name
Nave GPB
sensor-name:sensor-path
jnpr_qmon_ext:queue_monitor_element_
info.percentage
iAgent
yaml-table-name:sensor-path
REulizaonTable:15_min_cpu_idle
SNMP
snmp-table-name:sensor-path
.1.3.6.1.2.1.2.2:jnxLED1Index
ospfNbrTable:ospfNbrIpAddr
Syslog
paern-set: sensor-path
interface_link_down:operaonal-status
Flow (NetFlow)
template-name:sensor-path
hb-ipx-ipv4-
template:sourceIPv4Address
b. Aer you have entered a sensor path name, you associate it with a data summarizaon funcon.
To associate a sensor path name with a data summarizaon funcon, select a funcon from the
Funcons drop-down list.
The available funcons to choose from are latest, count, mean, min, max, on-charge, stddev, and
sum.
c. (Oponal) To add another aggregate path, click Add Path Aggregate, and repeat step "6.a" on page
293 and step "6.b" on page 293.
7. Click Save to only save the conguraon.
293

Click Save & Deploy to save and immediately deploy the conguraon.
8. You can now apply the raw data summarizaon prole that you created to a specic device group.
For more informaon, see "Applying Data Summarizaon Proles to a Device Group" on page 297.
Creang a Data Rollup Summarizaon Prole
Paragon Insights Release 4.0.0 supports data rollup summarizaon. You can create a rollup
summarizaon prole to summarize processed data that is stored in elds in the TSDB. Field data is
processed data that provides informaon on network devices and its components, and is stored in elds
in the TSDB. A eld is a single piece of informaon that forms a record in a database. In TSDB, mulple
elds of processed data make a record. Data rollup summarizaon enables ecient data storage and
also ensures retaining of data for a longer duraon.
You can create a data rollup summarizaon prole to apply to a device group from the:
• Paragon Insights graphical user interface (GUI)
• Command line interface (CLI)
Create a Data Rollup Summarizaon Prole by using Paragon Insights UI
To create a data rollup summarizaon prole:
1. Click Sengs > Summarizaon Proles link in the le-nav bar.
2. Select Data Rollup from the Summarizaon Proles list.
The Data Rollup Summarizaon Proles page is displayed.
3. Click (+) icon to add a summarizaon prole.
The Add Data Rollup Summarizaon Prole page is displayed.
4. Enter the name of the prole in the Name text box.
The maximum length is 64 characters.
Regex paern: “[a-zA-Z][a-zA-Z0-9_-]*”
5. Click Add Rule to add an exisng Paragon Insights rule for which rollup summarizaon must be
applied.
The Name and Apply on Exisng Data drop-down lists are displayed.
Follow these steps to select a rule, and to apply the rule to the prole. You can also apply the rule to
exisng data.
294
a. Select an exisng Paragon Insights from the Name drop-down list.
b. To apply the rule that you selected to exisng data, select True from the Apply on Exisng Data
drop-down list.
The default value is False.
c. Click Add Field to dene elds of the rule congured for which data rollup summarizaon must be
applied.
To associate a eld to an aggregate funcon:
i. Select a eld from the Name drop-down list for which data must be aggregated.
ii. Select one or more aggregate funcons from the Aggregate Funcon drop-down list that you
want to apply to a eld.
d. (Oponal) To add another rule to the prole, click Add Rule, and repeat step "5.a" on page 295
through step "5.c" on page 295.
6. Click Add Data Rollup Order to dene the frequency at which rollup summarizaon should occur.
The Name and Retenon Policy drop-down lists, and the Rollup Interval text box are displayed.
To dene a data rollup order:
a. Enter a name to idenfy the data rollup order in the Name text box.
The maximum length is 64 characters.
Regex paern: “[a-zA-Z][a-zA-Z0-9_-]*”
b. Enter a value in the Rollup Interval text box to dene the interval in which data is summarized.
Regex paern: “[1-9][0-9]*[mhdw]”, where m is minutes, h is hours, d is days, and w is weeks.
Minimum value is 30m. Maximum value is 52w.
c. Select the retenon policy for the rollup order from the Retenon Policy drop-down list. A
retenon policy denes how long you want to retain the rolled-up data.
Selecng a retenon policy is oponal. If you do not select a retenon policy, the device group
retenon policy is considered by default.
d. (Oponal) To dene another data rollup order, click Add Data Rollup Order, and repeat step "6.a"
on page 295 through step "6.c" on page 295.
7. Click Save to only save the conguraon.
Click Save and Deploy to save and immediately deploy the conguraon.
295

8. You can now apply the data rollup summarizaon prole that you created to a specic device group.
For more informaon, see "Applying Data Summarizaon Proles to a Device Group" on page 297.
Create a Data Rollup Summarizaon Prole by using CLI
Figure 61 on page 296 is an example conguraon of how you can congure a data rollup
summarizaon prole from the CLI.
Figure 61: Example CLI Conguraon of Creang a Data Rollup Summarizaon Prole
296

Applying Data Summarizaon Proles to a Device Group
Aer you create a data summarizaon prole, you can apply the prole to a specic device group to
start summarizing TSDB data:
1. Click Conguraon > Device Group in the le-nav bar.
The Device Group Conguraon page is displayed.
2. Select the check box next to the name of the device group to which you want to apply the data
summarizaon prole.
3. Click the Edit Device Group icon to edit the device group.
The Edit <
device-group-name
> page is displayed.
4. Apply a raw data summarizaon prole.
To apply a raw data summarizaon prole to a device group:
a. Click Summarizaon.
The Time Span and Data Summarizaon text boxes are displayed.
b. Enter the Time Span in seconds (s), minutes (m), hours (h), days (d), weeks (w), or years (y).
c. Choose the data summarizaon proles from the drop-down list to apply the ingest data. To edit
or view details about saved data summarizaon proles, go to the Data Summarizaon page and
click the Sengs menu opon in the le-nav bar.
If you select two or more proles, the following guidelines apply:
• If the same data type or sensor path name is congured in two or more proles, the associated
algorithms will be combined.
• The table that stores the summarizaon output includes columns of summarized data for each
algorithm associated with each data eld collected by Paragon Insights. The naming
convenon for each column is as follows:
Number of algorithms
associated with a data eld
Column name for the summarized output
1
eld-name
Example: 5_sec_cpu_idle
297

(Connued)
Number of algorithms
associated with a data eld
Column name for the summarized output
2
eld-name_rst-algorithm-name
,
eld-name_ second-algorithm-
name
Example: 5_sec_cpu_idle_MIN, 5_sec_cpu_idle_MAX
3
eld-name_rst-algorithm-name
,
eld-name_ second-algorithm-
name
,
eld-name_ third-algorithm-name
...
Apply a data rollup summarizaon prole
Points to remember before you apply a data rollup summarizaon prole to a device group:
• Ensure that the rules present in the rollup prole are already associated with the device group.
• You can add one or more than one rollup summarizaon prole to a device group.
• Rules congured across all the proles associated with the device group must be unique.
• While associang a rollup prole with a device group, the interval of the rst data rollup order
must be less then the device group retenon policy to avoid data overow. The device group
retenon policy is set to 7 days by default.
• When you want to remove a rule that is associated to a device group, you must rst remove the
data rollup summarizaon prole.
To apply a data rollup summarizaon prole to a device group:
a. Click Rollup Summarizaon.
The Rollup Summarizaon Proles drop-down list is displayed.
b. Select the rollup summarizaon proles you want to associate to this device group from the
Rollup Summarizaon Proles drop-down list.
c. (Oponal) You can also deploy rollup conguraon at the device group-level by using the CLI.
See Figure 62 on page 299 for an example CLI conguraon.
298

Figure 62: Example CLI Conguraon
5. Click Save to only save the conguraon.
Click Save and Deploy to save and immediately deploy the conguraon.
Change History Table
Feature support is determined by the plaorm and release you are using. Use Feature Explorer to
determine if a feature is supported on your plaorm.
Release
Descripon
4.0.0 Paragon Insights Release 4.0.0 supports data rollup summarizaon. You can create a rollup
summarizaon prole to summarize processed data that is stored in elds in the TSDB.
Modify the UDA, UDF, and Workow Engines
IN THIS SECTION
Overview | 300
How it Works | 302
Usage Notes | 303
Conguraon | 303
299
Enable UDA Scheduler in Trigger Acon | 306
Overview
When creang rules, Paragon Insights (formerly HealthBot) includes the ability to run user-dened
acons (UDAs) as part of a trigger. UDAs are essenally Python scripts that can be executed by a
Paragon Insights rule. For example, you might congure a rule with a trigger that reacts to some crical
interface going down and responds to the event by calling a funcon to send an SMS alert. You can
write the logic to send the SMS in a UDA python script.
Starng with Paragon Insights Release 4.1.0, you can schedule UDAs and nocaons. This is useful
when you deploy mulple parallel instances of Paragon Insights in dierent locaons. You can schedule
UDAs to run alternavely from UDA schedulers located in dierent regions. In the event of a node
failure, the UDA scheduler running in a parallel instance connues to execute your UDAs and
nocaons. For more informaon, see "Enable UDA Scheduler in Trigger Acon" on page 306.
Paragon Insights also includes the ability to run user-dened funcons (UDFs). Created as Python
scripts, UDFs provide the ability to process incoming telemetry data from a device and store the
processed value in the me-series database for that device/device-group. For example, the device may
be sending FPC temperature in Celsius but you want to process it to be stored as Fahrenheit values in
the database.
Starng with HealthBot Release 3.2.0, the processing of UDF/UDA elds has been moved to
microservices called UDF farm. This approach allows for Paragon Insights to process mulple data points
from mulple devices and elds at the same me (parallel processing). The result is a 4 to 5 mes
increase in processing performance for UDA/UDF.
While UDAs and UDFs provide excellent addional capabilies to Paragon Insights, there can be cases
where the scripts may be imporng Python modules that are not included in the default Paragon
Insights installaon. Given this, you need to be able to add modules as needed to the engine that runs
these scripts. Paragon Insights Release 2.1.0 and later solves this challenge by allowing you to modify
the UDA, UDF and Workow engines, using a bash script that contains the instrucons to install any
dependencies.
Global Variables in Python Scripts
TAND executes Python scripts that use global variables. Global variables retain a value across mulple
UDFs.
300

The following is an example funcon to calculate cumulave sum and store the value in global variable
sum
.
sum = 0
def cumulative_sum (a, b):
global sum
sum = sum + a + b
return sum
Using global variables in UDFs can prevent you from availing the gains in processing performance
ensured by UDF farms.
Instead of global variables, you can use the Python construct **kwargs to capture values that must be
retained across dierent funcons. When Paragon Insights calls a funcon (dened in a UDF), it sends
topic name, rule name, device group, point me, and device ID that are captured using the construct
**kwargs. In case of UDAs, Paragon Insights sends topic name and rule name while execung the Python
script.
Along with infrastructure values, Paragon Insights also sends a parameter called
hb_store
in **kwargs that
fetches the last computed value for a variable.
To illustrate how hb_store works in the cumulave addion example:
def sum(a, b, **kwargs):
if ’sum’ not in kwargs[hb_store]:
kwargs[hb_store][’sum’] = 0 #if ’sum’ is not present in kwargs, declare the
initial ’sum’ value as 0.
kwargs[hb_store][’sum’] = kwargs[hb_store][’sum’] + a + b #Store cumulative
addition value in ’sum’
return kwargs[hb_store][’sum’]
Each me a funcon with the above code is called, it performs addion of last stored value in ’sum’ with
the value of
a
and value of
b
. The new value of addion operaon is displayed and stored in ’sum’.
301

How it Works
You can modify the UDA, UDF, or Workow engine using the Paragon Insights CLI, as shown below.
user@HB-server:~$ healthbot modify-uda-engine --help
usage: healthbot modify-uda-engine [-h] (-s SCRIPT | --rollback) [--simulate]
optional arguments:
-h, --help show this help message and exit
-s SCRIPT, --script SCRIPT
Run script in UDA engine
--rollback, -r Rollback UDA engine to original state
--simulate Run script in simulated UDA engine and show output
user@HB-server:~$ healthbot modify-udf-engine --help
usage: healthbot modify-udf-engine [-h] (-s SCRIPT | --rollback) [--simulate]
[--service SERVICE]
optional arguments:
-h, --help show this help message and exit
-s SCRIPT, --script SCRIPT
Run script in UDF engine
--rollback, -r Rollback UDF engine to original state
--simulate Run script in simulated UDF engine and show output
--service SERVICE Modify specific service UDF
root@davinci-master:/var/local/healthbot# healthbot modify-workflow-engine --help
usage: healthbot.py modify-workflow-engine [-h] (-s SCRIPT | --rollback)
[--simulate]
optional arguments:
-h, --help show this help message and exit
-s SCRIPT, --script SCRIPT
Run script in WORKFLOW engine
--rollback, -r Rollback WORKFLOW engine to original state
--simulate Run script in simulated WORKFLOW engine and show output
The commands have three main opons:
302

• Simulate—test a script (and view its output) in the simulated UDA/UDF/Workow engine
environment without aecng the running Paragon Insights system
• Modify—modify the actual UDA/UDF/Workow engine using a script
• Rollback—revert to the original version of the UDA/UDF/Workow engine
Usage Notes
• The bash script will run in a container running Ubuntu OS Release 16.04 or 18.04; write the script
accordingly.
• The script must be non-interacve; any quesons must be pre-answered. For example, use the ‘-y’
opon when installing a package using apt-get.
• If you prefer to copy the source packages of the dependency modules onto the Paragon Insights
server so the engine can manually install them instead of downloading them from the Internet, place
the required source packages in the /var/local/healthbot/input directory. Then within your bash
script, point to the /input directory. For example, to use a le placed in /var/local/healthbot/input/
myle.txt, set the bash script to access it at /input/myle.txt.
• Modifying the UDA/UDF/Workow engine more than once is
not
an incremental procedure; use a
new bash script that includes both the original and new instrucons, and re-run the modify
procedure using the new script.
• UDA/UDF/Workow modicaons are persistent across upgrades.
Conguraon
As a best pracce, we recommend that you use the following workow:
This best-pracce approach ensures that you rst validate your script in the simulated environment
before modifying the real engine.
303

NOTE: The examples below use the UDA engine; these procedures apply equally to the UDF and
Workow engines.
NOTE: The procedure below assumes your Paragon Insights server is installed, including running
the sudo healthbot setup command.
SIMULATE
Use the simulate feature to test your bash script in the simulated environment, without aecng the
running Paragon Insights system.
To simulate modifying the UDA engine:
1. Enter the command healthbot modify-uda-engine -s
/<path>/<script-file>
--simulate.
2. The script runs and the output shows on screen, just as if you entered the script commands yourself.
user@HB-server:~$ healthbot modify-uda-engine -s /var/tmp/test-script.sh --simulate
Running /var/tmp/test-script.sh in simulated alerta engine..
Get:1 http://security.ubuntu.com/ubuntu xenial-security InRelease [109 kB]
...
Fetched 4296 kB in 15s (278 kB/s)
Reading package lists...
Building dependency tree...
Reading state information…
...
MODIFY
When you are sased with the simulaon results, go ahead with the actual modicaon procedure.
To modify the UDA engine:
1. Load the desired bash script onto the Paragon Insights server.
2. If your Paragon Insights server is fully up and running, issue the command healthbot stop -s alerta to
stop the running services.
304

3. Run the command healthbot modify-uda-engine -s
/<path>/<script-file>
.
user@HB-server:~$ healthbot modify-uda-engine -s /var/tmp/test-script.sh
Running /var/tmp/test-script.sh in simulated alerta engine..
Success! See /tmp/.alerta_modification.log for logs
Please restart alerta by issuing 'healthbot start --device-group healthbot -s alerta'
4. (Oponal) As noted in the output, you can check the log le to further verify the script was loaded
successfully.
5. Restart the alerta service using the command healthbot start -s alerta.
6. Once complete, verify that the alerta service is up and running using the command healthbot status.
7. To verify that the UDA engine has been updated, use the command healthbot version -s alerta and
check that the healthot_alerta container is using the
<version>
-custom tag.
user@HB-server:~$ healthbot version -s alerta
{'alerta': 'healthbot_alerta:2.1.0-custom'}
The UDA engine is now running with the installed dependencies as per the bash script.
ROLLBACK
If you have a need or desire to remove the changes to the engine, you can revert the engine to its
original state.
To rollback the UDA engine:
1. Enter the command healthbot modify-uda-engine --rollback.
user@HB-server:~$ healthbot modify-uda-engine --rollback
Rolling back alerta engine to original state..
Successfully rolled back alerta engine
Please restart alerta by issuing 'healthbot start --device-group healthbot -s alerta'
Note that it is not necessary to restart the alerta service at this point.
2.
Once complete, verify that the alerta service is up and running using the command healthbot status.
305

3. To verify that the UDA engine has reverted back, use the command healthbot version -s alerta and
check that the healthot_alerta container is using the
<version>
tag.
user@HB-server:~$ healthbot version -s alerta
{'alerta': 'healthbot_alerta:2.1.0'}
The UDA engine is now running in its original state, with no addional installed dependencies.
Enable UDA Scheduler in Trigger Acon
In Paragon Insights Release 4.1.0, you can schedule UDAs and nocaons to be executed within a set
me interval. To schedule UDAs, you must rst create a discrete scheduler and then link the scheduler in
the Trigger Acon page.
NOTE: You can link only one trigger acon scheduler to a Paragon Insights instance.
To know more about creang a scheduler, see "Generate Reports" on page 268.
The scheduler set in Trigger Acon applies to all device groups and network groups. You can disable
UDA scheduling in the device group or network group conguraon. To know more, see "Manage
Devices, Device Groups, and Network Groups" on page 121.
To enable a scheduler:
1. Go to Sengs > System.
2. Click the Trigger Acon tab.
The Trigger Acon page appears.
3. Select a scheduler prole that you want to associate with Trigger Acon.
4. Do one of the following:
• Click Save to save the scheduler prole.
The prole is not applied to device or network groups. This opon enables you to commit or
rollback the conguraon changes in the plaorm.
• Click Save and Deploy to deploy the conguraon in your Paragon Insights instance.
306

The UDAs and nocaons are generated based on the me period and me interval congured
in the scheduler for the applicaon instance.
You cannot rollback conguraon changes applied through Save and Deploy. However. you can
remove the scheduler prole and repeat the save and deploy opon to cancel UDA scheduling.
Change History Table
Feature support is determined by the plaorm and release you are using. Use Feature Explorer to
determine if a feature is supported on your plaorm.
Release Descripon
3.2.0 Starng with HealthBot Release 3.2.0, the processing of UDF/UDA elds has been moved to
microservices called UDF farm.
Commit or Roll Back Conguraon Changes in
Paragon Insights
In Paragon Insights, when you make changes to the conguraon, you can perform the following
operaons:
• Save
• Save and Deploy
• Delete
• Delete and Deploy
These operaons and their eect on the Paragon Insights ingest services are explained in Table 21 on
page 308.
For changes that were not already deployed, you can either commit or roll back the changes, which you
can do using the Health Conguraon Deployment Status page; the procedure is provided below Table
21 on page 308.
307

Table 21: Operaons Aer Changing the Conguraon in Paragon Insights
Operaon Explanaon Eect on Ingest Services
Save Saves the changes to the
database, but doesn't apply
the changes to the ingest
services.
No eect unl the changes are commied.
Delete Deletes the changes from the
database. but doesn't apply
the changes to the ingest
services.
Save and
Deploy
Saves the changes to the
database and applies the
changes to the ingest
services.
Paragon Insights Release 4.1.0 and earlier—The ingest services
starts processing the data based on the changes congured.
Paragon Insights Release 4.2.0 and later—When you commit a
conguraon, the changes are accepted aer validaon and
acknowledged immediately.
The background job runs periodically and applies the changes
to ingest services. Only aer the background job applies these
changes, does the ingest service process data based on the
changes congured.
Delete and
Deploy
Deletes the changes from the
database and applies the
changes to the ingest
services.
NOTE: Users might do the Save or Delete operaons if they have mulple conguraon steps
and want to stack the conguraon steps, so that they can later commit the changes at one go.
To commit or roll back conguraon changes in Paragon Insights:
1. On the Paragon Insights banner, click the deployment status icon.
The Health Conguraon Deployment Status page appears displaying:
• The status of the last deployment.
• The list of device groups and network groups for which pending changes have not been
commied.
• The list of device groups and network groups for which pending deleons have not been
commied.
2. You can do one of the following:
308

• Commit any changes that are pending deployment:
a. Click Commit.
Paragon Insights triggers the commit operaon and the conguraon changes are applied to
the ingest services. Depending on the number of conguraon changes and number of device
groups and network groups aected, applying the conguraon changes to the ingest services
might take between a few seconds or a few minutes to complete.
Aer the operaon completes, a conrmaon message is displayed. Paragon Insights starts
running the associated playbooks and starts ingesng the data.
b. Go to Step 3.
• Roll back any changes that are pending deployment:
a. Click Rollback to roll back any changes that are pending deployment. (The roll back operaon
discards the pending conguraon changes that were previously saved in the database.)
Paragon Insights triggers the roll back operaon and the conguraon changes are rolled back
almost immediately. Aer the rollback is complete, a conrmaon message is displayed.
b. Go to Step 3.
NOTE: Aer the roll back or commit operaon is completed, the status of the last deployment
in the Health Conguraon Deployment Status page displays the last operaon that was
completed.
3. Click Close to exit the page.
You are returned to the previous page from which you accessed the Health Conguraon
Deployment Status page.
Logs for Paragon Insights Services
IN THIS SECTION
Congure Service Log Levels for a Device Group or Network Group | 310
Download Logs for Paragon Insights Services | 311
309

Paragon Insights (formerly HealthBot) runs various services (such as iAgent, jmon, and Telegraf) to
monitor the health of the network and individual devices. Each of these Paragon Insights services runs
independently in a containerized environment and produces its own set of log messages that are
categorized by severity level. You can congure dierent levels of logs to collect and download.
Table 22 on page 310 lists the severity levels of the Paragon Insights services logs. The severity levels
are listed in order from the highest severity (greatest eect on funconality) to the lowest. If you select
a lower severity level, the logs for each of the higher severity levels will also be collected. The log level
for all services is set to error by default.
Table 22: Paragon Insights Service Log Message Severity Levels
Severity Level Descripon
Error (Highest level) Condions that require correcon.
Condions that warrant monitoring.
Info Non-error condions of interest.
Debug (Lowest level) Debug messages.
This topic includes:
• "Congure Service Log Levels for a Device Group or Network Group" on page 310
• "Download Logs for Paragon Insights Services" on page 311
Congure Service Log Levels for a Device Group or Network Group
You can collect dierent severity levels of logs for the running Paragon Insights services of a device
group or network group. To congure which log levels to collect:
1. Click the Conguraon > Device Group opon in the le-nav bar.
2. For a device group, click on the device group name from the list of DEVICE GROUPS.
For a network group, click on the network group name from the list of NETWORK GROUPS.
3. For a Device Group, click the Edit Device Group (Pencil) icon
For a Network Group, click the Edit Network Group (Pencil) icon
310

4. In the edit window that pops up, click the caret next to the Logging Conguraon heading to display
the conguraon elds.
5. From the drop-down list for Global Log Level, select the level of the log messages that you want to
collect for every running Paragon Insights service for the device or network group. See Table 22 on
page 310 for a denion of the log severity levels. The level is set to error by default.
6. In the Log Level for specic services secon, select the log level from the drop-down list for any
specic service that you want to congure dierently from the Global log level seng. The log level
that you select for a specic service takes precedence over the Global log level seng.
7. Click Save to save the conguraon or click Save and Deploy to save and deploy the conguraon.
Download Logs for Paragon Insights Services
You can choose to download the collected logs for:
• Every running Paragon Insights service for a specic device group or network group.
• A specic running Paragon Insights service for a specic device group or network group.
• Common Paragon Insights services that are running by default for the Paragon Insights applicaon.
To download the logs for Paragon Insights services:
1. Select the Administraon > Log Collecon opon in the le-nav bar.
2. Select the Group Type, Group Name, and Service Name of the logs that you want to download:
Parameter Descripon
Group Type Opons are:
device Services running for a device group
network Services running for a network group
common-services Services running by default for the Paragon Insights
applicaon.
311
(Connued)
Parameter Descripon
Group Name
• For device Group Type, select a device group name.
• For network Group Type, select a network group name.
• For common-services Group Type, select Paragon Insights.
Service Name Select the specic Paragon Insights service for which you want to
download the logs.
3. Click Download to download the logs to a le on your server. The lename is healthbot_logs.gzip by
default.
Troubleshoong
IN THIS SECTION
Paragon Insights Self Test | 313
Device Reachability Test | 315
Ingest Connecvity Test | 317
Debug No-Data | 319
Starng with Release 2.1.0, HealthBot supports four vericaon and troubleshoong features:
• "Paragon Insights Self Test" on page 313: Veries that Paragon Insights is working properly
• "Device Reachability Test" on page 315: Veries that network devices are up and reachable via ping
& SSH
• "Ingest Connecvity Test" on page 317: Validates which ingest types are supported for a given device
312

• "Debug No-Data" on page 319: Provides debugging when a device shows “No-data” in Paragon
Insights GUI
You can access these features by navigang to Administraon > Debug from the le-nav panel.
Paragon Insights Self Test
Overview
When seng up basic funconality in Paragon Insights, it can be challenging to diagnose problems.
From installaon, to device conguraon, to adding devices and applying playbooks, when an issue
occurs there are many possible areas to invesgate.
Starng with HealthBot Release 2.1.0, the self-test tool validates the core funconality of Paragon
Insights. To perform the self test, the tool performs a typical set of tasks:
• Adds a simulated device to Paragon Insights
• Creates a device group, and adds the device
• Creates a rule
• Creates and deploys a playbook
• Streams data from the simulated device
• Displays ongoing status in the dashboard
The self-test instance essenally acts as a fully working setup, running enrely within the Paragon
Insights system. When tesng is complete, the tool provides a report.
Other Uses for the Self Test Tool
In addion to validang the Paragon Insights installaon, the self-test feature also provides:
• An easy way to do a quick demo - the self test instance provides a simulated device connected to
Paragon Insights, so you can demo Paragon Insights with no need to add a real device or apply
playbooks.
• A good way for new users to get started - the self test auto-congures a simulated device connected
to Paragon Insights, thereby eliminang the complexity of adding devices, applying playbooks, and so
on.
313
• A ‘running reference’ - if there is an issue with real devices, you can use a self-test instance to help
determine where the issue is; if the self-test instance is OK then the problem is not with the Paragon
Insights system.
Usage Notes
• Currently this feature supports simulang devices to stream data for OpenCong telemetry and
iAgent (NETCONF).
• You can retain the self-test instance to act as a ‘running reference’, as noted above.
• The color coding for the test results is as follows:
• Green = pass
• Yellow = error (unable to test)
• Red = fail
• Any items with yellow or red status will include a message with more detail about the issue.
• Do not use the self-test tool when there are undeployed changes, as the self-test tool issues its own
deploy during execuon.
• Do not use rules, playbooks, devices, device-groups or other elements created by the self-test tool
with real network devices.
How to Use the Self Test Tool
1. Navigate to the Administraon > Debug page from the le-nav panel, and select the APPLICATION
tab.
2. Select the desired sensor type(s) from drop-down menu.
3. Click the Test buon.
4. Aer a few moments, the test results appear.
314

The example above shows that both sensors are working as expected.
Device Reachability Test
Overview
In early versions of Paragon Insights, there was no way to easily determine whether the devices you
added were up and reachable; you would need to get through the enre setup procedure - add the
device, setup a device group, apply playbooks, monitor devices - at which point the health pages would
indicate “no data” indicang that the setup did not work correctly. Furthermore, “no data” does not
indicate whether the problem is a reachability issue or data streaming issue.
Starng with HealthBot Release 2.1.0, the device reachability tool can verify connecvity to a device.
The tool performs tests using ping and SSH. Paragon Insights uses the device’s IP address or host name,
based on what was congured when adding the device.
Usage Notes
• While this feature is generally intended to help troubleshoot device onboarding, you can use it any
me to check device reachability.
• The color coding for the test results is as follows:
• Green = pass
• Yellow = error (unable to test)
315

• Red = fail
• Any items with yellow or red status will include a message with more detail about the issue.
How to Use the Device Reachability Tool
1. To access the tool:
• Navigate to the Administraon > Debug page from the le-nav panel, and select the
REACHABILITY tab.
• Or, on the Dashboard page click the desired device in the device list widget, and in the pop-up
window click the REACHABILITY TEST buon.
NOTE: The REACHABILITY TEST buon does not appear when rst adding the device.
2. In the Device Reachability tool, select the desired device from drop-down menu.
3. Click the Test buon.
4. Aer a few moments, the test results appear.
The example above shows that the ping test was successful, but the SSH test failed.
316

Ingest Connecvity Test
Overview
In early versions of Paragon Insights, there was no way to easily determine which ingest methods were
supported for a given device; you also had no way to know whether the congured ingest method
successfully established a connecon with the network device.
Starng with HealthBot Release 2.1.0, the ingest connecvity tool can verify ingest methods where
Paragon Insights iniates the connecon, such as OpenCong, iAgent, and SNMP. Paragon Insights does
not test UDP-based ingest methods, such as syslog and Nave GPB, as the UDP parameters are
common to a device group and not specic to a device.
Paragon Insights validates each supported ingest method in its own way:
• OpenCong: Establishes a gRPC connecon with the device using its IP/host name, gRPC port, and
credenals
• iAgent: Establishes a NETCONF session with the device using its IP/host name, NETCONF port, and
credenals
• SNMP: Executes a simple SNMP GET command; expects to get a reply from the device
This tool provides mulple benets:
• It helps to idenfy when there might be missing conguraon on the network device side.
• It helps you choose appropriate playbooks and rules that use sensors compable with the supported
ingest methods.
• It helps to idenfy ingest connecvity issues early on, rather than troubleshoot the “no-data” issue
described in the previous secon.
Usage Notes
• While this feature is generally intended to help troubleshoot device onboarding, you can use it any
me to check ingest connecvity.
• The color coding for the test results is as follows:
• Green = pass
• Yellow = error (unable to test)
• Red = fail
• Any items with yellow or red status will include a message with more detail about the issue.
317

How to Use the Ingest Connecvity Tool
1. To access the tool:
• Navigate to the Administraon > Debug page from the le-nav panel, and click the INGEST tab.
• Or, on the Dashboard page click the desired device in the device list widget, and in the pop-up
window click the INGEST TEST buon.
NOTE: The Ingest Test buon does not appear when rst adding the device.
2. In the Ingest Connecvity tool, select the desired device from drop-down menu
3. Click the Test buon.
4. Aer a few moments, the test results appear.
The example above shows that iAgent is supported, OpenCong is not supported, and SNMP
encountered an error.
318

Debug No-Data
Overview
One of the most common problems that a Paragon Insights users face is “How to debug no-data?”.
Determining the root cause is challenging as the issue can occur for a variety of reasons, including:
• Device not reachable
• Device not sending data
• Firewall blocking connecons
• Ingest connecvity sengs mismatch
• Rule frequency/trigger interval is congured less than the router response me
• Paragon Insights services not running
In early versions of Paragon Insights, you needed to manually look for the problem, checking add-device
parameters, reviewing logs, checking the device conguraon, and so on.
Starng with HealthBot Release 2.1.0, the debug no-data tool helps to determine why a device or rule is
showing a status of “no-data”. The tool takes a sequenal, step-by-step approach to determine at which
stage incoming data is geng dropped or blocked, as follows:
• Paragon Insights Services
• Verify that all common and device group-related services are up and running
• Device Reachability
• Test connecvity to device using ping and SSH
• Ingest Connecvity
• Verify that the congured ingest session is established
• Raw Data Streaming
• Verify whether the ingest is receiving any raw data from the devices
• Likely to be OK if device connecvity is OK
• Field Processing
• Within rules, verify that the elds working properly, and that the eld informaon is populated in
the database
319

• Trigger Processing
• Within rules, verify that the trigger sengs working as intended, and status informaon is
populated in the database
• API Vericaon
• Check for API meouts that might be aecng the GUI
Usage Notes
• The tool runs through the enre sequence of checks, regardless of any issues along the way.
• The test results provide root cause informaon and advise where to focus your troubleshoong
eorts.
• While this feature is generally intended to debug a device when it is marked as no-data, you can use
it any me to verify that deployed rules are receiving data.
• This tool does not support rules using a syslog sensor, as the sensor data is event driven and not
periodic.
• The color coding for the test results is as follows:
• Green = pass
• Yellow = error (unable to test)
• Red = fail
• Any items with yellow or red status will include a message with more detail about the issue.
How to Use the Debug No-Data Tool
1. To access the tool:
• On any device health page, click a “no data” le.
• Or, navigate to the Administraon > Debug page from the le-nav panel, and select the NO
DATA tab.
320

2. In the Debug No-Data tool, select the desired device group, device, and one or more rules from the
drop-down menu
3. Click the Debug buon.
4. Aer a few moments, the test results appear.
The example above shows that one common services is not working properly.
Paragon Insights Conguraon – Backup and
Restore
IN THIS SECTION
Back Up the Conguraon | 322
Restore the Conguraon | 322
Backup or Restore the Time Series Database (TSDB) | 323
321

Back Up the Conguraon
To back up the current Paragon Insights (formerly HealthBot) conguraon:
1. Select the Administraon > Backup opon from the le-nav bar.
2. Check the check box for the conguraon that you want to backup.
If you also want to back up any conguraon changes that have not yet been deployed, toggle the
Backup Undeployed Conguraon switch to the right.
3. Click Backup.
Back Up Helper Files
Helper les are the python, yaml, or other externally created les whose tables are referenced in iAgent
sensor denions within rule denions.
1. Select the Administraon > Backup opon from the le-nav bar.
2. Click the BACKUP HELPER FILE buon.
Paragon Insights creates a tar archive that you can save to your computer.
Restore the Conguraon
To restore the Paragon Insights conguraon to a previously backed up conguraon:
1. Select the Administraon > Restore opon from the le-nav bar.
2. Click the Choose File buon.
3. Navigate to the backup le from which you want to restore the conguraon, and click Open.
Once opened, a list of backup conguraon secons appears as buons under Select the
conguraon backup le heading. By default, all conguraon elements in the selected backup le
are selected to restore.
4. (Oponal) From the list of buons, you can deselect (change the “-” to “+”) individual les from
restoring by clicking on the buon.
5. Click RESTORE CONFIGURATION & DEPLOY to restore and deploy the conguraon.
Restore Helper File
To restore previously backed up helper le archives:
1. Select the Administraon > Restore opon from the le-nav bar.
2. Click the Choose File buon directly above the second line, “Select the helper backup le”.
322

3. Locate the backed up helper le in the le browser and click Open.
4. Click the RESTORE CONFIGURATION buon to restore the helper les to Paragon Insights, or the
RESTORE CONFIGURATION & DEPLOY buon to restore the helper les to their original locaon
within Paragon Insights.
Backup or Restore the Time Series Database (TSDB)
Starng with HealthBot Release 3.2.0, you can backup and restore the TSDB separately from other
conguraon elements. The backup and restore operaons for the TSDB are only available through the
Paragon Insights CLI. The backup and restore commands are invoked by using a predened python
script, healthbot.py. You must have root access to the CLI interface of the Paragon Insights server in order
to issue these commands.
Use the following command to set the environment variable:
export HB_EXTRA_MOUNT1=/root/.kube/config
HB_EXTRA_MOUNT1
is a variable and user dened.
The generic command and the oponal arguments (in square brackets) for performing backup and
restore is described here with examples.
healthbot tsdb (backup|restore) [-h] [--database DATABASE] [--all] --path PATH
The required arguments for the healthbot tsdb command are:
• backup–perfom a backup operaon
• restore–perform a restore operaon
• --path PATH–create the backup le or restore the database(s) from the container at PATH where PATH is
HB_EXTRA_MOUNT1.
• Starng with Paragon Insights Release 4.0.0, you can use the following commands.
•
healthbot tsdb stop-services —stop service
• healthbot tsdb start-services --port <portnumber>—start service
323

NOTE: In Paragon Insights, the TSDB port is exposed by default. If you need to shut the
TSDB port down for security reasons, you can use the healthbot tsdb stop-services command.
External API queries to TSDB do not need the TSDB port to be exposed. However, if you use
external tools such as Grafana, or you need run a query to the TSDB directly (and not through
APIs), the TSDB port must be exposed.
Oponal Arguments
-h, --help show this help message and exit
--database DATABASE Takes backup (or restore) of the given list of databases. Either
database or all flag must be configured
--all Takes backup (or restores) of all the databases. Either database or
all flag must be configured
Example – Backup the TSDB and Store it in HB_EXTRA_MOUNT3
healthbot tsdb backup --path HB_EXTRA_MOUNT3
Example – Restore the TSDB from HB_EXTRA_MOUNT2
healthbot tsdb restore --path HB_EXTRA_MOUNT2
Change History Table
Feature support is determined by the plaorm and release you are using. Use Feature Explorer to
determine if a feature is supported on your plaorm.
Release
Descripon
3.2.0 Starng with HealthBot Release 3.2.0, you can backup and restore the TSDB separately from other
conguraon elements
324


Paragon Insights Licensing Overview
Juniper Networks introduced the Juniper Flex Soware Subscripon Licensing model to provide an
ecient way for you to manage licenses for hardware and soware features. Paragon Insights uses this
licensing model. For more informaon, see Paragon Insights Licensing topic in the Licensing Guide.
You need a license to acvate the Paragon Insights graphical user interface (GUI). When you log in to the
Paragon Insights GUI for the rst me, the License Management page appears. Depending on the type
of license you add, you will have access to advanced, or standard features of Paragon Insights.
For more informaon on managing licenses from the Paragon Insights GUI, see "View, Add, or Delete
Paragon Insights Licenses" on page 326.
View, Add, or Delete Paragon Insights Licenses
IN THIS SECTION
Add a Paragon Insights License | 327
Delete a Paragon Insights License | 328
View Paragon Insights Licensing Features | 328
View Status and Details of Paragon Insights License | 329
NOTE: For detailed informaon on licensing, see the Paragon Insights Licensing topic in the
Licensing Guide.
Starng with Paragon Insights Release 4.3.0, when you navigate to the License Management page, a
warning message asking you to add a er-based license or upgrade to the new license key format might
be displayed.
• If no licenses are added, you must obtain a license key from the Juniper Agile Licensing Portal and
add it to the License Management page.
• If licenses are added but the license key format is not compable with the Paragon Insights soware
version that you are currently using, you must generate a new license key.
326

To generate a new license key in the compable format:
1. Login to Juniper Agile Licensing Portal.
2. Revoke the exisng license.
A new license key is generated.
NOTE: Aer you download the newly generated license key le, you must remove eight
lines starng from Issue Date through License Key from the le.
3. Acvate the new license key that is compable with the soware version you’re running. Select
the soware version during the acvaon process. For more informaon, see the FAQ secon in
the Juniper Agile Licensing Portal.
4. Add the new license key to the License Management page. See "Add a Paragon Insights License"
on page 327.
Aer you have obtained a Paragon Insights license through the Juniper Agile Licensing Portal, you can
manage your licenses from the Paragon Insights graphical user interface (GUI).
The Sengs>License Management page enables you to:
Add a Paragon Insights License
To add a Paragon Insights license:
1. Navigate to Sengs > License Management page.
The License Management page appears.
2. Click the plus (+) icon in the Licenses Added secon to add a new license.
The Add License pop-up appears.
3. Click Browse and navigate to the locaon of the license le that you want to add.
Select the le and then click Open.
4. The license le is now added to the Add License page.
5. Click Ok to conrm.
The license you added is now listed in the Licenses Added secon of the License Management page.
327

Delete a Paragon Insights License
To delete and exisng Paragon Insights license:
1. Navigate to Sengs>License Management page.
The License Management page is displayed.
2. From the Licenses Added secon, click the opon buon (available in beginning the row) of the
license you want to delete, and then click Delete.
The Conrm Delete page appears.
3. Click Yes to delete the license.
View Paragon Insights Licensing Features
To view Paragon Insights licensing features, navigate to Sengs > License Management page.
The Features Summary secon, as given in Table 23 on page 328 provides informaon on the Paragon
Insights feature licensing aributes.
Table 23: Feature License
Aributes
Aribute Descripon
Feature View Paragon Insights license name.
Descripon Brief descripon of the Paragon Insights feature license.
License Limit The number of valid Paragon Insights licenses successfully added and available for use.
NOTE: Starng in Paragon Insights Release 4.3.0, irrespecve of the number of PIN-Advanced,
and PIN-Standard plaorm licenses that you add, the maximum license limit is 1. However, with
PIN-Devices licenses, the limit changes with the number of licenses that you add.
Usage Count The number of available licenses that are currently in use in this instance of Paragon Insights.
Valid Unl Date and me when the license expires.
328

Table 23: Feature License Aributes
(Connued)
Aribute Descripon
Compliance Color denions (dot indicator) that determine license compliance:
• Green—Feature licenses are in compliance with Juniper's End User License Agreement.
• Yellow—Device feature licenses are >= 90% of the limit. You are geng close to running out
of licenses. This status applies only to device feature licenses.
• Red—Feature licenses are not in compliance with Juniper's End User License Agreement. Click
the red dot to view details about the compliance issue.
View Status and Details of Paragon Insights License
To view status and details of a Paragon Insights license, navigate to Sengs > License Management
page. The Licenses Added secon provides informaon on the added Paragon Insights licenses. You can
also click the opon buon (available in beginning the row) of the license you want to view, and then
click More > Details to view more informaon about the license.
Table 24: View Details of Licenses Added
Aribute Descripon
License ID View the Paragon Insights license idencaon number generated through the Juniper
Agile Licensing Portal.
SKU Name View the Paragon Insights soware licensing package name.
NOTE: In Paragon Insights Release 4.3.0, SKU Name is not available in the Added License
secon of the License Management page. This is because the new license key format does
not support SKU Name.
Customer ID View the customer idencaon.
NOTE: The customer ID might not be displayed aer you add a license. This is because the
customer ID is not embedded in the new license key format.
329

Table 24: View Details of Licenses Added
(Connued)
Aribute Descripon
Order Type View the order type (commercial, demo, educaon, emergency, lab, and unknown).
Validity Type View the validity type of a license (date-based or permanent).
Start Date View the start date of the Paragon Insights license.
End Date View the end date of the Paragon Insights license.
State Displays the state of the license.
Feature ID View the feature license idencaon number.
Feature Name View the Paragon Insights feature license name.
Feature Descripon View a brief descripon of the Paragon Insights feature license.
License Count View the entled license count for this Paragon Insights feature.
RELATED DOCUMENTATION
Paragon Insights Licensing Overview | 326
330
