
Perez, Avi
Article
Lack of uniformity in the Israeli property tax system
1997-2017
Journal of Risk and Financial Management
Provided in Cooperation with:
MDPI – Multidisciplinary Digital Publishing Institute, Basel
Suggested Citation: Perez, Avi (2020) : Lack of uniformity in the Israeli property tax system 1997-2017,
Journal of Risk and Financial Management, ISSN 1911-8074, MDPI, Basel, Vol. 13, Iss. 12, pp. 1-11,
https://doi.org/10.3390/jrfm13120327
This Version is available at:
https://hdl.handle.net/10419/239413
Standard-Nutzungsbedingungen:
Die Dokumente auf EconStor dürfen zu eigenen wissenschaftlichen
Zwecken und zum Privatgebrauch gespeichert und kopiert werden.
Sie dürfen die Dokumente nicht für öffentliche oder kommerzielle
Zwecke vervielfältigen, öffentlich ausstellen, öffentlich zugänglich
machen, vertreiben oder anderweitig nutzen.
Sofern die Verfasser die Dokumente unter Open-Content-Lizenzen
(insbesondere CC-Lizenzen) zur Verfügung gestellt haben sollten,
gelten abweichend von diesen Nutzungsbedingungen die in der dort
genannten Lizenz gewährten Nutzungsrechte.
Terms of use:
Documents in EconStor may be saved and copied for your personal
and scholarly purposes.
You are not to copy documents for public or commercial purposes, to
exhibit the documents publicly, to make them publicly available on the
internet, or to distribute or otherwise use the documents in public.
If the documents have been made available under an Open Content
Licence (especially Creative Commons Licences), you may exercise
further usage rights as specified in the indicated licence.
https://creativecommons.org/licenses/by/4.0/

Journal of
Risk and Financial
Management
Article
Lack of Uniformity in the Israeli Property Tax
System 1997–2017
Avi Perez
Pozna´n University of Economics and Business, 61-875 Pozna´n, Poland; [email protected]
Received: 21 October 2020; Accepted: 16 December 2020; Published: 21 December 2020
Abstract:
There are two different forms of property tax systems: value-based tax, which is used in
most countries of the world, and area-based tax, which is used mainly in Central and Eastern Europe
and developing countries in Africa. Area-based property tax provides more stable and predictable
budget revenues. It is simpler to administer and scores worse on equity grounds from the perspective
of the ability-to-pay principle of taxation. Against this background, Israel’s property tax system,
known as Arnona, is complex, spatially diversified, and causes a lack of uniformity that leads to
tax distortion. This paper’s primary purpose is to identify the weaknesses of Israeli property tax
from 1997 to 2017 and indicate how to improve the property tax system. This paper is based on case
studies from four of the most important cities in Israel: Tel Aviv, Jerusalem, Haifa, and Beersheba,
which have four different measurement methods for calculating property tax. Unique data were
collected from the Israel Central Bureau of Statistics. According to this analysis, it was found that
there are substantial differences in property tax between the four cities over the two decades analyzed.
The main weakness is the lack of uniformity of the taxation system; the solution is to unify the
measurement of real estate area for tax purposes using drone technology.
Keywords: property tax; Israel; information and communication technology
1. Introduction
Throughout the world, central governments are seeking better property tax systems than the
systems that currently fund local authorities’ activities. Moreover, many countries have been advised
to increase and improve their property tax systems. It has been characterized as the “tax everyone
loves to hate” (Rosengard 2013). Slack and Bird (2014) indicate that governments have to deal with
four aspects of property tax policy: setting the tax base, assessing properties, setting property tax rates,
and administering the property tax system.
There are two common assessment methodologies used for valuing property: area-based assessments
and value-based assessments.
Generally, property tax belongs to the field of studies related to property spheres (Lis 2012).
Property tax in Israel is called the Arnona tax (Arnona or the general property tax) and is imposed on
the holder of a property according to the local authority’s rates at the beginning of the year following
the central government’s directives published in the local council decree (Darin 1999). In Israel, there
are 261 municipalities, which include cities, local councils, and regional councils. This paper aims to
identify the weaknesses of Israeli property tax from 1997 to 2017, as well as indicate how to improve
the property tax system.
The local authority sets tax rates to decree once a year. However, the authority is subject to
minimum and maximum limits, and the annual local rate increases according to the central government’s
rates. The authority sends the tax assessment to the actual holder of a given property (residential,
commercial, agricultural land, and occupied land). The tax calculation is done by multiplying the
J. Risk Financial Manag. 2020, 13, 327; doi:10.3390/jrfm13120327 www.mdpi.com/journal/jrfm
J. Risk Financial Manag. 2020, 13, 327 2 of 11
property area rate, while taking into account three main criteria: the type of property, its area (in square
meters), and the area in which the property is located.
A property tax assessment contains the following seven elements: the property’s identity, the area
of the property, the use made of the property, the classification of the property, premises, and exemptions,
and the amount of tax levied (Rostowicz 2001). These elements determine the tax burden in Israel.
Property tax is due every two months, though it can be paid once a year. Interest payments are subject
to interest and linkage differences according to Section 4 of the Local Authorities Law (Interest and
Linkage Differences on Compulsory Payments), 1980. The four cities in the sample adopted different
measurement methods. Moreover, the appraiser’s reliance on four different methods causes a lack
of uniformity in measuring the authorities’ properties, which can impact revenue and the quality of
municipality services.
The lack of uniformity in measuring properties created inequalities in the property tax burden,
forcing people to relocate to other cities where the property tax is lower (Dalevska et al. 2019). Therefore,
setting a uniform method of measurement and a uniform property tax rate for residential properties in
the different cities creates appropriate equality (Popescu 2019).
There are four methods for measuring property areas described in the local property tax levy
orders published each year in Israel. The four methods are as follows:
1.
Net Area: the area of an apartment, including the area under the inner and outer walls,
not including balconies. In the case of walls shared with another apartment, each apartment
extends halfway (utilized in Haifa);
2.
Gross Area: the entire apartment area, together with the apartment’s proportion in the stairwell.
The relative area determines the stairwell’s closed area compared to all the apartments in the
building (utilized in Beersheva);
3.
Net–Net method: the area of an apartment (floor), including covered balconies, but it does not
include the area outside the exterior walls, such as open balconies and areas lower than the
minimum ceiling height (utilized in Tel Aviv); and
4.
Gross–Gross Method: the gross size in addition to all possible extras, such as parking, warehouses,
the relative part of an apartment on the roof and in the stairwell, and more (utilized in Jerusalem).
There is also a clear distinction between residential property tax and tax for non-residential
properties (e.g., commercial properties). In many parts of Israel, residential property tax is significantly
higher than non-residential property tax. In light of the gradual decline in central government
assistance budgets (balancing grants), the authorities have been forced to develop a business center to
increase property tax revenue rather than invest in developing residents’ neighborhoods.
Most countries of the world utilize property tax for municipal expenses. The justification for
using property taxation as a kind of wealth can serve to “signal” a burden of public finance liability
(Hale 1985). A new form of capital requires more sophistication from the taxing authorities in terms of
tracing, assessing, and taxing (Youngman and Malme 2004).
Creating municipal taxes starts from the government, working through the local authority to the
taxpayer who bears the tax burden. The relationship between all parties is complex. The government
tries to reduce annual aid to the local authorities. The local authorities ask for more independence
and freedom to make decisions regarding policy management and tax collection. Hence, the main
theoretical problem is to create a tax system that can balance both local and national interests related to
the market and the economy (Christensen et al. 2016). The relationship between the municipality and
residents is complicated. From the municipality’s perspective, there is a permanent and systematic
desire to deepen the collection process by changing the classifications of assets or properties’ valuations.
The residents wish to pay as little tax as possible, which they express during elections.
Although the municipal tax is perceived as a “hated” tax and is not popular among taxpayers,
economists still regard it as an appropriate income source for the authorities (Bird and Slack 2006).
Municipal tax is highly influential, both fiscally and non-fiscally. There are generally two commonly
J. Risk Financial Manag. 2020, 13, 327 3 of 11
methods of calculating property tax: area-based and value-based. The first approach calculates property
tax by area and is prevalent in countries where the real estate market is not sufficiently developed, such as
certain countries belonging to the former Soviet bloc, countries such as Romania, Hungary, Poland,
Israel, and even certain countries in Africa and Asia (Głuszak 2015). The second approach is based
on value-based estimation, which is more common in developed countries, such as the UK, France,
Germany, Canada, the USA, Japan, Finland, and Denmark. It calculates the property tax using the
property’s value, which includes land and buildings. Every one to five years, a tax appraiser values
the property and sets an appropriate rate on the owner using the municipality (Chambers et al. 2009).
Each approach has advantages and disadvantages. This paper mainly focuses on understanding the
property tax on area-based residential properties, especially in the property’s assessment context.
This understanding can help analyze the municipal tax’s effect on the residential market, an asset that
concerns all property residents. Hence, understanding the relationship between housing markets and
the urban economy through the property tax system is crucial to creating a better economic system.
Several researchers believe that property tax empowers local governments to stay in local
governments (Connolly and Bell 2009). It is essential to prevent heavy transfer dependency, imposing
hard budget constraints, and ensuring adequate resource handling to provide public services the
local governments are mandated to provide. Hence, there is a strong connection between revenue
and expenditure, verifying transparency, and enabling taxpayers to force governments to deliver
public services commensurate with tax payments. Thus, according to the main guidelines of fiscal
federalism, local services, by and large, should be paid for by the beneficiaries, who are the residents
(Connolly and Bell 2010).
The two approaches of calculating property tax according to the area and the property’s value
are subject to structural distortions stemming from evaluating the property. These distortions exist in
almost all countries and create inequality and inefficiency in the tax burden. These countries produce
“adjustments” to balance inequality and improve efficiency. These criteria are of great social and
economic importance. There is enormous research that analyzes property tax computation according
to the area and its value from various aspects. There is no uniformity among researchers regarding the
question of which method is the best.
The municipalities’ reliance on property tax has both strengths and weaknesses. As argued by
Mieszkowski and Zodrow (1989) and more recently by Zodrow (2001) in their comprehensive surveys
of the property tax literature, property tax seems likely to have a somewhat progressive impact on the
distribution of income, and it may also have relatively small distortive effects. However, it is also clear
who must pay property tax, making property tax a more stable revenue (Oates 2001). The activity
and innovations of the municipalities and their development are essential components of each city’s
economy (Kwilinski et al. 2019).
Indeed, property tax has often been portrayed as an unpopular, hard-to-administer, and inelastic
tax. However, this last feature, in particular, has proven to be an essential advantage in the recent
recession. The authorities need the property tax rather than elastic sources of revenue such as income,
sales, and excise taxes, which have, so far, in any event, helped the authorities to prevent some of the
more severe problems experienced by individual governments in the current economic situation.
Given its administration’s institutional realities, it may take several assessment cycles (e.g., years)
before changes in a property’s market values are accurately reflected in assessed values and, ultimately,
in property tax collections. Moreover, property tax is regarded as a fair tax for local governments
because it is immovable. It is unable to change location in response to the tax, and it is visible. Even the
owner of a vacant property pays property tax. It is interesting to indicate that property tax has often
been regarded as the “most hated” tax (Brunori 2003). It is essential to note that property taxes have
not been withheld at source, and they finance evident services such as roads, policing, and garbage
collection. Visibility makes governments accountable for this type of tax, but it makes property tax
a challenge to sell politically and even more difficult to increase or reform relative to other taxes.

J. Risk Financial Manag. 2020, 13, 327 4 of 11
Its unpopularity stems from its potential volatility and unpredictability as a result of being based on
market value (Sheffrin 2010).
The contribution of this paper is to increase awareness about the need for a re-examination of the
two assessments of measuring assets. For many years, these assessments have not been technologically
renewed, even though it is known that they suffer from severe problems and lead to loss of revenue for
the local government.
2. Materials and Methods
In this study, four cities in Israel were used as case studies: Tel Aviv, Jerusalem, Haifa, and Beersheba.
The data were collected from the Israeli Central Bureau of Statistics. The information came from
archives and was manually managed by the author due to the lack of electronic records. This research
covers the period 1997–2017.
In this study, descriptive statistics were used, including the analysis of distribution, central
tendency, and variability of each value. Furthermore, analysis of variance (ANOVA, as shown in
Appendix A) was used. This statistical technique checks if the means of two or more groups are
significantly different from each other. Although ANOVA is a powerful parametric approach to
analyzing customarily distributed data with more than two groups, it does not provide any more
in-depth insights into patterns between specific groups. Additionally, Tukey’s test was applied as a
post hoc analysis to gather more information on the similarities and differences between the cities
under analysis.
In this study, the author evaluated the descriptive statistics of each city’s variables to examine
the primary objective. Each city represents a regional district, and therefore serves as the metropolis
of its district: Haifa in the northern district, Beersheba in the south, Tel Aviv in the central district,
and Jerusalem in the eastern district. The cities were chosen for the following reasons:
1.
Each city represents a different socioeconomic level: Tel Aviv—8 out of 10; Haifa—7 out of 10;
Beersheba—5 out of 10; and Jerusalem—2 out of 10;
2.
The composition and size of the population vary between these cities: in Jerusalem, there are
919,400 residents including the Arab minority; Haifa has 283,600 residents including the Arab
minority; Beersheba has a Bedouin minority and a total population of 209,000; Tel Aviv has an
Arab minority (who live in a city called Jaffa) and has a total of 451,500 residents; and
3.
The volume of residential property tax revenues for different cities, such as those presented in
Tables 1–5 and Figure 2, may indicate property tax distortion, so the selected cities provide a good
picture of trends when making a comparison.
Table 1. Descriptive statistics of the variables for the city of Tel Aviv.
Specification
Mean
(Sd)
Median Range
The average cost
per square meter
39.53
(5.79)
38.68 32.55–49.65
Residential property billing space
(in thousands of square meters)
14,130.94
(1471.33)
14,037.50 11,534.00–16,678.00
Revenue of residential property
(in thousands of NIS)
566,489.48
(141,451.38)
542,990.00 381,713–828,150
Number of inhabitants (in thousands)
389.78
(31.58)
390.10 347.20–443.90
Source: Own calculations based on Central Bureau of Statistics in Israel (CBS) data.

J. Risk Financial Manag. 2020, 13, 327 5 of 11
Table 2. Descriptive statistics of the variables for the city of Jerusalem.
Specification
Mean
(Sd)
Median Range
The average cost
per square meter
54.69
(13.51)
56.53 33.56–73.74
Residential property billing space
(in thousands of square meters)
14,428.03
(1869.63)
14,144.00 11,635.00–17,703.60
Revenue of residential property
(in thousands of NIS)
825,581.76
(300,156.44)
871,861.00 390,510.00–1,327,874.00
Number of inhabitants in
(the thousands)
751.90
(85.11)
747.60 627.80–910.30
Source: Own calculations based on CBS data.
Table 3. Descriptive statistics of the variables for the city of Haifa.
Specification
Mean
(Sd)
Median Range
The average cost
per square meter
52.87
(7.27)
52.46 38.15–64.25
Residential property billing space
(in thousands of square meters)
8980.48
(172.57)
9098.00 7618.00–10,179.00
Revenue of residential property
(in thousands of NIS)
479,762.57
(101,795.12)
478,278.00 290,663.00–654,068.00
Number of inhabitants in
(the thousands)
270.38
(5.13)
269.40 263.40–281.10
Source: Own calculations based on CBS data.
Table 4. Descriptive statistics of the variables for the city of Beersheba.
Specification
Mean
(Sd)
Median Range
The average cost per square meter
31.61
(8.33)
33.19 22.35–44.74
Residential property billing space
(in thousands of square meters)
6676.41
(803.31)
6782.40 5317.40–7938.40
Revenue of residential property
(in thousands of NIS)
217,116.43
(81,284.02)
225,110.00 126,818.00–355,196.00
Number of inhabitants in
(the thousands)
187.50
(13.45)
186.10 160.60–207.60
Source: Own calculations based on CBS data.
Table 5. Residential revenue property tax (NIS thousands) between 1997 and 2017.
City 1997 2017 Change
Tel Aviv 381,713 828,150 116.95%
Jerusalem 390,510 1,327,870 240.03%
Haifa 290,663 654,068 225%
Beersheba 126,818 355,196 180%
Source: Own calculations based on CBS data.

J. Risk Financial Manag. 2020, 13, 327 6 of 11
3. Results
For the empirical analysis, several statistical tests were conducted on each city separately; these
were then compared between cities (Figure 1). The results of these statistical tests showed significant
differences between the four cities. For example, as presented in the descriptive statistics, the NIS
tax rate per square meter of housing in Jerusalem was 54.69 NIS, higher than the 39.53 NIS rate in
Tel Aviv. This result does not fit because Tel Aviv was ranked in Socioeconomic Cluster 8, while
Jerusalem was in Socioeconomic Cluster 2. An explanation for this finding is that Tel Aviv invested
more in developing business centers where the municipal tax revenue was significantly higher than
the residential income. On the other hand, business centers consume fewer services provided by the
authority. In Israel, the property tax burden on businesses is significantly higher than on residents,
even though they require more services such as schools, kindergartens, parks, and clubs.
J. Risk Financial Manag. 2020, 13, x FOR PEER REVIEW 6 of 11
differences between the four cities. For example, as presented in the descriptive statistics, the NIS tax
rate per square meter of housing in Jerusalem was 54.69 NIS, higher than the 39.53 NIS rate in Tel
Aviv. This result does not fit because Tel Aviv was ranked in Socioeconomic Cluster 8, while
Jerusalem was in Socioeconomic Cluster 2. An explanation for this finding is that Tel Aviv invested
more in developing business centers where the municipal tax revenue was significantly higher than
the residential income. On the other hand, business centers consume fewer services provided by the
authority. In Israel, the property tax burden on businesses is significantly higher than on residents,
even though they require more services such as schools, kindergartens, parks, and clubs.
Figure 1. The average cost per square meter (property tax rate) for residential property in 1997–2017.
Explanation: X-axis = timeline, Y-axis = average cost per square meter of residential property (Blue—
Tel Aviv; Orange—Jerusalem; Grey—Haifa; Yellow—Beersheba). Source: Own calculations based on
the Central Bureau of Statistics in Israel (CBS) data.
Interestingly, the average rate of property tax per square meter in residential housing in Tel Aviv
over the 20-year period was NIS 39.5 per square meter, while the average property tax rate in
Jerusalem was NIS 55.6 per square meter. This gap does not reflect the fact that Tel Aviv was in
Socioeconomic Cluster 8, while Jerusalem was in Socioeconomic Cluster 2, though it does show that
Tel Aviv based most of its revenue from property tax on business rather than housing. The average
property tax rate in Haifa over the 20-year period was 52.9 NIS per square meter and the city was
ranked in Socioeconomic Cluster 7, whereas the average property tax rate in Beersheba was NIS 31.6
per square meter and the city was in Socioeconomic Cluster 5 (Table 6).
Table 6. Property tax rate per square meter change between 1997 and 2017.
City Cluster 1997 2017 Change
Tel-Aviv 8 33.1 49.7 50%
Jerusalem 2 33.6 75 123%
Haifa 7 38.2 64.3 68.3%
Beersheba 5 23.8 44.7 87.8%
Source: Own calculations based on the CBS data.
Table 6 shows the significant differences between residential property tax rates per square meter
between the cities, which are not in accordance with the clusters in which the cities are ranked. For
example, in 2017, Tel Aviv was in cluster 8, but the property tax rate (49.7 NIS) was less than
Jerusalem’s, which is was in cluster 2 (75 NIS). These differences in the property tax rate and the fact
that each city adopted different measurement methods create significant differences between cities.
These differences have an impact on residents’ decisions, as well as property tax revenues.
3.1. The Case of Tel Aviv
0
20
40
60
80
Tel Aviv Jerusalem Haifa Beer Sheba
Figure 1.
The average cost per square meter (property tax rate) for residential property in 1997–2017.
Explanation: X-axis = timeline, Y-axis = average cost per square meter of residential property (Blue—Tel
Aviv; Orange—Jerusalem; Grey—Haifa; Yellow—Beersheba). Source: Own calculations based on the
Central Bureau of Statistics in Israel (CBS) data.
Interestingly, the average rate of property tax per square meter in residential housing in Tel Aviv
over the 20-year period was NIS 39.5 per square meter, while the average property tax rate in Jerusalem
was NIS 55.6 per square meter. This gap does not reflect the fact that Tel Aviv was in Socioeconomic
Cluster 8, while Jerusalem was in Socioeconomic Cluster 2, though it does show that Tel Aviv based
most of its revenue from property tax on business rather than housing. The average property tax rate in
Haifa over the 20-year period was 52.9 NIS per square meter and the city was ranked in Socioeconomic
Cluster 7, whereas the average property tax rate in Beersheba was NIS 31.6 per square meter and the
city was in Socioeconomic Cluster 5 (Table 6).
Table 6. Property tax rate per square meter change between 1997 and 2017.
City Cluster 1997 2017 Change
Tel-Aviv 8 33.1 49.7 50%
Jerusalem 2 33.6 75 123%
Haifa 7 38.2 64.3 68.3%
Beersheba 5 23.8 44.7 87.8%
Source: Own calculations based on the CBS data.
Table 6 shows the significant differences between residential property tax rates per square meter
between the cities, which are not in accordance with the clusters in which the cities are ranked.
For example, in 2017, Tel Aviv was in cluster 8, but the property tax rate (49.7 NIS) was less than
Jerusalem’s, which is was in cluster 2 (75 NIS). These differences in the property tax rate and the fact
that each city adopted different measurement methods create significant differences between cities.
These differences have an impact on residents’ decisions, as well as property tax revenues.
J. Risk Financial Manag. 2020, 13, 327 7 of 11
3.1. The Case of Tel Aviv
Tel Aviv is the second-largest city in Israel and is the economic and technological center of the
country. It is ranked 25th in the Index of Global Business Centers. Tel Aviv has the fourth-largest
economy in the Middle East, a population of 451,500, and is spread over a land area of 52,000 dunams
(52 km
2
; 20 sq mi). Tel Aviv is Israel’s most important business center (data from the Central Bureau of
Statistics in Israel).
While the tax rate rose by 50% over the 20-year period (Table 6), this is a relatively moderate
increase. This increase may be due to the Tel Aviv municipality’s policy to invest less in residential real
estate and more in real estate development for businesses, where municipal property tax revenues
are higher and require fewer municipal services. The property tax rate for residences in Tel Aviv was
lower than in the other cities, because in Tel Aviv, there are more business centers and the revenues
from them are significantly higher than in the other cities in the sample. The average municipal tax
rate was NIS 39.53 per square meter of residential area. Although Tel Aviv was ranked 8 out of 10
in the socioeconomic section, this low municipal tax rate does not reflect its status as an important
city in Israel. Moreover, this fact demonstrates the inequality in the property tax rate among the four
sample cities.
In Tel Aviv, property tax revenues only doubled over the 20-year period, while in the other cities
in the sample, they increased three and four times. Therefore, the question is whether the Tel Aviv
municipality provided high-quality residential municipal services. According to the data presented in
this paper, it appears that the Tel Aviv municipality was losing a great deal of revenue, and the method
of measuring residential properties was at least partly to blame.
The technological method proposed in this paper is intended to increase and optimize the
measuring of assets and, consequently, increase property tax revenues. Thus, Tel Aviv will be able to
provide higher quality municipal service.
3.2. The Case of Jerusalem
Jerusalem is the largest city in Israel. It is also the capital city of Israel and the most populated city.
The population of Jerusalem is 919,400 residents, including Jews (60.8%), Muslims (36.2%), Christians
(1.8%), and unclassified residents (1.2%) (based on Central Bureau of Statistics in Israel (CBS) data).
The average property tax rate rose by 123% over the two decades. Jerusalem was ranked in Level
2 out of 10 on the socioeconomic scale. Although Jerusalem’s status was low, the average property tax
rate was NIS 54.69 per square meter of housing. Such a high rate is reflected in a 240% increase in
income over the two decades. However, unlike the other cities in the sample, Jerusalem experienced
significant declines in 2014, most likely related to the war in Gaza and the associated political insecurity.
In 2015, property tax revenue began to grow again, as shown in Figure 1.
3.3. The Case of Haifa
Haifa is the third-largest city in Israel with a population of 283,600. The main seaport is located on
Israel’s Mediterranean coastline in the Bay of Haifa, covering 63.7 square kilometers (24.6 sq. mi). Haifa
consists of 103,000 households. Moreover, 25% of Haifa’s population is made up of immigrants from
the former Soviet Union. Arabs constitute 10% of Haifa’s population; Haifa has commonly promoted a
co-existence model between the Arabs and Jews. Haifa was ranked 7 out of 10 on the socioeconomic
scale (based on data from the Central Bureau of Statistics in Israel (CBS)).
The property tax rate increased by an average of 68.2% over the two decades in this study.
The average property tax rate was NIS 54.69 per square meter of housing. The high property tax rate is
reflected in an average increase in revenues of 125% over the two decades. Although the property tax rate
was relatively high and similar to that of Jerusalem, the volume of residential revenue did not increase
dramatically, and it appears that there was a decrease in revenues as a result of asset measurement.
J. Risk Financial Manag. 2020, 13, 327 8 of 11
3.4. The Case of Beersheba
Beersheba is one of the fastest-growing cities in Israel. It has a population of about 209,000 and
is the largest hub in southern Israel. Beersheba is the second-largest city (after Jerusalem), with a
total area of 117,500 dunams. The Council for Planning and Construction approved a plan to increase
the metropolitan population area to 1 million by 2030. Beersheba has a population of 20,000 Arabs,
which represents about 10% of the population, and is ranked fifth in the socioeconomic scale (based on
data from the Central Bureau of Statistics in Israel (CBS)).
Over the 20-year period, the property tax rate increased by 87%. Compared to the other three cities,
Beersheba had the lowest property tax rate, averaging NIS 31.61 per square meter of residential property.
The central government helped Beersheba with financial grants by absorbing many immigrants from
the Soviet Union and new immigrants from Ethiopia.
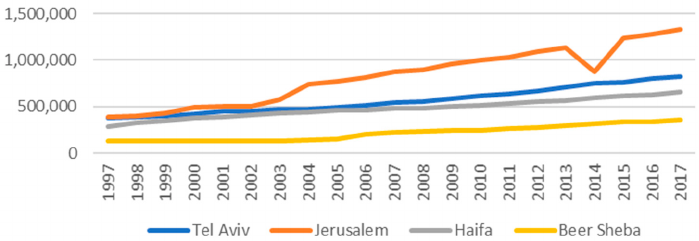
3.5. Property Tax Revenue in the Four Cities
The property tax revenue was obtained by multiplying the residential property area’s tax rate,
but the problem in Israel is that there is no uniform method for measuring property area. There are
four measurement methods for the four cities, as Table 5 and Figure 2 illustrate, and thus there was
a significant difference in revenue among the cities over the 20-year period. However, in each city,
it can be seen that total revenues over the period were moderate. Of course, low property tax revenues
result in a decrease in municipal services. In the author’s opinion, a dramatic reduction in property tax
revenue compared to the growing expenses created the municipalities’ crisis, which began in 1995
in Israel.
J. Risk Financial Manag. 2020, 13, x FOR PEER REVIEW 8 of 11
3.4. The Case of Beersheba
Beersheba is one of the fastest-growing cities in Israel. It has a population of about 209,000 and
is the largest hub in southern Israel. Beersheba is the second-largest city (after Jerusalem), with a total
area of 117,500 dunams. The Council for Planning and Construction approved a plan to increase the
metropolitan population area to 1 million by 2030. Beersheba has a population of 20,000 Arabs, which
represents about 10% of the population, and is ranked fifth in the socioeconomic scale
(based on data
from the Central Bureau of Statistics in Israel (CBS)).
Over the 20-year period, the property tax rate increased by 87%. Compared to the other three
cities, Beersheba had the lowest property tax rate, averaging NIS 31.61 per square meter of residential
property. The central government helped Beersheba with financial grants by absorbing many
immigrants from the Soviet Union and new immigrants from Ethiopia.
3.5. Property Tax Revenue in the Four Cities
The property tax revenue was obtained by multiplying the residential property area’s tax rate,
but the problem in Israel is that there is no uniform method for measuring property area. There are
four measurement methods for the four cities, as Table 5 and Figure 2 illustrate, and thus there was
a significant difference in revenue among the cities over the 20-year period. However, in each city, it
can be seen that total revenues over the period were moderate. Of course, low property tax revenues
result in a decrease in municipal services. In the author’s opinion, a dramatic reduction in property
tax revenue compared to the growing expenses created the municipalities’ crisis, which began in 1995
in Israel.
Figure 2. Revenues—residential property tax (NIS, thousands).
4. Discussion and Conclusions
As can be seen from analyzing the results obtained in this paper, there is no uniform cost per
square meter for residential property tax rates in Israel (property tax revenues divided by total
residential square meters), which creates severe problems that need to be addressed by the
government. The lack of uniformity of these measurement methods creates tax distortions. Figure 2,
in combination with Table 5, shows the differences in the average income received from property tax
over the 20-year period. The reason for this, in the author’s opinion, is the lack of uniformity in the
measurement of residential properties.
Property tax has a significant influence on local government revenues and is unique since it is a
tax levied on residential properties, combining taxation on property and consumption
simultaneously. On the one hand, a residential property is a means of creating residential services,
and on the other hand, it is a capital gain.
This paper offers one uniform method for all Israeli cities in which properties are measured
using a drone equipped with a sophisticated camera with a GPS navigation system. The data obtained
from the drone are then transferred online to computers with detailed geographic maps of all
residential properties installed in the city’s jurisdiction. Thereafter, computer software that can
combine the photos and the property’s size calculates the tax. The main component in this technology
Figure 2. Revenues—residential property tax (NIS, thousands).
4. Discussion and Conclusions
As can be seen from analyzing the results obtained in this paper, there is no uniform cost per square
meter for residential property tax rates in Israel (property tax revenues divided by total residential
square meters), which creates severe problems that need to be addressed by the government. The lack
of uniformity of these measurement methods creates tax distortions. Figure 2, in combination with
Table 5, shows the differences in the average income received from property tax over the 20-year
period. The reason for this, in the author’s opinion, is the lack of uniformity in the measurement of
residential properties.
Property tax has a significant influence on local government revenues and is unique since it is a
tax levied on residential properties, combining taxation on property and consumption simultaneously.
On the one hand, a residential property is a means of creating residential services, and on the other
hand, it is a capital gain.
This paper offers one uniform method for all Israeli cities in which properties are measured using
a drone equipped with a sophisticated camera with a GPS navigation system. The data obtained from
the drone are then transferred online to computers with detailed geographic maps of all residential
properties installed in the city’s jurisdiction. Thereafter, computer software that can combine the photos
and the property’s size calculates the tax. The main component in this technology is a photo of the

J. Risk Financial Manag. 2020, 13, 327 9 of 11
property taken from above, which allows us to check if there is any additional construction, without
the need for an appraiser, thus saving time and money. This technological advancement could help
eliminate the four standard measurement methods in Israel, leaving one uniform method. The exact
data obtained from the drone and the determination of a uniform residential property tax rate can help
to make the property tax system more objective. Furthermore, revenue will increase, time will be saved,
and the high monetary costs associated with employing a real estate appraiser, who conducts property
management using outdated methods and tools that are subjectively dependent on the individual,
will be avoided. This technological method’s ease of operation allows high-frequency measurements to
be taken, creating an up-to-date and advanced database. Another essential advantage of this method is
early detection in cases of building abnormalities. One distinctive feature of the proposed technological
method is that residents will not be bothered by appraisers entering their homes. The technological
method suggested by the author may generate an increase in municipal tax revenue to the authorities.
Furthermore, residents will be secure in the fact that their properties are being assessed by advanced
technological means and are not subject to human error.
There are complex problems associated with estimation distortions in almost all countries.
The appraiser has a crucial role in the two measurement methods. In the value-based method,
he estimates the property’s value (De Cesare and Ruddock 1998). In the area-based method, he measures
the floor space of the property.
This study extends the understanding and knowledge of the standard methods of measuring
property tax, which is calculated as the area multiplied by the tax rate. According to the technology
suggested in this paper, a uniform assessment needs to be applied all over Israel to ensure a fair and
equitable property tax system.
Future studies should continue analyzing the assessment methods of commercial properties
in Israel to achieve uniformity of estimates, avoid property tax distortion, and create equality and
efficiency in the property tax burden. There is a need to evaluate distributional impacts. At this stage,
this is not possible because of a lack of data.
The statistical analysis of the results was performed on data collected on new residential dwellings
rather than second-hand apartments or investment properties, which is a limitation of the paper. In this
study, four of the largest and most important cities in Israel were examined. However, the analysis can
be expanded to more cities. The lengthy data collection process limited this. The lack of historical data
is another limitation to the study. It is essential to stress that in this paper, only residential property tax
is examined and not property tax on commercial (business) properties.
Funding: This research received no external funding.
Acknowledgments:
I desire to express my gratitude to: Piotr Lis, my supervisor, for his valuable aid and
involvement in the process of publishing this article. I would also like to thank the reviewer of my work for his
remarks, Krzysztof Stec, who helped me give this article its final shape.
Conflicts of Interest: The author declares that no conflict of interest.
Appendix A
Table A1. ANOVA Results and a Post Hoc Analysis.
Sum of Squares df Mean Square F Sig.
Between Groups 7659.912 3 2553.304 30.514 0.000
Within Groups 6773.967 80 84.675
Total 1,4433.880 83

J. Risk Financial Manag. 2020, 13, 327 10 of 11
Table A2. ANOVA Results and a Post Hoc Analysis.
(I) city_num (J) city_num
Mean
Differences (I–J)
Std. Error
Sig.
95% Confidence Interval
Lower Bound Upper Bound
Jerusalem Tel Aviv 15.1594784 2.8397618 0.000 7.049308 23.2696649
Haifa 1.8115533 * 2.8397618 0.938 −6.296617 9.921723
Beer-Sheva 23.0800420 2.8397618 0.000 14.969872 31.190212
Tel Aviv Jerusalem −15.1594784 * 2.8397618 0.000 −23.269649 −7.049308
Haifa −13.3479251 * 2.8397618 0.000 −21.458095 −5.237755
Beer-Sheva 7.9205636 2.8397618 0.938 −0.189607 16.030734
Haifa Jerusalem −1.8775533 2.8397618 0.938 −9.921723 6.298617
Tel Aviv 13.3479251 2.8397618 0.000 5.237755 21.458095
Beer-Sheva 21.2684887 2.8397618 0.000 13.1583219 29.378659
Beer-Sheva Jerusalem −23.0080420 2.8397618 0.000 −31.190212 −14.969872
Tel Aviv −7.9205636 2.8397618 0.938 −16.030734 0.189607
Haifa −21.2684887 2.8397618 0.000 −29.378659 −13.158319
* The mean difference is significant at the 0.05 level.
Table A3. ANOVA Results and a Post Hoc Analysis. Scheffe
a
.
city_num
N
Subset for Alpha = 0.5
1 2
Beer-Sheva 21 31.610352
Tel Aviv 21 39.530519
Haifa 21 52.878841
Jerusalem 21 54.690394
Sig. 0.058 0.938
Means for groups in homogeneous subsets are displayed.
a
Uses Harmonic Mean Sample Size = 21.000. Source:
Own calculations.
References
Bird, Richard, and Enid Slack. 2006. Taxing Land and Property in Emerging Economies: Raising Revenue and
More? In Land Policies and Their Outcomes. Edited by Gregory K. Ingram and Yu-hung Hong. Cambridge:
Lincoln Institute of Land Policy.
Brunori, David. 2003. Local Tax Policy: A Federalist Perspective. Washington, DC: The Urban Institute Press.
Chambers, Matthew, Carlos Garriga, and Don E. Schlagenhauf. 2009. Housing Policy and the Progressivity of
Income Taxation. Journal of Monetary Economics 56: 1116–34. [CrossRef]
Christensen, Ian, Corrigan Paul, Mendicino Caterina, and Shin-Ichi Nishiyama. 2016. Consumption, housing
collateral, and the Canadian business cycle. Canadian Journal of Economics/Revue Canadienne D’
é
conomique 49:
207–36. [CrossRef]
Connolly, Katrina, and Michael Bell. 2009. Area-Based Property Tax Systems: Current Practice and Equity Concerns.
Lincoln Institute of Land Policy Working Paper. Cambridge: LILP. Available online: http://www.lincolninst.
edu/pubs/1624_Area-Based-Property-Tax-Systems (accessed on 23 March 2010).
Connolly, Katrina, and Michael E. Bell. 2010. Financing Urban Government in Transition Countries: Assessment
Uniformity and the Property Tax. Environment and Planning C: Government and Policy 28: 978–91. [CrossRef]
Dalevska, Nataliya, Valentyna Khobta, Aleksy Kwilinski, and Sergey Kravchenko. 2019. A Model for Estimating
Social and Economic Indicators of Sustainable Development. Entrepreneurship and Sustainability 6: 1839–60.
[CrossRef]
Darin, Dan. 1999. A Politician’s Appraisal of Property Taxation: Israel’s Experience with Arnona. Research Paper.
Cambridge: Lincoln Institute of Land Policy.
De Cesare, Claudia M., and Les Ruddock. 1998. A new approach to the analysis of assessment equity. Appraisal
Journal 5: 57–69.
Głuszak, Michal. 2015. On the Equity of the Area-Based Property Tax System in Poland.
´
Swiat Nieruchomo´sci
94: 37–44.

J. Risk Financial Manag. 2020, 13, 327 11 of 11
Hale, Dennis. 1985. The evolution of the property tax: A study of the relation between public finance and political
theory. The Journal of Politics 47: 382–404. [CrossRef]
Kwilinski, Aleksy, Kazimierz Pajak, Oleksandr Halachenko, Svitlana Vasylchak, Yaroslav Pushak, and Paulina Kuzior.
2019. Marketing Tools for Improving Enterprise Performance in the Context of Social and Economic Security of
the State: Innovative Approaches to Assessment. Marketing and Management of Innovations 4: 172–81. [CrossRef]
Lis, Piotr. 2012. Housing Cycles. Theoretical and Practical Aspects. Toru ´n: Wydawnictwo Adam Marszałek.
Mieszkowski, Peter, and George. R. Zodrow. 1989. Taxation and the Tiebout model: The differential effects of
head taxes, taxes on land rents, and property taxes. Journal of Economic Literature 27: 1098–146.
Oates, Wallace. E. 2001. Property Taxation and Local Government Finance. Cambridge: Lincoln Institute of Land Policy.
Popescu, Cristina Raluca Gh. 2019. Corporate Social Responsibility, Corporate Governance and Business
Performance: Limits and Challenges Imposed by the Implementation of Directive 2013/34/EU in Romania.
Sustainability 11: 5146. [CrossRef]
Rosengard, Jay K. 2013. The Tax Everyone Loves to Hate: Principles of Property Tax Reform. In A Primer on the
Property Tax: Administration and Policy. Edited by William J. McCluskey, Gary C. Cornia and Lawrence C. Walters.
Chichester: Wiley-Blackwell, pp. 173–86.
Rostowicz, Henryk. 2001. Marketing of Real Estate. Ph.D. dissertation, University of Oradea, Oradea, Romania.
Sheffrin, Steven M. 2010. Fairness and Market Value Property Taxation. In Challenging the Conventional Wisdome on
the Property Tax. Edited by Roy Bahl, Jorge Martinez-Vazquez and Joan M. Youngman. Cambridge: Lincoln
Institute of Land Policy, pp. 241–62.
Slack, Enid, and Richard Bird. 2014. The Political Economy of Property Tax Reform. OECD Working Papers on Fiscal
Federalism, No. 18. Paris: OECD Publishing. [CrossRef]
Youngman, Joan M., and Jane H. Malme. 2004. The property tax in a new environment: Lessons from international
tax reform efforts. Paper Presented at the Andrew Young School’s Fourth Annual Conference on Public Finance
Issues. Available online: https://core.ac.uk/download/pdf/71345232.pdf (accessed on 21 December 2020).
Zodrow, George R. 2001. The property tax as a capital tax: A room with three views. National Tax Journal 54: 139–56.
[CrossRef]
Publisher’s Note:
MDPI stays neutral with regard to jurisdictional claims in published maps and institutional
affiliations.
©
2020 by the author. Licensee MDPI, Basel, Switzerland. This article is an open access
article distributed under the terms and conditions of the Creative Commons Attribution
(CC BY) license (http://creativecommons.org/licenses/by/4.0/).
