
Subject: Statistics
Created by: Marija Stanojcic
Revised: 10/9/2018
Mean, median, mode, variance & standard deviation
MEAN – average value of the data set
symbol(s):
– sample mean,
Example 1: Calculate the mean for the data set: 1, 4, 4, 6, 10.
=
=
MEDIAN – “the middle number”, a number that splits data set in half
How to find median?
Step 1: Arrange data in increasing order
Step 2: Determine how many numbers are in the data set = n
Step 3: If n is odd: Median is the middle number
If n is even: Median is the average of two middle numbers
Example 2: Find the median for the data set: 34, 22, 15, 25, 10.
Step 1: Arrange data in increasing order 10, 15, 22, 25, 34
Step 2: There are 5 numbers in the data set, n = 5.
Step 3: n = 5, so n is an odd number Median = middle number, median is 22.
Example 3: Find the median for the data set: 19, 34, 22, 15, 25, 10.
Step 1: Arrange data in increasing order 10, 15, 19, 22, 25, 34
Step 2: There are 6 numbers in the data set, n = 6.
Step 3: n = 6, so n is an even number Median = average of two middle numbers
median =
= 20.5
Notes: Mean and median don’t have to be numbers from the data set!
Mean and median can only take one value each.
Mean is influenced by extreme values, while median is resistant.
Subject: Statistics
Created by: Marija Stanojcic
Revised: 10/9/2018
Mean, median, mode, variance & standard deviation
MODE – The most frequent number in the data set
Example 4: Find the mode for the data set: 19, 19, 34, 3, 10, 22, 10, 15, 25, 10, 6.
The number that occurs the most is number 10, mode = 10.
Example 5: Find the mode for the data set: 19, 19, 34, 3, 10, 22, 10, 15, 25, 10, 6, 19.
Number 10 occurs 3 times, but also number 19 occurs 3 times, since there is no number that occur 4
times both numbers 10 and 19 are mode, mode = {10, 19}.
Notes: Mode is always the number from the data set.
Mode can take zero, one, or more than one values. (There can be zero modes, one mode, two modes, …)
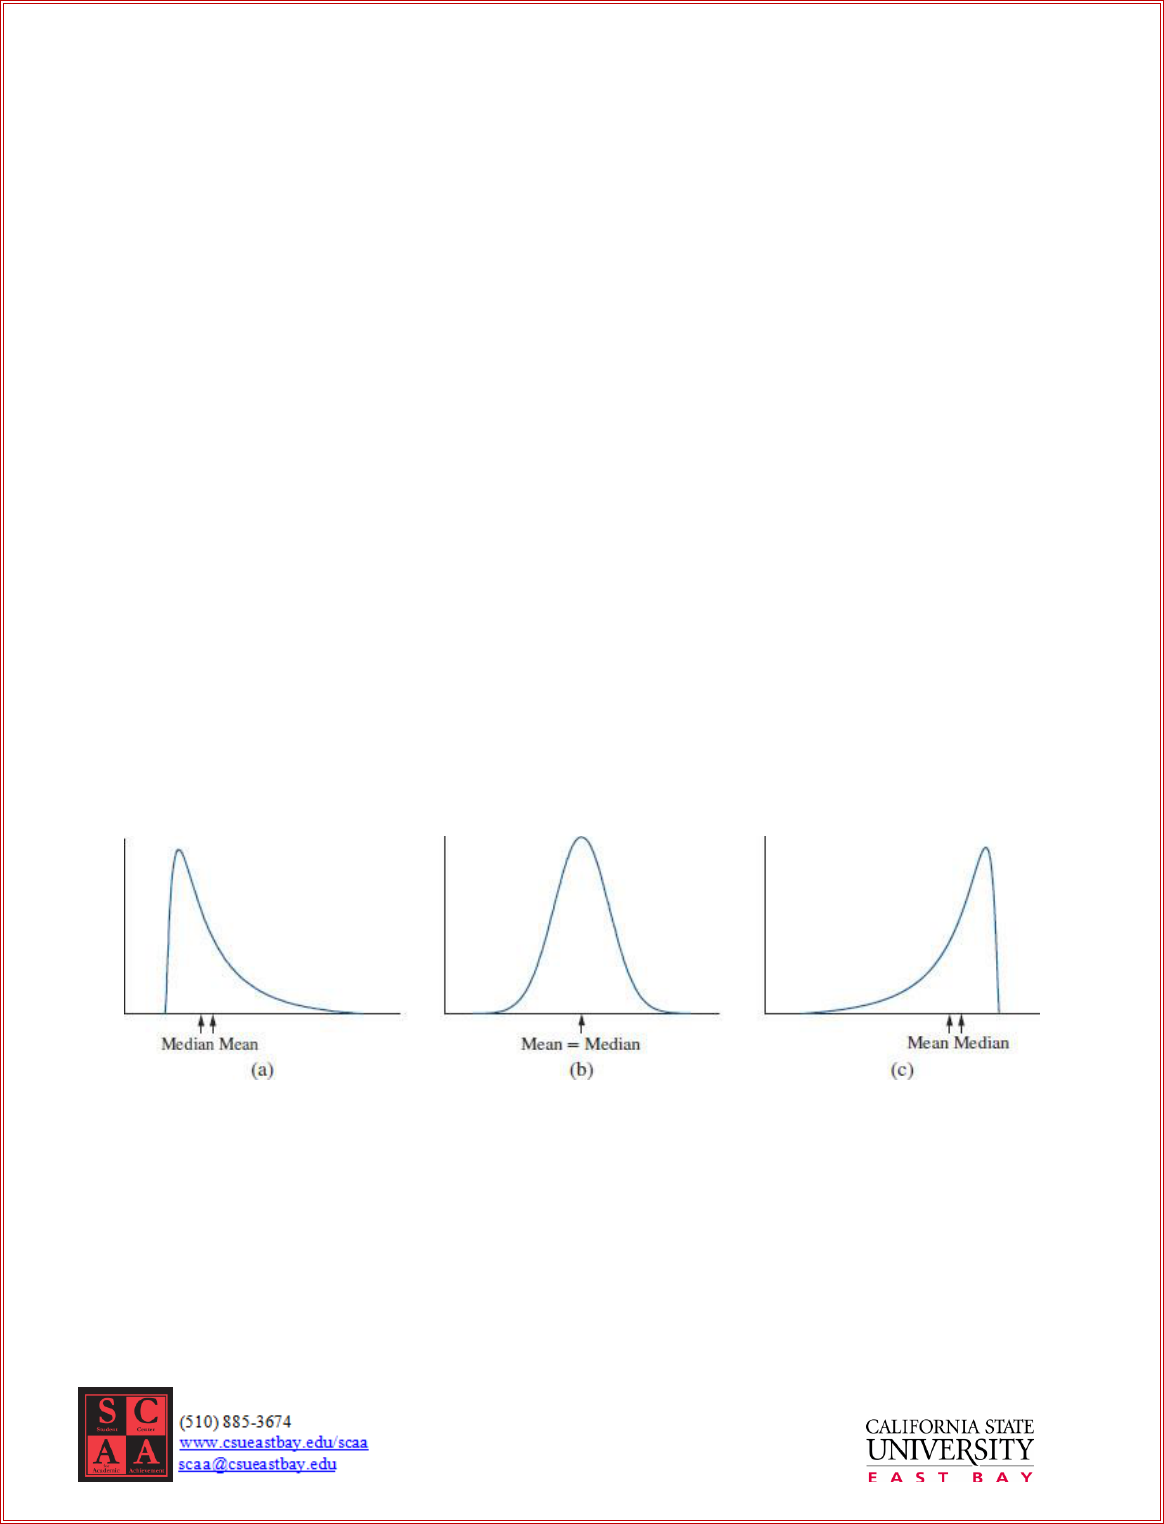
Shape of a Data Set
Relationship between mean and median, in most cases, can describe the shape of data set (histogram).
(a) Median < Mean (b) Median = Mean (c) Median > Mean
skewed to the RIGHT symmetric skewed to the LEFT
positively skewed negatively skewed

Subject: Statistics
Created by: Marija Stanojcic
Revised: 10/9/2018
Mean, median, mode, variance & standard deviation
The difference between value and population mean , – is deviation.
VARIANCE measures how far the values of the data set are from the mean, on average. The average of the
squared deviations is the population variance.
Symbol(s): σ
2
– population variance σ
2
=
s
2
– sample variance s
2
=
STANDARD DEVIATION – square root of the variance
Symbol(s): σ – population standard deviation σ =
s – sample standard deviation s =
How to compute variance and standard deviation? (of a sample)
For variance do steps 1-5, for standard deviation do steps 1-6.
Step 1 – Compute the sample mean
Step 2 – Calculate the difference of
, for each value in the data set
Step 3 – Calculate the squared difference
, for each value in the data set
Step 4 – Sum the squared differences
Step 5 – Divide the sum of squared differences with n-1,
Step 6 – ONLY FOR STANDARD DEVIATION
Calculate the squared root of variance, =
s =
References: Essential Statistics, 2nd Ed., Navidi, Monk
