
OCS Study
BOEM 2020-017
U.S. Department of the Interior
Bureau of Ocean Energy Management
New Orleans Office
Survey and Assessment of the
Ocean Renewable Energy Resources in
the US Gulf of Mexico

OCS Study
BOEM 2020-017
Published by
U.S. Department of the Interior
Bureau of Ocean Energy Management
New Orleans Office
New Orleans, LA
February 2020
Survey and Assessment of the
Ocean Renewable Resources in
the US Gulf of Mexico
Authors
Walter Musial
Suzanne Tegen
Rick Driscoll
Paul Spitsen
Owen Roberts
Levi Kilcher
George Scott
Philipp Beiter
Prepared under BOEM Agreement
M17PG00012
by
National Renewable Energy Laboratory
15013 Denver West Parkway
Golden, CO 80401
DISCLAIMER
This study was funded by the United States (US) Department of the Interior (DOI), Bureau of Ocean
Energy Management (BOEM), Environmental Studies Program, Washington, DC, through Interagency
Agreement Number M17PG00012 with the National Renewable Energy Laboratory (NREL). This report
has been technically reviewed by BOEM, and it has been approved for publication. The views and
conclusions contained in this document are those of the authors and should not be interpreted as
representing the opinions or policies of the US Government, nor does mention of trade names or
commercial products constitute endorsement or recommendation for use.
REPORT AVAILABILITY
To download a PDF file of this report, go to the US Department of the Interior, Bureau of Ocean Energy
Management website at www.boem.gov/Environmental-Studies-EnvData/, click on the link for the
Environmental Studies Program Information System (ESPIS), and search on 2020-017.
CITATION
Musial W, Tegen S, Driscoll R, Spitsen P, Roberts O, Kilcher L, Scott G, and Beiter P (National
Renewable Energy Laboratory and the Alliance for Sustainable Energy, LLC, Golden, CO). 2019.
Survey and assessment of the ocean renewable resources in the US Gulf of Mexico. New Orleans
(LA): Bureau of Ocean Energy Management. Contract No.: M17PG00012. Report No.: OCS Study
BOEM 2020-017.
ABOUT THE COVER
Photo credits and/or sources, clockwise:
Wind: Suzanne Tegen; solar: labeled for non-commercial resuse in Google images; wave energy
converter: Pelamis Wave Power; Wave: (BOEM flickr Website; Wave energy converter 2: Ocean Power
Technologies.
i
ACKNOWLEDGMENTS
This study was funded by the US Department of the Interior, Bureau of Ocean Energy Management
(BOEM), Environmental Studies Program, Washington, DC, through Interagency Agreement Number
M17PG00012 with the NREL/Department of Energy (DOE). The authors would like to thank the many
people who contributed to the content of this report, including BOEM staff: the initial Contract Officer
Representative (COR) for this study, Dr. Rebecca Green, and Andrea Heckman who was the final COR
for this study. Other BOEM team members for their thoughtful reviews, comments, and suggestions,
including John Primo, Mark Rouse, Megan Milliken, Leah O’Donnell, Brian Cameron, Sid Falk, Alexis
Lugo-Fernández, and Mark Jensen, and Joanne Murphy as the Contracting Officer. We would also like to
recognize BOEM’s Gulf of Mexico OCS Region Regional Director, Michael Celata, for supporting
renewable energy strategic planning in the region. BOEM GIS support was provided by Michael Prymula.
Joanne Murphy as the Contracting Officer.
We also thank NREL staff including Ted Kwasnik, Donna Heimiller, Caroline Draxl, Levi Kilcher and
Billy Roberts for their contributions to the content of the maps, analysis and the report. NREL editing was
provided by Sheri Anstedt; final editing and formatting for BOEM was provided by Elaine Leyda. Any
omissions are the sole responsibility of the authors.
ii
Contents
List of Figures ............................................................................................................................................... iv
List of Tables ................................................................................................................................................ vi
Abbreviations and Acronyms ....................................................................................................................... vii
Summary ...................................................................................................................................................... ix
1 Overview and Project Background ........................................................................................................... 13
1.1 Goal and Objectives .......................................................................................................................... 14
1.2 Technical Approach .......................................................................................................................... 14
1.2.1 Technology Types ...................................................................................................................... 14
1.2.2 Definition of Study Area: State and Federal Water Distance Zones .......................................... 15
1.2.3 Water Depth Zones .................................................................................................................... 15
1.3 Constraints and Limitations ............................................................................................................... 16
1.3.1 General Constraints ................................................................................................................... 16
1.3.2 Data Sources, Filters, and Uncertainties ................................................................................... 17
1.3.3 Competing Uses and Environmental Exclusions ....................................................................... 19
2 Offshore Renewable Energy Technology Types ..................................................................................... 22
2.1 Offshore Wind Energy ....................................................................................................................... 22
2.1.1 Offshore Wind Energy Technology Description ......................................................................... 22
2.1.2 Offshore Wind Energy Resource Potential ................................................................................ 25
2.1.3 Offshore Wind Energy Technical Readiness ............................................................................. 27
2.1.4 Offshore Wind Energy Economics ............................................................................................. 28
2.1.5 Offshore Wind Energy Summary ............................................................................................... 29
2.2 Wave Energy ..................................................................................................................................... 30
2.2.1 Wave Energy Technology Description ....................................................................................... 30
2.2.2 Wave Energy Resource Potential .............................................................................................. 34
2.2.3 Wave Energy Technical Readiness ........................................................................................... 36
2.2.4 Wave Energy Economics ........................................................................................................... 36
2.2.5 Wave Energy Summary ............................................................................................................. 37
2.3 Tidal Energy ...................................................................................................................................... 37
2.3.1 Tidal Energy Technology Description ........................................................................................ 37
2.3.2 Tidal Energy Resource Potential ............................................................................................... 40
2.3.3 Tidal Energy Technical Readiness ............................................................................................ 42
2.3.4 Tidal Energy Economics ............................................................................................................ 42
2.3.5 Tidal Energy Summary .............................................................................................................. 42
2.4 Ocean Current Energy ...................................................................................................................... 42
iii
2.4.1 Ocean Current Energy Technology Description ........................................................................ 43
2.4.2 Ocean Current Energy Resource Potential ............................................................................... 43
2.4.3 Ocean Current Energy Technical Readiness ............................................................................ 47
2.4.4 Ocean Current Energy Economics ............................................................................................ 47
2.4.5 Ocean Current Energy Summary............................................................................................... 47
2.5 Offshore Solar Energy ....................................................................................................................... 47
2.5.1 Offshore Solar Energy Technology Description ......................................................................... 48
2.5.2 Offshore Solar Energy Resource Potential ................................................................................ 50
2.5.3 Offshore Solar Energy Technical Readiness ............................................................................. 52
2.5.4 Offshore Solar Energy Economics ............................................................................................. 52
2.5.5 Offshore Solar Energy Summary ............................................................................................... 52
2.6 Ocean Thermal Energy Conversion (OTEC) .................................................................................... 53
2.6.1 OTEC Description ...................................................................................................................... 53
2.6.2 OTEC Resource Potential .......................................................................................................... 55
2.6.3 OTEC Technical Readiness ....................................................................................................... 56
2.6.4 OTEC Economics ...................................................................................................................... 56
2.6.5 OTEC Summary ......................................................................................................................... 57
2.7 Cold Water Source Cooling ............................................................................................................... 57
2.7.1 Cold Water Source Cooling Technology Description................................................................. 57
2.7.2 Cold Water Source Cooling Resource Potential ........................................................................ 59
2.7.3 Cold Water Source Cooling Technical Readiness ..................................................................... 60
2.7.4 Cold Water Source Cooling Economics ..................................................................................... 60
2.7.5 Cold Water Source Cooling Summary ....................................................................................... 61
2.8 Hydrogen Conversion and Storage ................................................................................................... 61
2.8.1 Hydrogen Conversion and Storage Technology Description ..................................................... 62
2.8.2 Hydrogen Conversion and Storage Resource Potential ............................................................ 63
2.8.3 Hydrogen Conversion and Storage Technical Readiness ......................................................... 63
2.8.4 Hydrogen Conversion and Storage Economics ......................................................................... 64
2.8.5 Hydrogen Conversion and Storage Summary ........................................................................... 65
3. Gulf of Mexico Offshore Renewable Energy Summaries ....................................................................... 66
3.1 Resource Comparisons by Technology ............................................................................................ 66
3.2 Technology Readiness by Technology Type .................................................................................... 68
3.3 Cost Comparison by Technology ...................................................................................................... 70
4. Down-selecting to One Technology ........................................................................................................ 71
4.1 Down-select Criteria .......................................................................................................................... 71
4.2 Down-select Conclusion .................................................................................................................... 72
References .................................................................................................................................................. 73
iv
List of Figures
Figure S-1. Gross and technical offshore renewable energy potential for the Gulf of Mexico (GOM) by
technology. .................................................................................................................................................... x
Figure 1. Map highlighting distance-to-shore zones for the GOM. ............................................................. 15
Figure 2. Bathymetry of the GOM out to the international exclusive economic zone (EEZ). ..................... 16
Figure 3. Areas with possible environmental and human use conflicts. ..................................................... 20
Figure 4. Excluded resource area percentages for the US based on Black & Veatch (2010) study. ......... 20
Figure 5. How a wind turbine generates electricity. .................................................................................... 23
Figure 6. Schematic of a typical offshore wind farm. .................................................................................. 24
Figure 7. Offshore wind technologies: fixed-bottom foundation (left) and floating foundation (right). ........ 25
Figure 8. Average annual wind speeds at a hub height of 100 m (328 ft) in the GOM for the gross
resource area. ............................................................................................................................................. 26
Figure 9. Average annual wind speeds at a hub height of 100 m (328 ft) in the GOM for the technical
resource area. ............................................................................................................................................. 26
Figure 10. Technical offshore wind resource potential by state in the GOM. ............................................. 27
Figure 11. Regional map of levelized cost of energy (LCOE) (left) and net value (right). .......................... 29
Figure 12. Behavior of water particles in a wave propagating in deep water. ............................................ 30
Figure 13. Multi-segmented, hinged wave attenuator technology. ............................................................. 31
Figure 14. Continuous tube attenuator technology. .................................................................................... 31
Figure 15. Wave point absorber technology. .............................................................................................. 32
Figure 16. Oscillating water column technology. ........................................................................................ 32
Figure 17. Wave overtopping technology. .................................................................................................. 33
Figure 18. Wave pressure differential technology. ..................................................................................... 33
Figure 19. Surge converter technology. ...................................................................................................... 34
Figure 20. Global wave mean power density. ............................................................................................. 34
Figure 21. Gross Wave Resource in the GOM. .......................................................................................... 35
Figure 22. Example time series of tidal speeds for Boca Grande Pass, Charlotte Harbor, Florida. ........... 38
Figure 23. Tidal barrage in the Rance River in Brittany, France................................................................. 39
Figure 24. Potential tidal energy sites within the GOM and Florida Keys. .................................................. 41
Figure 25. Horizontal axis ocean current turbine using lifting surfaces for position in the water column. .. 43
Figure 26. GOM Loop Current forecast by NOAA on September 14, 2017. .............................................. 44
Figure 27. GOM Loop Current. ................................................................................................................... 45
v
Figure 28. Average annual power density of the Loop Current. ................................................................. 46
Figure 29. Average annual power density of the Loop Current (technical potential showing only areas
above 500 W/ m
2
)........................................................................................................................................ 46
Figure 30. Schematic of a floating solar system. ........................................................................................ 48
Figure 31. Reported global floating PV capacity installed by year. ............................................................ 49
Figure 32. Gross long term average GOM horizontal solar radiation resource. ......................................... 51
Figure 33. OTEC example schematic. ........................................................................................................ 54
Figure 34. Schematics of closed-cycle (left) and pen-cycle (right) OTEC systems. ................................... 54
Figure 35. Ocean thermal energy gross and technical resource showing 321,600 km
2
area where
temperature differential is 18˚C (64.4°F) or more. ...................................................................................... 55
Figure 36. Cold water source cooling diagram. .......................................................................................... 58
Figure 37. Cold water source cooling schematic. ....................................................................................... 58
Figure 38. Locations of cold water resource (<8˚C [46.4°F]) in the GOM averaged over a typical year. ... 60
Figure 39. Overview of proton exchange membrane electrolyzer. ............................................................. 62
Figure 40. Gross and technical offshore renewable energy potential for the GOM by technology. ........... 68
Figure 41. Technology readiness for GOM renewable energy technologies. ............................................. 69
Figure 42. Levelized cost ranges for renewable energy technologies. ....................................................... 70
Figure 43. GOM technology scoring in rank order. ..................................................................................... 72
vi
List of Tables
Table S-1. Gulf of Mexico (GOM) Technology Scoring Assessment Results .............................................. xi
Table 1. Resource Data Sources for GOM Renewable Energy Technologies ........................................... 17
Table 2. Resource Filters for Each Renewable Energy Technology .......................................................... 18
Table 3. Cost Data Sources for Each Renewable Technology ................................................................... 19
Table 4. Offshore Wind Economic Potential in the GOM ............................................................................ 28
Table 5. Wave Resource Potential in the GOM .......................................................................................... 36
Table 6. Tidal Energy Resource Potential for GOM Sites .......................................................................... 40
Table 9. Base Case Economics of an Offshore Wind-Powered Electrolyzer ............................................. 64
Table 10. Modeled Hydrogen Production Costs Without Transport Costs ................................................. 65
Table 11. Offshore Renewable Energy Resource Limit Criteria for the GOM ............................................ 67
Table 12. Technology Cost Sources ........................................................................................................... 70
Table 13. GOM Technology Scoring Assessment Results ......................................................................... 71

vii
Abbreviations and Acronyms
Short Form
Long Form
A/C
air conditioning
API
American Petroleum Institute
BOEM
Bureau of Ocean Energy Management
BSEE
Bureau of Safety and Environmental Enforcement
DOE
Department of Energy
EEZ
Exclusive Economic Zone
EPAct
Energy Policy Act of 2005
GOM
Gulf of Mexico
GW
gigawatt
HTE
high temperature electrolyzer
H
2
hydrogen
HDPE
high density polyethylene
IEC
International Electrotechnical Commission
kWh
kilowatt-hour
LACE
levelized avoided cost of energy
LCOE
levelized cost of energy
LSU
Louisiana State University
LTE
low temperature electrolyzer
m
meter
m/s
meters per second
MHK
marine hydrokinetic
mph
miles per hour
MW
megawatt
NELA
Natural Energy Laboratory of Hawaii Authority
N/A
not applicable
nm
nautical mile
NOAA
National Oceanic and Atmospheric Administration
NREL
National Renewable Energy Laboratory
OCS
Outer Continental Shelf
OTEC
Ocean Thermal Energy Conversion
PEM
proton exchange membrane
PTO
power take-off
PV
photovoltaics
R&D
research and development
REN
renewable energy
s
second
SOEC
solid oxide electrolyzer
SMR
steam methane reformation
STC
standard test conditions
THw/yr
terawatt hours per year

viii
Short Form
Long Form
TRL
technologies readiness levels
US
United States
USDOI
US Department of the Interior
WEC
wave energy convertor
yr
year

ix
Summary
This study was conducted by the National Renewable Energy Laboratory (NREL) and funded by the
Bureau of Ocean Energy Management (BOEM). It provides a comprehensive feasibility assessment of
multiple offshore renewable energy technologies in the Gulf of Mexico (GOM) to inform BOEM’s
strategic plans related to possible Outer Continental Shelf (OCS) alternative energy leasing activities in
the GOM. In coordination with Gulf Coast states, for future energy planning, this study also includes
some information on offshore renewable energy potential in state waters.
The goal of this study is to survey potential offshore renewable energy sources in the GOM and quantify
their feasibility relating to resource adequacy, technology maturity, and the potential for competitive cost.
The study provides a review of available technologies and concepts for generating offshore renewable
energy, including a high-level assessment of the current state of each technology and its potential for
future advances. It provides a breakdown of resource capacity for each renewable energy technology as
well as a recommendation that offshore wind be pursued for future study as it was found to be the most
promising ocean renewable technology.
The renewable technologies that were considered include:
• Offshore wind
• Wave energy
• Tidal energy
• Ocean current energy
• Offshore solar energy
• Ocean thermal energy conversion (OTEC)
• Cold water source cooling
• Hydrogen (as a storage medium to use existing pipeline infrastructure).
The resource capacity for each of these renewable energy sources was quantified for both the gross
resource capacity potential (gross resource)
1
and the technical resource capacity potential (technical
resource)
2
using the methodology described in an earlier NREL report by Musial et al. (2016). Many of
these sources are very immature from a commercial perspective, which makes some of the comparisons
difficult. In many cases, it was necessary to develop new methods to estimate nominal power density for
some technology types in order to convert the respective resource areas into deployable gross and
technical resource capacity potentials. The resource for each technology type is shown in Figure S-1. The
vertical scale of the chart is logarithmic to enable the chart to show resource quantities for all the
technologies, which, in some cases, vary by orders of magnitudes.
1
Resource capacity potential (gross resource) is limited to the boundaries of the US Exclusive Economic Zone (EEZ) (up to 200 nm
from shore). The calculation of gross resource does not discriminate on the basis of possible technology, use conflicts, or
environmental impacts. Therefore, it intentionally includes areas that might not be economical to develop or could be unsuitable for
various reasons that normal site screening might eliminate using today’s base knowledge (Musial et al. 2016).
2
The technical resource potential capture the subset of gross resource potential that may be commercially viable within a
reasonable timeframe (Musial et al. 2016). It takes into account technical limits of the developing the renewable resource offshore.

x
Figure S-1. Gross and technical offshore renewable energy potential for the Gulf of Mexico (GOM) by
technology.
The analysis found that offshore solar photovoltaics had the greatest gross potential resource but, without
a demonstrable method of surviving extreme waves on the open ocean, none of that resource was counted
toward the technical resource potential. However, it was noted that there are many sheltered sites in state
waters that may be suitable for offshore solar; these were not evaluated in this study. Of all the
technologies, offshore wind had the largest quantity of technical resource potential with 508 gigawatt
(GW) covering all GOM states, although Texas and Louisiana show the highest overall technical offshore
wind resource potential.
A qualitative assessment of the commercial readiness and commercial cost projections was also
conducted for each technology type. Offshore wind has the highest readiness levels. It ranges from pre-
commercial demonstration to commercially-proven. Although there are more than 16 GW of offshore
wind deployed around the globe, additional technology development is still needed for the GOM to
develop and validate hurricane designs and to simultaneously optimize GOM rotors for the lower wind
regimes found in this region.
Wave technology readiness levels are low. They span from early stage research and development to pre-
commercial demonstration. Although multiple wave energy conversion devices have been deployed, there
has not been sustained operation of any wave device for enough time to demonstrate commercial
operation or predictable energy production profiles. The industry is still actively engaged in developing
new concepts at a research and development scale without significant convergence.
Tidal energy has had some pre-commercial success globally and is approaching commercialization in
some projects, partly due to the adaptation of horizontal axis wind energy technology, which has similar
engineering attributes, but the tidal resource is generally small, limiting deployment and slowing industry
maturation.
Ocean current technology has only been validated at the laboratory and/or prototype scale; no prototypes
have yet been deployed in open ocean, despite the similarities to tidal turbines.
1
10
100
1,000
10,000
100,000
1,000,000
10,000,000
100,000,000
Offshore Wind
Wave Energy Tidal Energy Ocean Current Offshore Solar
PV
OTEC
1,872,000
3,122
130
3,600
85,812,000
61,100
508,000
0
86
358
0
8,100
Resource Potential (MW)
Gross Potential (MW) Technical Potential (MW)

xi
Ocean-based solar photovoltaics (PV) benefit from proven technology on land where PV has achieved
vast commercial success. This success has been extended commercially to deployment over sheltered
lakes and reservoirs. However, it has yet to be commercially deployed or tested in open-ocean conditions
where the challenges are immense due to extreme waves.
Studies suggest that the scale of OTEC power plants must grow to 100 megawatt (MW) to realize cost
reductions large enough for commercialization and technological success. Deployments to date have been
at a scale 1/100th of that size. Therefore, the technology has not demonstrated economic or performance
feasibility, and significant technical challenges are still unresolved, even at the smaller scales. The
technology requires significant additional research, prototyping and demonstration before it can be
deployed commercially.
Cold water source cooling has successfully been used in multiple locations around the world, but its
application in the GOM will likely be limited to the Florida Keys and may require additional technology
to overcome longer pipe lengths.
Hydrogen conversion using electrolysis has been technically proven and significantly larger
demonstration projects continue to be deployed. Successful deployment in an offshore ocean application
would be technically feasible with a significant amount of additional testing. However, hydrogen as a
means of energy transport from offshore wind installations does not appear to be economically feasible
under any scenario investigated.
Levelized cost of energy varied widely across the technologies examined with a wider range of
uncertainty, especially for the more nascent technologies that have not yet had successful demonstration
at full scale. As a result, costs and cost ranges were difficult to compare, and cost data tends to be more
optimistic for nascent technologies that have not been validated or have had actual field experience.
Taking that into account, offshore wind showed the most favorable cost and is closest to
commercialization.
Based on the criteria established for three categories: 1) resource adequacy, 2) technology readiness, and
3) cost competitiveness–a down-select process was conducted to rank each offshore renewable
technology. Each technology was ranked from 1 to 5 for each category, with a score of 5 being the best.
The scores were summed, and the results indicated that offshore wind was ranked highest (13 out of 15).
Consequently, offshore wind is recommended as the primary technology for future focus. The scoring
results are shown in Table S-1.
Table S-1. Gulf of Mexico (GOM) Technology Scoring Assessment Results
Technology Type
Resource
Adequacy
Technology
Readiness
Cost
Competitiveness
Potential
Total
Score
Offshore wind
5
4
4
13
Wave energy
1
2
2
5
Tidal energy
2
3
3
8
Ocean current
1
2
2
5
Offshore solar energy
3
3
3
9
OTEC
3
2
2
7
Cold water source cooling 1 4 N/A -
Hydrogen conversion
N/A
3
1
-
xii
The technical resource of offshore wind for the GOM is estimated at 508 GW, the largest of any of the
technologies examined. Its deployment and ability to serve a significant percentage of the load in the
GOM depends primarily on improving the economics over the next decade. Based on global trends, the
economics of offshore wind are improving rapidly, making economic deployment of offshore wind
turbines in the GOM likely by 2030 ([Department of Energy] DOE 2018) when costs may be approaching
acceptable market levels. During this timeframe, new offshore wind technologies will be needed to
optimize energy capture in the lower wind regimes of the GOM, to better understand hurricane risks, and
to design wind turbines suitable for hurricane-prone areas.
Ocean-based solar has an enormous gross resource potential in the GOM but is severely constrained by
extreme wave conditions on the ocean surface that would likely damage conventional photovoltaic
systems and support structures. However, state waters in the GOM have sheltered bays and water bodies
closer to urban load centers that could better take advantage of solar resources and may present a future
opportunity, especially if new technology concepts for floating solar are developed.
Other renewable energy technologies surveyed in this study may present opportunities for energy
generation on a limited basis. Tidal energy has very little resource in the GOM. However, specific sites in
Florida and Texas that were identified in this study have potential for small distributed systems. Cold
water source cooling is limited in the GOM because the best resource is located far from shore where it
cannot be easily accessed. A few sites near Key West, Florida may be accessible for this purpose but will
not make a major contribution to the GOM electricity needs. Wave energy, OTEC, and ocean current all
have major challenges that may preclude their implementation in the GOM in the foreseeable future.
However, longer term technological and economic improvements are possible.
The potential for developing offshore wind to serve loads in the GOM is realistic in the next 10 to 15
years and will be explored further in later tasks.
13
1 Overview and Project Background
A variety of renewable energy (REN) technologies are available and are maturing with expanded
opportunities for offshore renewable energy generation in United States (US) federal and state waters.
The Bureau of Ocean Energy Management (BOEM) needs to assess the full range of these technologies in
the context of how they may be applied in the Gulf of Mexico (GOM) and to inform development
activities within the Bureau’s purview under the Energy Policy Act of 2005 (EPAct), which gave BOEM
the authority to regulate renewable energy projects on the outer continental shelf (OCS). In 2009, the US
Department of the Interior (USDOI) finalized the 30 CFR 585 regulations which provide BOEM with a
framework for issuing leases, easements and rights-of-way for OCS activities that support production and
transmission of renewable energy. Renewable energy resources under BOEM’s jurisdiction include, but
are not limited to, offshore wind, solar, ocean waves, tides, thermal gradients, and current.
This study, conducted by the National Renewable Energy Laboratory (NREL), provides a feasibility
assessment for offshore renewable energy technologies and is intended to inform BOEM’s strategic plans
related to possible OCS alternative-leasing activities in the GOM. In coordination with Gulf Coast States,
this study also includes information on offshore renewable energy potential in state waters and will
provide rationale for possible near-term and long-term offshore renewable energy planning. For more
than 40 years, BOEM’s Environmental Studies Program has been supporting scientific research to inform
policy decisions regarding the development of OCS energy and mineral resources. Since EPAct 2005 was
passed, BOEM has worked with NREL on offshore renewable energy projects and studies related to
energy potential assessment, stakeholder engagement, and feasibility analyses to inform offshore
development opportunities across BOEM (also known as “bureau”) OCS regions.
In July 2011, a bureau-funded study by researchers at Louisiana State University (LSU) was:
“Assessment of Opportunities for Alternative Uses of Hydrocarbon Infrastructure in the Gulf of Mexico”
(Kaiser et al. 2011). The 2011 LSU report was targeted primarily at examining the potential for offshore
wind to benefit the existing oil and gas infrastructure and the feasibility of offshore wind in terms of the
regulatory process. It concluded that offshore wind could provide little value to the oil and gas industries.
Results from this current research do not conflict with those 2011 findings. For this study, we examine the
problem more comprehensively, examining the potential for a range of ocean renewable energy sources to
deliver electricity to the existing land-based grid on the utility power market. The study does not address
renewable energy’s value to the oil and gas industries. It should also be noted that offshore wind energy
technologies have evolved significantly since 2011; assumptions about cost, technology maturity, and
resource availability are more detailed and current than in previous studies.
In the US, several commercial offshore wind projects are currently in the planning phases; the first 30
MW pilot-scale project began transmitting power off Block Island in late 2016. Though the technology
looks very promising for near-term development in the northeastern US, in this study we examine
resource, cost, and technology maturity for the GOM. A host of other marine renewable energy
technologies are in various stages of research, development, and testing, including wave, tidal, ocean
currents, ocean-based solar, ocean thermal gradients, and cold water source cooling. Wave power devices
extract energy directly from the motion of ocean waves, with several wave technologies proposed to
convert that energy to electricity; some are undergoing demonstration testing. Tidal and ocean currents
also carry an enormous amount of energy that can potentially be captured and converted to electricity
with various configurations of submerged water turbines. Recent cost reductions in photovoltaic solar
energy may also enable large solar power plants in some sheltered locations, and resource assessments
indicate ocean thermal energy conversion (OTEC) projects could be possible in some GOM locations
where high thermal gradients exist in the water column. For this study, we examine each of these
14
technologies for the Gulf region, which includes the west coast of Florida, Alabama, Mississippi,
Louisiana, and Texas.
This chapter explains the methods and results from a feasibility study on potential offshore renewable
energy sources in the GOM and the down-select process to choose one technology.
1.1 Goal and Objectives
The goal of this study is to survey potential offshore renewable energy resources in the GOM and to
quantify the feasibility of each technology relating to its technical and economic potential. The intent is to
inform federal and GOM state strategic planning over the next decade. The objectives are:
• To review available technologies and concepts for generating offshore renewable energy,
including a high-level assessment of the current state of each technology and its potential for
future advances;
• To provide a breakdown of resource capacity for each renewable energy technology by state;
• To select the most promising renewable energy technology based on resource adequacy,
technology maturity, and the potential for competitive cost of energy.
1.2 Technical Approach
1.2.1 Technology Types
This study examines the following ocean-based renewable technologies:
• Offshore wind
• Wave energy
• Tidal energy
• Ocean current energy
• Offshore solar energy
• Ocean thermal energy conversion (OTEC)
• Cold water source cooling
• Hydrogen (as a storage medium to use existing pipeline infrastructure).
The research team conducted a thorough literature review and performed a high-level quantitative
assessment of each technology based on resource adequacy, technology readiness, and cost. To calculate
resource adequacy for each renewable energy source, we first estimated the gross resource capacity
potential (gross resource) for each source, measured in gigawatts (GW). From gross resource, we applied
technology filters for each technology to determine the technical resource capacity potential (technical
resource) using the methodology described in the NREL report by Musial et al. (2016). We did not
consider energy production potential, energy production values, or capacity factors in this first level
study. However, it was necessary to estimate nominal power density for each technology type to convert
the resource area for each technology type into deployable gross and technical resource capacity potential.
We also conducted a qualitative assessment of the commercial readiness and commercial cost projections,
for each technology type. The advantages and challenges of each technology are documented in Section
2.0. In some cases, the technologies are too immature and have not been sufficiently evaluated to make
basic assessments about resource, technology readiness, and cost. In these cases, NREL engineers
developed criteria to assess the technology parameters to allow cross-comparisons and conduct a down-
select process to identify the most promising technology. This down-select process was conducted by a
technical review team of NREL and BOEM staff and is described below. A single technology was chosen
for further evaluation.

15
1.2.2 Definition of Study Area: State and Federal Water Distance Zones
The study area was defined as the ocean area from the shore out to the international exclusive economic
zone (EEZ) as shown in Figure 1. Within the total resource area domain, data were classified into the
following four distance zones:
• 0 to 3 nautical miles (nm) zone. This zone is in state waters that are outside BOEM’s
jurisdiction. For Texas and the western coast of Florida, state waters extend to 9 nm (Musial and
Ram 2010).
• 3 to 12 nm zone. This zone extends to the territorial waters boundary at 12 nm. In this zone,
conflicting-use impacts may be higher than in areas farther out. Some studies have found that
opposition to offshore wind projects based on viewshed or aesthetics begins to decline rapidly
beyond 12 nm (Lilley et al. 2010).
• 12 to 50 nm zone. The 50 nm boundary was originally selected to focus resource evaluations on
the near-shore area where access to grid and shore-based support services is more feasible
(Schwartz et al. 2010). Subsequent assessments show that project feasibility is not necessarily
limited to 50 nm. For this study, the 50 nm delineation was retained as a reference to help
describe the differences between far-shore and near-shore impacts out to the 200 nm EEZ limit.
• 50 to 200 nm zone. This distance from shore is included in the gross resource area to provide the
possibility of development beyond 50 nm as conflicts may be lower with large areas of
developable water.
Figure 1. Map highlighting distance-to-shore zones for the GOM.
1.2.3 Water Depth Zones
Water depth plays a critical role in determining whether a resource is suitable for development (Figure 2).
For offshore wind, water depth is crucial in determining the cost of energy. Almost all offshore wind
installations to date have been built in water depths less than 50 meters (m) (164 feet [ft]) on fixed bottom
foundations, but new floating technologies promise to allow installations at much greater depths. Though

16
there is no hard limit, most industry experts agree that 1,000 m may be a practical cut-off when
computing technical resource limitations (Musial et al. 2016). As such, 1,000 m was also used as the cut-
off for other less mature technologies (e.g., ocean current, tidal, ocean-based solar) where no depth limit
on resource has been established by the industry yet.
Figure 2. Bathymetry of the GOM out to the international exclusive economic zone (EEZ).
For OTEC and cold water source cooling, this depth limit was relaxed to avoid elimination of most of that
technology’s resource, as sufficient hot-cold water differentials tend to exist only where water depths
exceed 900 m. Cold water sources also reside in greater depths, but the more limiting factor is that in the
GOM these resources tend to be far from shore.
1.3 Constraints and Limitations
1.3.1 General Constraints
The analysis and conclusions for this study were based on existing literature and information that could be
derived using desktop calculations and assessments. In some cases, it was necessary to apply internal
expert judgements of the NREL team. Greater accuracy could be obtained with more rigorous research,
analysis, and validation. However, the authors’ conclusions about the relative feasibility and impacts of
these technologies would not likely be significantly affected by larger investments in higher fidelity
studies. It is possible that the specific cost and technology readiness conclusions could change due to
advancements in specific technology types in later years. Therefore, periodic future assessments are
recommended.

17
Certain renewable energy sources analyzed in this study are not regulated by BOEM based on its
authority under EPAct 2005. For example, OTEC is regulated by the National Oceanic and Atmospheric
Administration (NOAA) and the OTEC Act of 1980. Cold water source cooling is not mentioned in
EPAct. Also, some of the renewable energy types are likely to be applicable only to state waters, such as
tidal energy and ocean-based solar, but are included here in cooperation with the Gulf Coast States and to
generate a more inclusive study. As such, all renewable energy types are included in the report to
facilitate discussion across the wider Gulf community, but BOEM will regulate only the sources called
out by EPAct.
1.3.2 Data Sources, Filters, and Uncertainties
1.3.2.1 Resource Data
Resource data for individual technologies were obtained from the best available existing sources. The
general sources of these data are summarized in Table 1 and their full citations are given in the reference
section.
Table 1. Resource Data Sources for GOM Renewable Energy Technologies
Technology Source
Offshore wind
AWS Truepower (2012)
Draxl et al. (2015)
Musial et al. (2016)
Wave energy
Kilcher and Thresher (2016)
MHK Data Base (DOE, 2017)
Tidal energy
Kilcher and Thresher (2016)
MHK Data Base (DOE, 2017)
Ocean current
Duerr and Dhanak (2012)
Hamilton et al. (2015)
Von Arx et al. (1974)
National Research Council (2013)
MHK Data Base (DOE, 2017)
Offshore solar energy
Denholm and Margolis (2007)
IRENA (2012)
NASA (2008)
OTEC
Ascari et al. (2012)
Avery and Wu (1994)
Cold water source cooling
Ascari et al. (2012)
Makai (2017)
Hydrogen conversion and
storage
Abdel-Aal et al. (2010)
Meier (2014)
Ruth et al. (2017)
For each technology, the gross resource potential was determined from the data sources above, which is
consistent with standard industry best practice, if best practices could be identified. However, in some
cases best practices have not yet been fully established. For these technologies, NREL established metrics
and filters, as described in Table 2.
Estimating a technology’s resource potential is necessary to determine the amount of electricity
generation potential for a given area. Gross resource was defined primarily by the geographic area within
set boundaries that contain the legitimate legal resource contained in US waters through international
agreements, using the 200 nm EEZ as the maximum outer boundary. These boundaries establish the
theoretical resource area available for US deployments but do not suggest technical or economic viability.

18
To calculate the technical resource potential, filters are applied within the gross resource area to eliminate
regions where technology challenges are judged to be too great to be considered for further deployment or
study. For offshore wind, these are regions where the wind speeds are too low (below 7 meters per second
[m/s] (15.7 miles per hour [mph]), or the water is too deep (greater than 1,000 m [3,281 ft]). For wave
energy, the filters eliminate regions where the waves do not contain enough energy for practical energy
extraction. Solar energy is abundant in the GOM, but technology filters eliminate all regions where
extreme wave heights preclude the development of economical support structures. Tidal and ocean
current filters are based on a minimum power density in the cross section of any current flow. OTEC
filters are based on the water column containing a minimum thermal gradient to drive thermal engines.
Finally, cold source cooling requires a low enough temperature source and proximity to a prominent load.
Table 2. Resource Filters for Each Renewable Energy Technology
3
Technology
Gross Resource Technical Resource
Max
Distance
from
Shore
(nm)
Max
Water
Depth
(m)
Capacity
Density
(MW/km²)
Max
Distance
from
Shore
(nm)
Max
Water
Depth
(m)
Resource
Cut-Off
Max
Wave
Height
(m)
Offshore wind 200 None 3 200 1,000
> 7 m/s
(15.7 mph)
N/A
Wave energy 200
50m
Isobath
50% 200 None > 10 KW/m N/A
Offshore solar energy 200 None 120 200 1,000 N/A 3
Tidal energy 200 None None 200 1,000 > 500 W/m² N/A
Ocean current 200 None None 200 1,000 > 500 W/m² N/A
OTEC 200 None 0.19 200 None
> 18° C
Differential
N/A
Cold water source cooling 200 None N/A 6 1,000 < 8° C N/A
1.3.2.2 Technology Readiness
Data for technology readiness were derived from industry reports, websites, and personal conversations
with technology developers. The data were used to document progress and to assess the maturity of the
various technologies. We defined four technology readiness stages: 1) early stage R&D, 2) proof of
concept, 3) pre-commercial demonstration, and 4) commercially proven. These readiness stages represent
the full spectrum of technology maturity and provide a coarse readiness framework, especially when
compared with other more detailed readiness scales, such as the DOE’s Technologies Readiness Levels
(TRL) (DOE 2011). Each readiness stage and its rough TRL equivalent are described below.
1. Early stage R&D refers to technologies that are conceptual in nature and still require additional
basic science and applied research to validate analytical predictions. This category is roughly
equivalent to TRLs 1–3 (DOE 2011).
2. Proof of concept describes the stage where individual components and/or the entire system has
been tested in a laboratory and gradually scaled up to prototype-scale technology with all the
3
Hydrogen is not included in this table because it is not a form of electricity generation, in this case.

19
capabilities of the eventual commercial model. This category is approximately equivalent to
TRLs 4–6 (DOE 2011).
3. Pre-commercial demonstration technologies take the design validated in the proof-of-concept
stage and assess the scaled-up system in field test- or real-world conditions. This category is
equivalent to TRLs 7–8 (DOE 2011).
4. Commercially proven denotes a technology that has been deployed for commercial energy
generation and is qualified to operate under a full range of real world operating conditions. This
category is roughly equivalent to TRL 9 (DOE 2011).
1.3.2.4 Technology Cost
Cost data for nascent technologies is difficult to obtain because commercial costs must be extrapolated
from earlier readiness stages where the costs are high. This type of cost calculation was not performed in
this study. Instead, we relied on published industry data to report life cycle cost ranges. In general, the
more mature technologies, such as offshore wind, had more accurate cost data. For several of the
technologies, a lack of empirical data made it difficult to validate the cost assumptions, which may have
introduced additional uncertainty in some cases. For most technologies, published industry cost data
showed a wide range and were often dismissed from further analysis if the methodology could not be
verified from the documentation or if the assumptions did not agree with conventional wisdom. For
example, cost of energy for technologies that did not account for operation and maintenance were
considered incomplete and could not be used. The sources that were used to determine ocean renewable
energy cost data are summarized in Table 3.
Table 3. Cost Data Sources for Each Renewable Technology
Technology Source
Offshore wind NREL (2017a); Moné et al. (2017)
Wave energy
IEA-OES (2015); Neary et al. (2014);
Lewis et al. (2014)
Tidal energy
IEA-OES (2015); Neary et al. (2014);
Lewis et al. (2011)
Ocean current
IEA-OES (2015); Neary et al. (2014);
Lewis et al. (2011)
Offshore solar energy Ciel & Terre (2016); Bureau of Reclamation (2016); Barbusica (2016)
OTEC
Lewis et al. (2011)
Cold water source cooling
Vega (2016); Ascari et al. (2012)
Hydrogen conversion and storage Ruth et al. (2017); Meier (2014)
1.3.3 Competing Uses and Environmental Exclusions
Historically, the ocean areas of the US have served multiple users and are home to many wildlife species.
The GOM has a long history of energy extraction from the oil and gas industry; thus, some human use
conflicts are unique to the GOM. Moreover, there may be collaborations with some of the oil and gas
infrastructure, not only in terms of supply chain advantages but also with opportunities to use the existing
oil and gas platforms to facilitate renewable energy generation or conversely, for suppling renewable
energy sources to aid in oil and gas production (i.e., energy needed to run a platform and production
processing equipment). Such collaborations are not examined quantitatively, but follow-on studies may be
warranted in some cases.

20
In DOE’s 2015 Wind Vision (DOE 2015), a Black & Veatch study of the continental US was used to
identify areas of competing-use and environmental exclusions shown in Figure 3 in red (Black & Veatch
2010). These areas include national marine sanctuaries, marine protected areas, wildlife refuges, shipping
and towing lanes, and offshore platforms and pipelines.
Figure 3. Areas with possible environmental and human use conflicts.
From a study conducted by NREL in 2016 (Musial et al. 2016), analysis was performed to calculate the
percentage of excluded areas to arrive at the total technical resource potential on a national basis. This
analysis was performed as a function of distance to shore and is shown in Figure 4.
Figure 4. Excluded resource area percentages for the US based on Black & Veatch (2010) study.
(Musial et al. 2016)
21
For example, nearly half (48%) of the available area between 0–3 nm is not considered feasible for wind
development in the technical potential calculations; likewise, 38% of the area from 3–12 nm was
excluded from the viable wind resource, and so on. The percentages in Figure 4 were applied to calculate
the offshore wind technical resources presented in Table 11 in Chapter 3. In Chapter 2, these exclusions
are also applied to the data in Figure 10 on a state by state basis for the GOM.
These percentages likely do not include all exclusions that may be required during a more rigorous marine
spatial planning process, and they may increase under more detailed analysis with full stakeholder
participation. However, “excluded area” in this case includes areas of conflicting use or areas where
coexisting use could be negotiated. Not all the area in dark red, in Figure 3, would necessarily be
excluded for offshore renewable energy development.
22
2 Offshore Renewable Energy Technology Types
In the following sections, each technology type is examined in terms of its resource adequacy, technology
readiness, and cost. To maintain objectivity and allow comparative analysis among the technologies,
resource filters were applied in a manner consistent with documented industry practices following the
methodology developed in Musial et al. (2016).
2.1 Offshore Wind Energy
Offshore wind is a renewable technology with increased global deployment and rapid cost reductions. At
the end of December 2017, there were 16,312 megawatts (MW) of commissioned capacity including all
operating offshore wind projects world-wide, most of them in European seas (Beiter et al. 2018). Offshore
wind can provide coastal states with economic benefits such as job growth, energy diversity, reduced
pollution, operational grid flexibility, and transmission congestion relief (Musial et al. 2016). Among the
technologies investigated, offshore wind is at the highest technology readiness level. This section assesses
the technical and economic viability of deploying offshore wind turbines in the Gulf of Mexico (GOM).
Most of the discussion around offshore wind energy, and the focus of this report, centers on bringing the
power generated to land, for the power grid. However, on the outer continental shelf (OCS) under the
Bureau of Ocean Energy Management’s (BOEM) jurisdiction are thousands of offshore oil and gas
facilities that are powered by diesel generators. The diesel fuel must be transported by ship or barge out to
the oil and gas platforms. It may be more cost efficient for the oil and gas industry to use wind or wave
devices to power multiple OCS platforms. This has been considered by BOEM in studies conducted by
the University of Louisiana (Kaiser et al. 2011). Though this topic is beyond the scope of this report, it is
potentially important for future feasibility assessments.
2.1.1 Offshore Wind Energy Technology Description
As passing wind collides with a wind turbine’s blades, the wind’s kinetic energy is converted into
mechanical energy as the rotating blades spin a drive shaft connected to a gearbox. The mechanical
energy in the drive shaft and/or gearbox is then converted to electrical energy using a generator (Figure
5). In many offshore wind turbines today, the wind turbines do not use gearboxes but instead are
connected to a direct-drive generator spinning at the same speed as the rotor, which varies between 8 to
15 revolutions per minute (rpm), depending on the machine size and model. These modern machines
eliminate the gearbox to reduce the number of moving parts and minimize maintenance costs.

23
Source: DOE: Wind Energy Technology Office
Figure 5. How a wind turbine generates electricity.
Offshore wind turbines have over twice the power output as land-based wind turbines and are still
increasing in size as the industry matures. The average output capacity of an offshore wind turbine today
is over 4 MW, but turbine sizes of 8 to 9 MW are being installed in some projects. Based on analysis
conducted by the National Renewable Energy Laboratory (NREL), offshore wind may be cost
competitive in the GOM by about the 2030 timeframe, and turbines could be 12 to 15 MW in capacity
with rotor diameters exceeding 200 m (656 ft) (Beiter et al 2017)
4
. Mature offshore wind plants have
turbines arranged in arrays of 400 MW to 800 MW per project for large scale power generation (40–80
turbines per wind plant). The turbines are connected to an offshore substation located near the wind farm,
and the aggregated power is transmitted to shore via a high voltage subsea cable. A schematic of a typical
offshore wind plant is shown in Figure 6.
4
A more detailed assessment of this potential will be conducted later as part of this study.

24
Figure 6. Schematic of a typical offshore wind farm.
Source: Siemens Gamesa Renewable Energy, Inc.
Offshore wind can be divided into two technology types that relate primarily to water depth; fixed-bottom
systems and floating systems (Figure 7):
• Fixed-bottom offshore wind systems are usually deployed in waters shallower than 60 m (196
ft) and are attached to the seafloor using a rigid substructure. Substructure types and their
respective share of the market include: monopole (80%), gravity base (5%), jacket (2%), tri-pile
(3%), high-rise pile cap (4%), suction bucket (0%), and tripod (6%) (Musial et al. 2017). The
costs, benefits, and technical risks of each substructure type depend on the project’s location and
environmental conditions. Currently, fixed-bottom offshore wind systems make up almost the
entire commercial offshore wind market.
• Floating offshore wind systems are expected to be deployed in water depths between 60 to
1,000 m (196 to 3,281 ft). Turbines are mounted on a variety of buoyant platform types and
secured to the seafloor using mooring lines and anchors. Although the first multi-turbine
commercial floating wind plant was deployed off Scotland in 2017, approximately 10 other
floating pilot projects with different platform technologies are under construction or planned for
construction in the near future, totaling over 200 MW (Musial et al. 2017). In addition to
accessing deeper water depths, floating wind technology potentially eliminates the need for
developers to rent costly specialized lift vessels during the installation process because the
systems can likely be constructed in port and towed to the project site by tugs.

25
Figure 7. Offshore wind technologies: fixed-bottom foundation (left) and floating foundation (right).
Photo Credits: Dennis Schroeder, NREL (left) and Senu Sirnivas, NREL Image Gallery number 27598 (right).
2.1.2 Offshore Wind Energy Resource Potential
NREL’s 2016 Offshore Wind Energy Resource Potential for the United States found that the GOM
possesses approximately 15% of the U.S.’s gross offshore wind energy potential and 25% of the country’s
technical offshore wind energy potential (Musial et al. 2016). Figure 8 illustrates average annual wind
speeds over the gross resource potential area. The GOM’s gross offshore wind capacity potential is the
amount of power that could be produced in the GOM before technology filters, economic filters or siting
considerations (e.g., areas where protected species migrate, shipping lanes) are applied. The gross
resource potential is important to quantify because technology innovation and other factors in the future
could change the technical resource filters, but the gross potential is likely to remain the same. There are
1,872 gigawatts (GW) of gross offshore wind resource capacity. The resulting gross energy production
potential is 6,376 terawatt hours per year (TWh/yr) assuming a hub height
5
of 100 m (328 ft), a resource
area extending 200 nm offshore
6
, and a capacity array power density of 3 MW/km
2
(Musial et al. 2016).
Figure 9 displays the areas and wind speeds for the technical potential of the GOM after applying the
technology filters. Consistent with Musial et al. (2016), exclusions applied to determine technical
potential include filtering out wind speeds less than 7 m/s (15.7 mph) and water depths greater than 1,000
m (Table 2). Filters were also applied to reduce the technical resource potential for competing use areas.
These filters were described earlier in Section 1.3.3 and Figure 4. Applying average wind speed
7
, max
water depth
8
, and land-use/environmental considerations, the GOM’s technical offshore wind resource
potential by capacity is 508 GW, with a technical energy resource potential of 1,556 TWh/yr (Musial et
al. 2016).
5
A 100 m (328 ft) hub height was selected because it reflects the typical system expected to be deployed in the United States (US)
within the next five years and is consistent with the most recent resource assessments (Musial et al. 2016).
6
200 NMnm is the limit of the US Exclusive Economic Zone (EEZ).
7
Areas with wind speeds lower than 7 m/s (15.7 mph) were excluded because current offshore wind technologies may not be able
to economically generate electricity at lower wind speeds in the foreseeable future (Schwartz et al.2010).
8
Although there is no hard technology limit, areas with water depths greater than 1,000 m (3,281 ft) were excluded because 1,000
m (3,281 ft) is assumed to be the current limit that floating platforms can be deployed.

26
Figure 8. Average annual wind speeds at a hub height of 100 m (328 ft) in the GOM for the gross resource
area.
Figure 9. Average annual wind speeds at a hub height of 100 m (328 ft) in the GOM for the technical resource
area.

27
A state-by-state breakdown of the GOM’s technical offshore wind resource potential was divided into
water depths greater than and less than 60 m (197 ft) to distinguish between technologies for fixed-bottom
and floating wind (Figure 10). It is important to note that Florida, Texas, and Louisiana rank second,
third, and fourth, respectively in national state by state offshore wind technical potential
9
. Note that the
Florida offshore wind resource shown in Figure 10 only includes the resource area on the GOM coast.
Figure 10. Technical offshore wind resource potential by state in the GOM.
2.1.3 Offshore Wind Energy Technical Readiness
Due to significant global deployment levels and industry experience, offshore wind is the most mature
technology investigated in this study, yet it still carries several technical risks unique to the GOM that
may require further technology development including:
• Hurricanes: The GOM regularly experiences hurricanes that bring increased wave height and
extreme winds (Kaiser 2008). Offshore wind developers may have to create specialized designs
that ensure turbines, towers, blades, and substructures can withstand these extreme weather
events. Using the proven practices of the oil and gas industry, substructures for offshore wind
turbines can be designed with a fairly high degree of confidence, although wind turbine designs
may have to be adapted if local conditions exceed current design specifications given by the
governing International Electrotechnical Commission (IEC) standards. However, the GOM is not
a unique region for experiencing hurricanes, with the US Atlantic region also prone to such
extreme storm events. Thus, advances in designs currently implemented in the Atlantic would
likely apply to the GOM.
• Lower Wind Speeds: Relative to Europe or US offshore wind sites in the North Atlantic, the
GOM has lower annual average wind speeds (similar to South Atlantic) that may lead to new
turbine designs optimized to operate in these conditions. Features may include increased rotor
diameters, lower solidity blades, and more intelligent control strategies for extreme load
mitigation.
• Softer Soils: The OCS has softer soils compared to other regions where offshore wind
development has occurred. This may increase the weight and cost of substructure design.
9
This rank holds true only if all the resource for Florida is counted, including the Atlantic resource, which is technically not part of the
GOM.

28
Although these risk factors may be significant, other benefits, such as lower average sea states and
warmer ocean waters, may increase turbine accessibility, lower operation and maintenance costs to help
offset these factors.
2.1.4 Offshore Wind Energy Economics
Exact offshore wind project costs vary by location and are impacted by water depth, distance to shore,
wind resource, wave regime, seabed conditions, prospective staging ports, inshore assembly areas,
potential interconnection sites, environmental sensitivities, and competitive use areas (Beiter et al. 2016).
Additionally, a project’s potential profitability and/or viability are impacted by wholesale electricity
prices, market marginal costs, capacity credit, and capacity payment.
For the GOM, NREL’s geospatial cost model
10
was used to estimate levelized cost of energy (LCOE) for
offshore wind. The LCOE represents on a per energy unit basis, a technology’s lifetime costs (Capital,
O&M, and Financial) divided by its expected lifetime energy production. In 2015, LCOE ranged from
$140/MWh–$385/MWh. Ranges of $105/MWh–$206/MWh, and $90/MWh –$185/MWh were predicted
in 2022 and 2027 respectively (Beiter et al 2016). Table 4 shows the amount of cumulative offshore wind
capacity that could be deployed at various LCOE thresholds in 2015, 2022, and 2027 as predicted using
the NREL geospatial cost model.
Table 4. Offshore Wind Economic Potential in the GOM
Year
LCOE
Cumulative Capacity (GW)
Fixed-
bottom
Floating Total
2015 <$150/MWh <10 0 <10
2022
<$150/MWh
<$125/MWh
120
40
30
0
150
40
2027
<$150/MWh
<$125/MWh
<$100/MWh
200
150
40
300
100
10
500
250
50
The net value of an offshore wind project is defined as the difference between the LCOE and the
Levelized Avoided Cost of Energy (LACE). LACE is the metric used to capture the value of electricity
generation to the system (e.g., the grid) over the course of a technology’s expected lifespan that measures
how much “other” energy generation from other sources is avoided. Regional maps of the GOM show
spatial values of LCOE and the net value of offshore wind (Figure 11). These results from Beiter et al.
(2017) indicate that most modeled sites had a net value near or below zero dollars, meaning that project
costs exceed the levelized avoided cost in 2027 necessary for economic competitiveness without
subsidies. A project is generally considered to have economic potential if it has a net value greater than
$0/MWh.
10
For more information on NREL’s geospatial cost model, see Beiter et al. (2016)’s A Spatial Cost-Reduction Pathway Analysis for
U.S. Offshore Wind Energy Development from 2015–2030.

29
Figure 11. Regional map of levelized cost of energy (LCOE) (left) and net value (right).
The Beiter et al. (2017) findings reflect 2016 costs assumptions and do not fully capture recent cost
reduction trends in Europe or the uncertainty of future cost declines. Cost reductions are being realized
due to innovations such as larger rotors (low specific power), up-scaling of turbines and project size,
maturing supply chains and infrastructure, and risk reduction resulting in lower financing costs due to
industry experience. Therefore, offshore wind economics in the GOM could improve sooner than 2027,
especially given the rapid global price declines. Under some aggressive technology development
scenarios (e.g., 15 MW wind turbines) it is possible that some GOM sites could potentially reach
economic viability by 2030.
For this study, an LCOE range from $0.095/kWh to $0.19/kWh was used, representing the expected cost
of offshore wind for all regions of US for projects designed in 2018. But this range is probably wider than
what near term commercial projects in the northeast are likely to realize.
2.1.5 Offshore Wind Energy Summary
Offshore wind is a relatively mature technology that could utilize the significant offshore wind resource
capacity in the GOM, especially as offshore wind costs continue to decline. Depending on the location
and site conditions, either fixed-bottom or floating technologies could be deployed while leveraging the
GOM’s existing manufacturing and offshore engineering expertise. Cost assessments for offshore wind
are the most accurate of the technologies assessed because they are based on market trends from over 16
GW of offshore installations to date and models developed to assess the cost elements are derived from
actual project data. These models indicate that costs are declining faster than expected, dropping more
than 65% in just a few years. These global cost declines indicate similar cost reductions would be possible
for the GOM with some adjustments for site conditions and geospatial differences. Indications are that
cost may be approaching competitiveness without subsidies by 2030 but uncertainty about the rate of
technology advancement and other market factors make the exact year difficult to predict. It should also
be noted that the infrastructure and supply chains for offshore wind are compatible to the oil and gas
industry already established in the GOM. Markets for offshore wind in the North Atlantic are now
accelerating rapidly and it is likely the offshore wind industry will invest over $20 billion in the next
decade, some of which will help bolster the GOM infrastructure in advance of GOM deployments.

30
2.2 Wave Energy
Wave energy is a new renewable technology with global interest, especially in Europe, the US, Asia and
Canada. Wave energy can potentially provide coastal communities with economic benefits such as job
growth, energy diversity, operational grid flexibility, and transmission congestion relief. However, its
development is at a very early stage, and no commercial installations yet exist. Among the technologies
investigated, wave energy is at a relatively low technology readiness level and low wave climates make
its utility scale use in the GOM unlikely for the foreseeable future. This section assesses the technical and
economic viability of deploying wave energy in the GOM.
Most of the discussion around wave energy focuses on bringing the power generated to land, for the
power grid. However, there may be applications for wave energy to help power thousands of offshore oil
and gas facilities on the OCS under BOEM’s jurisdiction, that are currently powered by diesel generators.
This possibility has been considered by BOEM in studies conducted by the University of Louisiana
(Kaiser et al. 2011) and is beyond the scope of this report, but it is potentially important for future
feasibility assessments.
2.2.1 Wave Energy Technology Description
Ocean surface waves are generated by wind passing over the ocean surface. The friction between the
wind and ocean surface causes energy to be transferred from the faster moving air to the surface layer of
the ocean. Wave development depends on the length of ocean, or “fetch,” over which the wind blows in a
constant direction. Longer fetches with higher wind velocities will produce larger waves. Waves can
travel thousands of miles with little energy loss and can combine with waves from storms and other wind-
driven events to create very energetic seas. The energy of ocean waves is concentrated at the surface and
decays rapidly with depth.
The ocean water does not travel with the wave, but instead moves in an orbital motion as the wave passes
(Figure 12). This creates two types of energy that can be harvested: 1) the kinetic energy of the particles
moving in their orbits, and 2) the potential energy caused by the change in sea surface height. There are
many unique characteristics to wave energy that could provide early forecasts to allow utilities to
optimize power production including the fact that the relationship between wind and waves is known, that
waves do not dissipate rapidly once they are formed, and finally that their speed and direction of
propagation is deterministic.
Figure 12. Behavior of water particles in a wave propagating in deep water.
Source: Exploring Our Fluid Earth (2015)

31
Unlike some renewable energy technologies, like wind energy, wave energy converters (WECs) have not
converged to a common archetype for absorbing the wave energy or for converting the energy to
electricity (i.e., power take-off
11
), and many variants exist. The following sections describe some of these
variants:
• Attenuators are long in comparison to the incident wavelength and are composed of multiple
rigid bodies connected at their ends by hinged joints (Figure 13). The devices orient themselves
in the direction of wave travel and extract energy by resisting the relative pitching between the
device bodies. New concepts for wave attenuator technologies use continuous tubes that extract
power from the deformation of the device body as waves pass over it (Figure 14).
Figure 13. Multi-segmented, hinged wave attenuator technology.
Source: NREL (2018)
Figure 14. Continuous tube attenuator technology.
Source: NREL (2018)
11
The power take-off (PTO) of a wave energy converter is the mechanism with which the absorbed energy by the primary converter
is transformed into useable electricity. Source: Heller et al. (2010).

32
• Point absorbers are smaller than the incident wavelength and can capture energy from a wave
front larger than the physical dimension of the device (Figure 15). Point-absorbers typically
extract energy through a heaving or pitching motion, or a combination of both. There are both
floating and submerged point absorber concepts.
Figure 15. Wave point absorber technology.
Source: NREL (2018)
• Oscillating water columns use a partially enclosed volume of water that is driven upwards and
downwards in a chamber by the external waves (Figure 16). Energy is extracted as the water
column forces air within the enclosure in and out across a turbine.
Figure 16. Oscillating water column technology.
Source: NREL (2018)

33
• Overtopping technologies use a structure to focus and amplify waves before overtopping into a
reservoir (Figure 17). The reservoir fills above the ambient sea level. Gravity drains water from
the reservoir through a turbine before being released back to the sea.
Figure 17. Wave overtopping technology.
Source: NREL (2018)
• Pressure differential devices are located below the waves and use the pressure difference
between the crest and troughs of waves (Figure 18). On one side, the higher pressure of the crest
causes a device to compress and on the other side, the lower pressure of the trough causes the
device to expand. Power is extracted as air flows between the chambers.
Figure 18. Wave pressure differential technology.
Source: Goodwin and Hildenbrand (2013)
• Surge converters are devices, typically flaps, which are oriented perpendicular to the direction of
wave propagation and move forwards and backwards with the water motion (Figure 19).

34
Figure 19. Surge converter technology.
Source: NREL (2018)
2.2.2 Wave Energy Resource Potential
The gross wave energy resource is specified as the annual average power per meter of wave crest width,
which can be approximated as power per meter of coastline. This is the gross power contained in the
waves themselves, but the actual energy that could be turned into electricity is substantially less due to
efficiency limitations of the device, and conflicting use and environmental restrictions along the coastline.
Waves are relatively energy-dense. Typical commercial sites considered for development at this early
stage of the industry have an average annual wave energy flux of 30–35 kW/m. Such sites can be found
for example in the Pacific Northwest, could provide significant power to coastal communities (NREL
2017b). The global wave resource varies from less than 10 kW/m to over 120 kW/m, depending on
location (Figure 20).
Figure 20. Global wave mean power density.
Source: Soares et al. (2014)

35
For the GOM, the wave flux from the Texas-Mexican border to the Florida Keys was determined using
data from the NREL marine hydrokinetic (MHK) atlas (2017b) (Figure 21). Note that the map shows
only the available data from the MHK data base (DOE 2017), which extends up to 50 nm from shore but
does not cover the entire resource area that theoretically extends to the EEZ. However, this data limitation
does not affect the estimation of gross wave resource potential. This is because the gross wave resource
was calculated by multiplying the average annual wave energy flux along a state’s coast by the length of
the coastline at the 50m isobath, which is well within the data domain (Table 5). The omni-directional
wave energy flux is a sum of wave energy irrespective of direction and is always larger than the contour-
normal wave energy flux which is the sum of the incident wave energy crossing perpendicular to a depth
contour
12
. Both quantities are important depending on the type of wave energy technology being
considered. The best wave resource is along the south Texas coast but does not exceed 8 kW/m. The wave
resource decreases moving to the east in GOM and is the lowest off the west coast of Florida. Note that
this gross potential is the total annual wave power contained in the wave resources but does not represent
the energy that can be extracted. For the GOM, the total gross resource wave energy resource potential
was determined to be approximately 3.1 GW, as calculated along the 50 m isobath.
The technical potential is calculated from the gross resource potential and includes only the resource that
can reasonably be developed with existing technology. The wave energy industry estimates that a 10
kW/m resource is an appropriate minimum threshold (Kilcher and Thresher 2016). As technology
improves and lower wave sites are exploited, it is possible that this limit could be lowered. Based on the
10 kW/m filters recommended, zero wave energy technical potential was found within the GOM (Kilcher
and Thresher 2016), which indicates that the GOM’s wave energy resource would not likely be
economical using today’s technology.
Figure 21. Gross Wave Resource in the GOM.
12
Note that the 50 m (164 ft) isobath does not cross the Mississippi state boundary which made the standard methodology used flux
calculation impossible for this state. The wave flux for Mississippi was approximated to be 1.8 kW/m.

36
Table 5. Wave Resource Potential in the GOM
State
Length of 50 m
(164 ft) Isobath
(km/mi)
Average
Annual Omni-
Directional
Wave Energy
Flux (kW/m)
Average
Annual
Contour-
Normal Wave
Energy Flux
(kW/m)
Gross Wave
Energy
Resource (MW)
Technical
Wave Energy
Resource
>10 kW/m
(MW)
Florida 829 (515 mi) 3.9 1.6 1,400 0
Alabama 83 (52 mi) 4.8 2.7 200 0
Mississippi 0 1.8 N/A 0 0
Louisiana 556 (345 mi) 5.4 2.9 1,600 0
Texas 536 (333 mi) 7.1 4.2 2,300 0
Total 2004 (1,245 mi) 5.24 2.7 5,500 0
2.2.3 Wave Energy Technical Readiness
Ocean wave energy technology development began in the mid-1970s in response to the oil crisis, but
wave technologies today are still pre-commercial with respect to their technical maturity. This slow pace
can be attributed to the harsh environment in which wave energy converters operate and the complex
regulatory requirements imposed on device deployments. These limitations impact the speed of
deployment and the rate of technology learning by the industry. Only a few technology deployments have
achieved sustained operation of one year or longer and demonstrated predictable energy production. As a
result, the technology for wave energy remains at a relatively low state of technology readiness and, much
like in the early days of wind, there has been limited convergence in optimizing device architectures.
Because new concepts are still being explored to find reduced cost designs and few technologies have
operated for more than a year with meaningful energy production, it is difficult to assess critical aspects
of reliability and performance. Therefore, wave energy technology needs significantly more experience
to design better concepts, and to demonstrate predictable reliability and efficiency before it can be
considered commercially ready.
2.2.4 Wave Energy Economics
Though wave energy holds substantial promise in many coastal areas where incident wave resource is
adequate, wave technologies are still at the prototype stage, which means current costs are significantly
higher due to its nascent stage of development. In addition, the cost of energy decreases with a higher
wave energy resource potential. In some of the best resource areas (e.g., 30 kW/m), costs are estimated to
be $0.70/kWh (Jenne et al. 2015), with some estimates exceeding $1.00/kWh (IEA-OES 2015; Neary et
al. 2014). Research and development trends aim to significantly increase energy extraction efficiency and
optimize mechanical designs through advanced controls, increased understanding of loads, and targeted
innovations to increase energy production and reduce material costs. IEA-OES (2015) estimates that the
first commercial array of wave energy convertors may be installed between 2020 and 2030 at a cost of
energy between $0.12 to 0.48/kWh. However, for the GOM the cost would likely be much higher because
of the low average wave energy flux potential.
37
2.2.5 Wave Energy Summary
Wave technology is at an early prototype stage with very few successful demonstrations of power
performance or reliability. In addition, the wave climate in the GOM is poor compared to other regions of
the US, with no states showing resource above the minimum recommended threshold of 10 kW/m of
wave crest length. The combination of low maturity and poor resource make the cost of wave energy very
high using the technologies that are available today. As such, it is likely that for the GOM, commercial
viability is not likely for the foreseeable future. It is recommended that wave energy assessments be
revisited periodically to evaluate possible changes to the technical resource.
2.3 Tidal Energy
Tidal energy is a renewable technology with global interest, especially in Europe, the US, Asia, and
Canada. Tidal energy can potentially provide some coastal communities with energy diversity,
operational grid flexibility, and transmission congestion relief. Due to the nature of the resource, tidal
energy in the US is generally confined to state waters and is not usually under the jurisdiction of BOEM.
Among the technologies investigated, tidal energy is at a higher technology readiness level than wave
energy, but its limited resource potential makes broad utility scale use in the GOM states unlikely for the
foreseeable future. This section assesses the technical and economic viability of deploying tidal energy in
the GOM.
2.3.1 Tidal Energy Technology Description
Tides are characterized by the rise and fall of the ocean surface height primarily caused by the
gravitational interactions of the earth, moon and sun and the rotation of the earth. Tidal current used for
power production typically occurs between two bodies of water connected by a narrow land passage.
Therefore, in the US, most tidal energy sites are found near shore and tend to be in state waters. As the
sea surface changes on the seaward side of the passage, water flows through the passage to equalize the
height of the other body of water, such as a bay, estuary, or river. Because tides rise and fall, currents
flow in and out of the inland body of water. It is the kinetic energy in the tidal current that is generally
considered the useful energy resource. As the speed of the tidal current increases, the energy extraction
potential also increases. Tidal currents move inland during flood tides, seaward during ebb tides, and no
current exists during slack tides, when the bodies of water have equal height. Tidal heights change daily,
with up to two cycles per day, depending on geodetic location, coastline and other factors. Maximum and
minimum tidal heights and tidal current speeds, change throughout the year based on the relative location
of the sun and moon. Though tidal flows are cyclic in nature (Figure 22), they are extremely predictable,
and flow rates and hence power production, can be forecast decades ahead.

38
Figure 22. Example time series of tidal speeds for Boca Grande Pass, Charlotte Harbor, Florida.
Tidal current speed is primarily determined by the range of tidal height, size of the passage (width and
depth), and size of the water bodies. Larger values of each of these variables results in higher current
speeds. The primary method used to extract energy from a moving tidal flow is water current turbines
located under the surface that convert the kinetic energy of moving water to electricity.
Tidal power has been used for centuries to produce mechanical power from paddle wheels to mill grain.
In 1966, the first commercial scale tidal energy plant was installed in the estuary of the Rance River in
Brittany, France (Figure 23). It uses tidal barrage technology in which a dam-like structure is placed
across the tidal flow, allowing water to flow into a bay from the sea during a flood tide. During ebb tide,
sluice gates are shut, and water flow is diverted through turbines to generate power. Though it is possible
to generate power during a flood tide, it is much less efficient. Because of the significant impact to the
environment, tidal barrage technology has not been pursued in the US.
-2.5
-2
-1.5
-1
-0.5
0
0.5
1
1.5
2
-2.00 8.00 18.00 28.00 38.00 48.00
Current Speed [m/s]
Time [days]
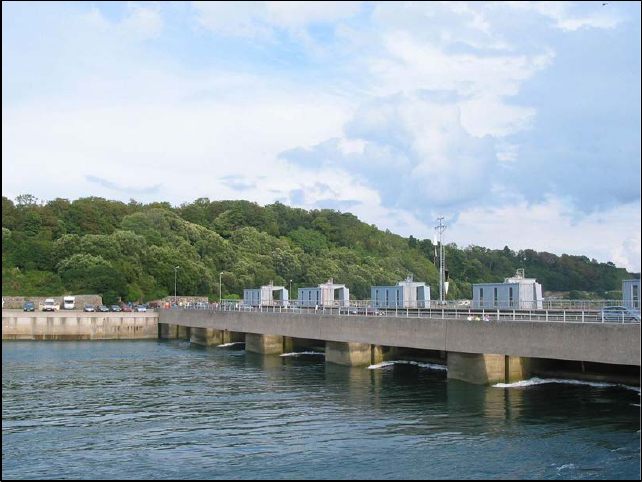
39
Figure 23. Tidal barrage in the Rance River in Brittany, France.
Source: Energy BC (2017)
Modern tidal power generating turbines operate on the same principles as wind turbines. As the moving
water passes the current turbine’s blades, the kinetic energy of the moving tidal current is converted into
mechanical energy by rotating blades that spin a drive shaft. The mechanical energy in the rotating drive
shaft is typically passed through a gearbox and converted to electrical energy using a generator. There
have been many pre-commercial tidal turbine deployments in North America, Europe and Asia, but these
have been limited to single units or small arrays. Some examples include Verdant Power’s East River
project in New York City (Figure 24) and Atlantis Resources project in Pentland Firth, Scotland (Rooney
et al. 2013; MeyGen 2017).
The following two primary tidal turbine archetypes have been developed, and have direct analogues in
wind energy.
• Horizontal axis turbines are similar to today’s commercial three-bladed wind turbines. Turbine
rotors, either with two or three blades, are mounted to a horizontal shaft that is aligned with the
water flow. A central hub houses the gearbox and generator. Because tidal flows can reverse flow
direction twice a day, the rotor must be able to rotate in both directions or yaw the entire nacelle
to align with the direction of flow. Other models are designed to accommodate flow direction
reversals by pitching the blades 180 degrees instead of yawing the nacelle. In many tidal flows,
the ebb and flood tides are not exactly 180 degree apart because of curves in the channel
geometry, thus limiting the use of the blade pitching technologies. Tidal turbines typically operate
in restricted passages that limit the height and width of the turbines. Because the flow capture
area of horizontal axis turbines is circular, horizontal axis tidal turbines do not scale well in
shallow water flows but operate best in larger water channels that are at least 10 m deep.

40
• Cross-flow turbines are analogous to vertical axis wind turbines. In this archetype, blades are
mounted lengthwise to a central shaft that is orientated perpendicular to the current. One or more
sets of blades are connected to a pod that contains the gearbox and generator. Unlike horizontal
axis turbines, cross flow turbines can generate power without re-orientating the blades flow
reversals during flood and ebb tides, providing some simplicity in the design. However, a cross
flow turbine’s energy capture decreases when the ebb and flood flow directions are not aligned.
Because cross-flow turbines can be scaled in both length and height, they can be tailored to fit
both shallow and deep flows.
2.3.2 Tidal Energy Resource Potential
Gross tidal energy resources are characterized by the average annual energy in a flow past a fixed location
in a channel, expressed as power per cross-flow area. However, the extractable tidal resource is
substantially less due to various economic, environmental, and technical constraints. Commercial tidal
developers look for a gross resource greater than 0.5 kW/m
2
over a cross sectional area with sufficient
potential for utility scale generation of at least 10 MW (Kilcher et al. 2016). In the GOM, tidal height
variations are small, there are few tidal channels, and connected bodies of water tend to be small. Six sites
in the GOM were found to have more than 0.5 kW/m
2
, including one site in Texas and five sites in
Florida, mostly in the Florida Keys (Table 6; Figure 24).
Table 6. Tidal Energy Resource Potential for GOM Sites
Site Description State
Maximum
Power
Density
(W/m2)
Net Technical
Resource
Potential
(MW)
Matagorda Bay Texas 900 0.8
Charlotte Harbor Florida 1,100 8.8
Boca Grande Channel Florida 560 27.9
Key West Channel Florida 1,000 13.6
Spanish Harbors Florida 1,000 7.9
Seven Mile Bridge Florida 2,300 26.6
Total - - 85.6

41
Figure 24. Potential tidal energy sites within the GOM and Florida Keys.
42
2.3.3 Tidal Energy Technical Readiness
Tidal energy technologies remain predominantly at a pre-commercial prototype level but are advancing
faster than wave technologies toward commercial scale. In the United Kingdom, the first commercial
scale project is under development in the Pentland Firth, with 269 turbines and a total installed capacity of
398 MW. The first Pentland Firth turbine is expected to be deployed in 2020 (MeyGen 2011; Power
Technology 2017). Deployments of pre-commercial systems in the US have been limited to tidal flows in
the East River in New York and Cobscook Bay, Maine. Much like the first wind turbines, tidal
technologies need to overcome reliability issues in early designs to achieve expected lifespans and lower
operation and maintenance costs. Poor accessibility is an added challenge in tidal flows because slack
tides are short and offer limited windows for maintenance. With experience, better design tools and
validation, more robust designs are expected to be developed.
2.3.4 Tidal Energy Economics
The cost of tidal turbines is driven by many factors, including the size of the machines, the number of
machines, and the availability of quality resource. Early estimates indicate that a 10 MW array could have
an LCOE of approximately $0.22/kWh and a 100 MW array could have an LCOE of around $0.15/kWh.
However, these costs can only be achieved with sufficient industry deployment to gain experience and to
take advantage of economies of scale. It is estimated that at least 1,000 MW of installed tidal power
would needed to gain this experience, which is likely more than a decade away (IEA-OES 2015; Neary et
al. 2014).
2.3.5 Tidal Energy Summary
Within the study domain, only six suitable tidal energy sites have been identified with a total potential of
85.6 MW; most are in the Florida Keys. Based on current industry information, these sites are not likely
to be cost competitive with conventional electric generation for at least 10 years. Small scale projects may
be possible, but the potential for significant commercial scale tidal generation within the GOM and the
Florida Keys is unlikely, primarily due to low overall resource availability.
2.4 Ocean Current Energy
Ocean currents can be a renewable energy source that uses technology similar to underwater tidal turbines
but is less constrained by channel geometry. It has been researched primarily in the US, where potential
resource has been identified in the Florida Straits, in the Gulf Stream east of Miami. Ocean current energy
can potentially provide significant power to a few coastal communities where the resource potential
corresponds with the load. Currently its development is at a very early stage, with no installed projects.
Logistics and regulatory concerns present significant challenges to initial implementation. As such, ocean
current energy is at a low technology readiness level. This study focuses on whether there might be other
opportunities not yet identified for deployment in the Loop Current and the Florida Current south of the
Florida Keys. It assesses the technical and economic viability of deploying ocean current energy in these
GOM currents and focuses on bringing the power generated to land, for the power grid. It is beyond the
scope of this study to consider using ocean current turbines to power some of the thousands of offshore
oil and gas facilities on the OCS under BOEM’s jurisdiction.

43
2.4.1 Ocean Current Energy Technology Description
Harnessing the Florida Current was first seriously considered in the 1970s when DOE sponsored the
Coriolis Program that aimed to extract power using a very large ducted fan turbine (Lissaman and Radkey
1979). Because of these large water depths, ocean current energy converter concepts have shifted away
from ducted turbines towards horizontal axis turbines that can vertically maneuver within the water
column from a fixed mooring position (VanZwieten et al. 2006). These turbines use buoyancy or lifting
surfaces to suspend them above the sea floor and eliminate the need for costly support structures.
This technology (Figure 25) operates on the same energy generation principle as a horizontal axis wind
turbine. As the moving water passes the turbine’s blades, the current’s kinetic energy is converted into
mechanical energy as the rotating blades spin a drive shaft connected to a gearbox. The mechanical
energy in the drive shaft and/or gearbox is then converted to electrical energy using a generator. Though
the concept in Figure 25 has undergone small scale testing in tow tanks, it has not yet been demonstrated
in the ocean. Because the density of seawater is approximately 850 times greater than air, an ocean
current turbine operating in a water current with a speed of 1 m/s (2.2 mph) can produce the same power
as a similar size wind turbine operating at a wind speed of 9 m/s (20.1 mph) (National Research Council
2013).
Figure 25. Horizontal axis ocean current turbine using lifting surfaces for position in the water column.
Source
: Neary et al. (2014)
2.4.2 Ocean Current Energy Resource Potential
The Loop Current is the only open-ocean current within the GOM that has current velocities high enough
to support electric power generation. The Loop Current is part of the North Atlantic Gyre circulation,
which is primarily driven by the trade winds. It is the most westerly portion of the North Atlantic gyre
and accounts for about 20% of the mass flow of the Gulf Stream. The Loop Current enters the GOM
through the Yucatan Channel, where it flows northward then turns clockwise and follows the continental
slope offshore Florida as it flows southward until it turns east and exits through the Straits of Florida
where it forms the Florida Current. The highest speeds of the Loop and Florida Currents occur near the
ocean surface and decrease with depth (Raye 2002). A snapshot of the current velocity forecast for Sept
14, 2017, provided by NOAA, shows the variability of the Loop Current (Figure 26).

44
Figure 26. GOM Loop Current forecast by NOAA on September 14, 2017.
Source: National Weather Service (2017).
The Loop Current has a volume transport in the range of 24 to 30 million m
3
/s (Athié et al. 2012), which
is about 24 times the total freshwater river flows of the world. No studies were found that estimate the
energy production potential from the Loop Current. Estimates for the Florida Current in the Straits of
Florida provide some insight, assuming the energy flux is conserved between the GOM and the Straits of
Florida. Based on field measurements and ocean circulation models, it is estimated that the total power
flux of the current in the Straits of Florida is between 14 GW (National Research Council 2013) and 25
GW (Von Arx et al. 1974; Duerr and Dhanak 2012). Because the Florida Current is an extension of the
Loop Current, it provides a good basis to estimate the gross energy potential within the GOM. Within the
Straits of Florida, estimates of technical resource potential vary widely from 1 GW (Von Arx et al. 1974),
1–2 GW (National Research Council 2013), 1–4 GW (Duerr and Dhanak 2012), to 4–6 GW (Haas et al.
2013). Estimating the net power potential from the Florida Current is difficult because it is a low-friction
flow that relies on a balance of the mass flow and thermohaline structures to maintain its position close to
the coast of Florida. Blockages and mixing due to placement of ocean current turbines could potentially
divert flow toward the Bahamas (National Research Council 2013). Estimates of extraction depend on
assumptions such as device type, depth limits, and device spacing.
Within the Florida Straits and Yucatan Channel, the current is geographically constrained, and
meandering is limited. However, in the GOM, the Loop Current is not geographically constrained, and it
exhibits higher spatial variability than the Florida Current. As a result, the annual average flow speeds at
fixed locations within the current area are much lower than the current maxima (Hamilton et al. 2015) and
do not increase again until the current enters the Straits of Florida near the Florida Keys.

45
The extent that the Loop Current reaches into the GOM changes frequently. It has a quasi-steady meander
that can reach as far north as the continental slope near the Mississippi Delta or can turn directly east
toward the Straits of Florida after it enters the GOM through the Yucatan Channel. The northern extent of
the current can change rapidly when an eddy is shed (Figure 27) (Hamilton et al. 2015). This schematic
roughly shows the northern and southern extents of the current along with a shed eddy. Though the Loop
Current is a continuous flow, it exhibits large inter-annual and spatial variability that limits the potential
energy capture for a given location. Because of the high spatial variability of the Loop Current, the
estimated current energy density does not exceed 500 W/m
2
(threshold for technical viability) in any part
of the defined resource area containing the Loop Current.
Figure 27. GOM Loop Current.
Source: UCAR (2011).
Figure 28 shows a map of the average annual ocean current energy densities for the GOM region. The
data were plotted using GIS data and coordinates from the MHK data base (DOE 2017). When the 1,000
m (3,281 ft) depth limit and 500 W/m
2
energy threshold are considered, virtually all the Loop Current
resource is eliminated from the viable ocean current resource within the GOM. Note that the spatial
domain for the data plotted does not go all the way to the EEZ. However, the majority of this area exceeds
the 1,000 m depth constraint (shown in Figures 30 and 31) and would be excluded from the technical
resource potential.
When the Loop Current enters the Straits of Florida along the Florida Keys, it is more constrained and
exhibits less spatial variability as it flows to the northeast. At this point, the average annual energy flux
does exceed the technical threshold of 500 W/m
2
. The highest current energy flux occurs on the eastern
boundary of the study area where the gross potential is about 3.6 GW. This estimate included a decrease
in the current velocity with depth (Raye 2002) with a maximum depth of 150 m (Raye 2002; Duerr and
Dhanak 2012). A conservative estimate of production potential is about 10% (Von Arx et al. 1974;
National Research Council 2013; Duerr and Dhanak 2012) which yields a value of 358.7 MW technical
resource potential as shown in Figure 29.

46
Figure 28. Average annual power density of the Loop Current.
Figure 29. Average annual power density of the Loop Current (technical potential showing only areas above
500 W/ m
2
).
47
2.4.3 Ocean Current Energy Technical Readiness
Ocean current turbines are still nascent technologies with no open-ocean prototype deployments yet.
Concepts have advanced to model testing at sub-scale, but many of the technical risk areas have not been
addressed, such as long mooring and electric transport cables, deployment and maintenance in a high
current, fatigue of the structure and blades, stability during slow current and mitigation of local current
reversals. Because the Florida Current has less spatially variability, higher annual average energy flux,
and is closer to load near Miami and Ft. Lauderdale, these areas are more likely to see deployments of
ocean current turbines. The Loop Current in the GOM is not likely to be considered a viable site to deploy
ocean current turbines in the foreseeable future.
2.4.4 Ocean Current Energy Economics
LCOE estimates of ocean current energy are poorly established because of the nascent state of the
technology. NREL’s reference model project estimated that a mature ocean current sector (achieved after
multiple deployments) could achieve LCOE values near $0.18/kWh for a hypothetical 50 unit 200 MW
capacity project and $0.15/kWh for a 100 unit 400 MW capacity project (Neary et al. 2014). This level of
technical maturity is unlikely in the near-term even in the Florida Straits. For the Loop Current, the
economics would be more costly because of lower power densities, intermittent currents, very deep water,
and very large distances to shore. With no experience designing, building, deploying, operating and
recovering ocean current turbines, these LCOE estimates have a high degree of uncertainty.
2.4.5 Ocean Current Energy Summary
The Loop Current in the GOM exhibits large spatial and temporal variability that leads to lower values of
average current speeds when compared to locations in the Florida Straits off the east coast of Florida.
Within the Loop Current in the GOM, the average current energy flux does not exceed the 500 W/m
2
threshold. Therefore, the resource is not considered viable in the foreseeable future considering the
current state of technology and technology forecasts. Within the Straits of Florida, 360 MW of ocean
current technical resource potential was identified. However, there are many local and global climatic and
environmental questions about the impacts of harnessing energy from an ocean gyre that must be
answered before this resource is considered viable. As a result, this technology is not likely to be viable
for commercial scale deployment in areas within the GOM or along the Florida Keys within the next 10–
20 years.
2.5 Offshore Solar Energy
Offshore solar energy has an enormous renewable energy potential but deployment is likely to be
inhibited by extreme wave conditions at most exposed ocean sites; this would likely make the cost of
support structures prohibitive. Offshore solar energy can potentially provide significant power to coastal
communities in state waters where sheltered bays and estuaries would limit extreme waves. Currently its
development has been limited to small enclosed water bodies where extreme wave heights are small.
Advanced support structures may be able to significantly increase the survival thresholds using better
engineering methods that merge offshore wind and petroleum industry know-how with solar to provide
more robust substructures. Logistics and regulatory concerns may also present significant challenges to
initial implementation, especially in congested waterways where other uses may compete. This study did
not investigate the numerous bays and inlets of the GOM; therefore, it is likely that the resource for
offshore solar energy is much greater than what is reported. It is also beyond the scope of this study to
consider using offshore solar energy to power some of the thousands of offshore oil and gas facilities on
the OCS under BOEM’s jurisdiction.

48
2.5.1 Offshore Solar Energy Technology Description
Offshore solar energy systems are an emerging application in which photovoltaic (PV) systems are
installed directly over bodies of water. Floating solar photovoltaic is a subset of that technology in which
PV panels are mounted on buoyant substructures (Figure 30). PV panel technology is similar to
traditional ground-mounted PV, except the panels rest on a platform of plastic (typically high density
polyethylene [HDPE] tubes) and stainless steel designed to float on water (Krishanaveni et al. 2016).
Floating PV platforms are linked together in arrays with designated walkways and are anchored to the
shore or bottom. The main electrical conversion equipment resides on the shore where electricity is
transmitted from the floating PV system to the grid or load via underwater cables.
Figure 30. Schematic of a floating solar system.
Source: Ciel & Terre (2016)
To date, floating solar has been installed predominantly on human-made bodies of water such as
wastewater storage ponds, reservoirs, remediation and tailing ponds, and agricultural irrigation or
retention ponds. Systems must be designed to withstand fluctuating water levels, wind and wave loads,
and other extreme weather conditions. Saltwater applications pose additional challenges due to corrosion
and extreme wave conditions, with the latter exceeding practical design limits, seemingly in all open
ocean locations.
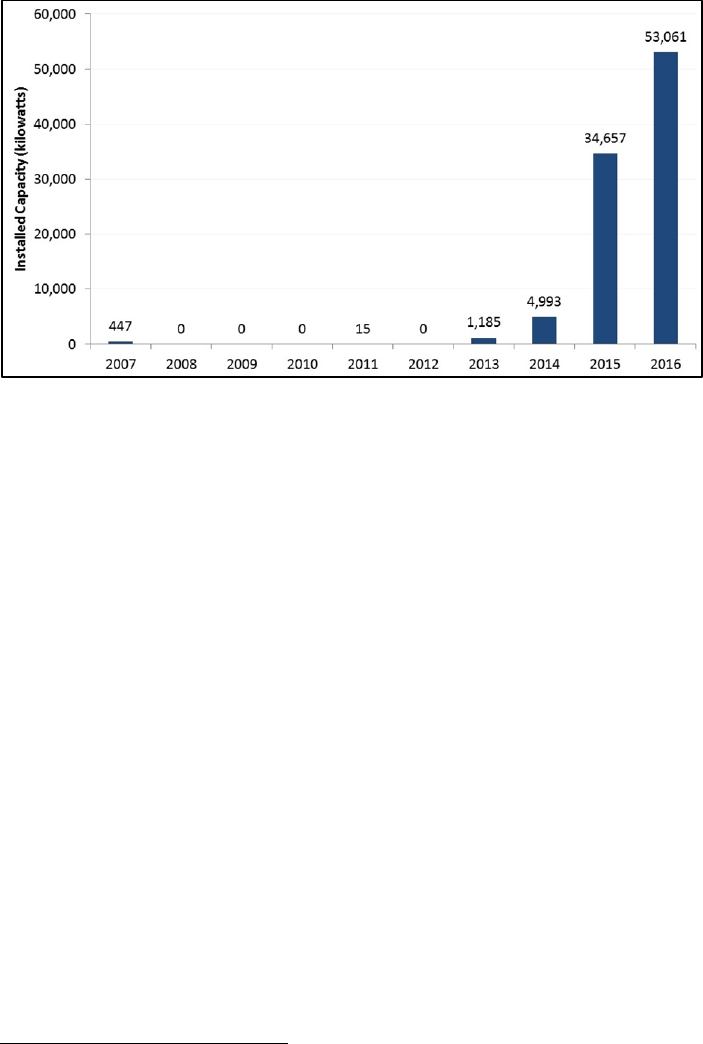
49
The first floating solar installation came online in 2007 at the Far Niente Winery in California, yet the
vast majority of existing systems (98%) became operational between 2014 and 2016 (Figure 31). As of
2016, global installed capacity was approximately 94 MW, with additional projects expected to come
online in early 2017. Japan is home to the majority of floating solar installed capacity (60%), including 70
of the largest systems in the world.
13
Floating solar systems have also been installed in more than a dozen
countries throughout Southeast Asia, Europe, North America, and the Middle East. System sizes vary
dramatically, ranging from 4 kW to 20 MW. The US has installed only a small amount of floating solar to
date.
Figure 31. Reported global floating PV capacity installed by year.
Source: Adapted from Minamino (2016).
A 2017 report indicated the floating solar market is expected to grow globally from $13.8 million in 2015
to $2.7 billion by 2025 (Grand View Research 2017). Research surrounding system performance is
relatively immature but has increased recently due to anecdotal claims of benefits for both water and
energy operations.
Reported benefits of floating solar systems include:
• PV system efficiency gains due to lower ambient temperatures underneath the panels. Empirical
research corroborates claims of efficiency gains (Choi et al. 2013).
• Reductions in unwanted algae growth
• Reduced rates of evaporation
• Lower land acquisition and site preparation costs
• Avoidance of land-energy conflicts (e.g., fuel and food)
• Conversion of unused space into a space that generates revenue
• Minimal risk to wildlife
13
Ciel & Terre is a developer of floating PV projects in Japan.

50
2.5.2 Offshore Solar Energy Resource Potential
2.5.2.1 Offshore Solar Energy Gross Resource Potential
The gross potential resource analysis method followed a series of steps which emulate the procedure for
offshore wind described by Musial et al. 2016. First, the gross offshore PV resource domain area was
defined as the area from the shore, including state waters, to the 200 nm international EEZ and the Florida
Keys. Using GIS tools, the total area was calculated to be 715,100 km².
The gross offshore PV resource capacity was calculated by multiplying the gross domain area by the array
power density. Power densities for horizontal PV arrays are driven by cell conversion efficiency, cell
packing density, and module spacing, as explained in Denholm and Margolis 2007. PV array power
density is equal to PV array power deployable per unit of land area. The array consists of individual PV
modules, and the nameplate (or peak) direct current (DC) power rating of an individual module is a
function of module efficiency and the module collector area. The module efficiency is defined under
standard test conditions (STC) of 1,000 W/m
2
solar irradiance and 25 ˚C. Typical commercially-available
silicon PV modules have efficiencies of about 10–15%, resulting in about 100–150W of peak DC output
per square meter of collector area. Module efficiencies vary by technology, with current thin-film
modules producing efficiencies of about 6–12%, while advanced silicon modules (also commercially
available) can produce efficiencies of more than 15% (US Department of Energy 2007)
14
. Module
efficiencies are expected to increase over time, which will increase the module power density and
decrease the solar electric footprint.
The total array power density depends on the array spacing as well as the individual module efficiency. If
deployed horizontally with no spacing between modules, the array power density would be equal to the
module efficiency (100–150 MW/km
2
for silicon modules). Assuming a 120 MW/km
2
power density, the
total gross resource capacity for the GOM is estimated to be 85,800 GW.
Offshore solar energy potential ranges from ~4.3 to 5.8 kWh/m
2
-day in the GOM, with energy potential
increasing towards the southeast near the Florida coast (Figure 32). Solar resource data for the GOM was
sourced from the NASA surface meteorology and Solar Energy (SSE) dataset (NASA 2008).
14
Not considered in this analysis is the use of commercially-available concentrating PV modules which have demonstrated
efficiencies of 20–26%.

51
Figure 32. Gross long term average GOM horizontal solar radiation resource.
Solar Insolation Data Source: NASA (2008).
2.5.2.2 Offshore Solar Energy Technical Resource Potential
The technical resource potential of offshore PV captures the subset of gross offshore PV resource
potential that can be considered recoverable using available technology within reasonable limits. It
considers the technical limits of offshore PV, including conflicting use, environmental constraints, and
technology limits.
Generally, technology exclusions are applied to the gross resource potential to restrict the resource area to
geographic locations suitable for the technology based on industry experience to date. Because the
floating solar industry is still in its infancy, exact technology specific exclusions are not yet available for
floating PV but it is expected that siting will gradually expand to locations with more challenging
physical conditions as industry experience grows. From NREL’s assessment, the primary technology
limitation for ocean-based solar is wave loading in extreme sea states. An offshore solar array must be
designed to withstand the extreme weather events and resulting loads where it is deployed as the
possibility of furling the panels under extreme conditions is limited. Designing solar support-structures to
survive extreme wind and wave events will drive system cost up rapidly and may prove to be cost
prohibitive in areas some areas. Existing floating solar installations in Japan have been designed for
cyclonic winds and 1 m extreme wave heights. This 1 m wave height design threshold was initially
considered for a baseline. However, in such a nascent industry as offshore solar, we considered this
design constraint to be too conservative for a technology resource threshold, given the potential for
maturation without requiring any significant technology breakthrough. As such, we chose an arbitrary
threshold of 3 m (9.8 ft) for this study; however, it is recommended that this threshold be examined more
carefully as the industry gains experience.
52
Statistics for GOM extreme wave heights have been estimated by the American Petroleum Institute (API)
(2007). It was estimated that all open ocean locations in the GOM have maximum wave heights much
greater than 3 m (9.8 ft), with 3 s wind gust values over 55 m/s (123 mph) for a 100-year return period.
The western region in general has the lowest values for maximum wave heights in the GOM, varying
from 6.5 to 9.8 m (21.3 to 32.1 ft) for 10 year and 100 year return periods, respectively (API 2007).
Based on the 3 m (9.8 ft) extreme wave height criterion, we estimate that there is currently 0 MW of
technical potential for offshore solar in federal waters of the GOM. Determining the associated costs for
floating solar technologies under extreme wind and wave conditions is beyond the scope of this study
because such technology does not exist yet. However, with any new technology, research and
development may considerably change the site suitability of this technology. Currently, the leading
developer and installer of floating solar does not recommend installing floating solar arrays in saltwater or
ocean environments due to extreme waves. The best potential for ocean-based solar may be over more
sheltered bodies of water that are found in state waters but estimating the magnitude of extreme wave
events for these areas was beyond the scope of this study. As the potential resource for near-shore solar
may be large, it is recommended that ocean based solar in sheltered bays and enclosed inland lakes be the
subject of future resource and technology studies in GOM states.
2.5.3 Offshore Solar Energy Technical Readiness
Floating solar has typically been deployed in enclosed bodies of water near developed areas where land is
in high demand with easy access to load centers. The deployment of floating solar systems in the open
ocean is a significantly more challenging technology step, which resulted in a lower value assessment of
the readiness level for offshore solar technology in this study. Generally, there are no insurmountable
technological barriers to the advancement of floating solar technologies into deeper water with larger
wave extremes. However, it is unknown how the system cost and reliability would be impacted for
designs capable of surviving larger wave and wind events.
2.5.4 Offshore Solar Energy Economics
Recently installed floating solar systems (MW scale) on inland reservoirs in California cost $1.7–1.8/W
(Ciel & Terre 2016). This cost is similar to many ground-mounted solar arrays and may represent a large
technical and economic potential for existing reservoirs, waste water treatment plants, or areas where land
is costly or unavailable. Deploying a floating solar array offshore will likely have significantly increased
costs due to the need to design the arrays to withstand much stronger wind and wave loads but not cost
data were available for this study.
2.5.5 Offshore Solar Energy Summary
Due to the extreme wave events in the GOM, ocean-based solar is not likely to be cost effective in the
open ocean or any body of water that is not significantly sheltered from extreme weather events. Floating
PV technology is relatively new and current industry experience has been mostly limited to small bodies
of water where adjacent land area is more expensive.
There may be potential for fixed bottom PV to be installed in sheltered bays or semi-enclosed bodies of
water where extreme wave heights are much lower. Extreme wave height estimates in bays or other
sheltered areas must take into account the interaction with hurricane winds, rainfall, extreme wind
direction, fetch, and surge. Future solar developers may find sheltered sites where support structures can
be designed to withstand the extreme wave conditions. It is recommended that further study of technology
and resource of ocean based solar in sheltered bays and enclosed inland lakes be conducted in GOM state
waters.
53
2.6 Ocean Thermal Energy Conversion (OTEC)
Ocean thermal energy conversion (OTEC) technology converts solar energy stored in the thermal layers
of the tropical and subtropical oceans. Thermal heat engines use the temperature difference between the
sun-warmed surface water and cold water in the deep ocean. This technology requires the movement of
large volumes of water to convert a small portion of the available energy, yielding about 2.5%–3.0% of
stored solar energy as net power after pumping and other power requirements are met (Avery 1994).
Because the gross potential resource is large, OTEC could potentially provide substantial amounts of
carbon-neutral baseload power. Under funding from DOE, open-cycle OTEC was successfully
demonstrated with positive net energy production (up to 103 kW from 255 kW gross) from 1993 to 1998
at the Natural Energy Laboratory of Hawaii Authority (NELHA) facility at Keahole Point on the island of
Hawaii (SERI 1989). OTEC has significant gross and technical potential in the GOM but remoteness of
the resource, cost, logistics and environmental concerns may present significant challenges to initial
implementation.
2.6.1 OTEC Description
The deeper tropical and subtropical oceans have steep temperature depth gradients, with warm water
overlying cold deeper water. The temperature difference between surface waters and deeper water can
reach over 25 ˚C in summer months, although usually this temperature difference exists only over water
with depths of 1,000 m or greater. However, there are some places in the world with high thermal
gradients, such as in the Florida Straits where these temperature differentials can be reached at depths less
than 300 m.
OTEC systems use the temperature difference between warm surface water and cold-deep water to
generate electricity. OTEC systems were first envisioned in the 1880s with the first proof of concept
demonstration project built in Cuba in 1930. Presently, the 100 kW OTEC facility on Kume Island,
Okinawa, Japan is the only operational OTEC facility in the world and is considered a sub-scale
demonstration project. Commercial-scale OTEC facilities would probably require a capacity of
approximately 100 MW to achieve minimum plant cost according to industry scaling studies (Ascari et al.
2012). To date, there have been no commercial scale systems built.
Many different OTEC archetypes have been investigated; some on floating offshore platforms and some
built onshore with pipelines to transport the water to and from the ocean (Vega 2016; Meyer et al. 2011;
Avery and Wu 1994). Each system uses one or a combination of thermodynamic processes to turn the
temperature difference into mechanical energy.
The closed-Rankine cycle is an example of a closed-cycle OTEC system (Ascari et al. 2012; Figure 33).
Warm water is pumped from near the surface and used to heat a working fluid, such as ammonia, which
vaporizes at a low temperature. The vapor expands and drives a turbine as it passes from the hot to the
cold side where it condenses using cold water pumped from the deep ocean. Both the warm and cold
water supply must be sufficient to supply the large volumes needed by an OTEC plant. Based on the
Lockheed 100 MW conceptual OTEC plant design, to produce approximately 1 GW (ten 100 MW
plants), a combined flow rate of 8,260 m
3
/s is needed, or about half the flow of the Mississippi River at
New Orleans (Ascari et al. 2012).

54
Figure 33. OTEC example schematic.
Source: Ascari et al. (2012)
OTEC systems can be classified as closed cycle or open cycle systems (Figure 34). The open-cycle
system pumps warm sea water into a low pressure chamber where it vaporizes, expands through a turbine,
and condenses on the cold side. In contrast, the closed cycle system pumps the warm sea water through a
heat exchanger to warm the working fluid. Both the open-cycle and closed-cycle plants use cold water
pumped from the deep ocean to condense the working fluid. An ancillary benefit is that the condensate is
freshwater that can have other uses such as agriculture and potable drinking water.
Figure 34. Schematics of closed-cycle (left) and pen-cycle (right) OTEC systems.
Source: Wikipedia (2018).

55
2.6.2 OTEC Resource Potential
OTEC resource quality depends primarily on water temperature differences in the water column, but also
on the availability of both warm and cold sources, often determined by the rate of replenishment at the
plant location via local ocean currents. Thermal differences that are higher than 18˚C (64°F) are
considered suitable for OTEC, with optimal differences of around 25˚C (77°F) or higher. OTEC plants
require access to both a large volume of warm surface water that is at least 22˚C (72°F) and a cold deep
water source (Ascari et al. 2012; Avery and Wu 1994). Within the GOM, average annual temperature
differences of at least 20˚C (68°F) are readily found but tend to be far offshore in water depths that are
typically greater than 1,000 m (3,281 ft) (Avery and Wu 1994; National Research Council 2013).
The gross OTEC resource in the GOM can be approximated by calculating the area where there is
sufficient thermal difference between the surface water and the deeper water and multiplying this area by
a maximum power extraction density. The GOM ocean thermal energy resource with a temperature
differential of 18 ˚C (64.4°F) or greater was calculated to have a gross resource area of 321,600 km
2
(79,469,091 ac) (Figure 35). This density was estimated to be 0.19 MW/km
2
(Avery and Chih 1994).
This results in a gross OTEC resource potential of 61.1 GW.
Figure 35. Ocean thermal energy gross and technical resource showing 321,600 km
2
area where temperature
differential is 18˚C (64.4°F) or more.
The technical resource potential has the same resource area as shown in Figure 35 but is further limited by
two factors: 1) the supply of cold water to and from the GOM, and 2) the local currents in the OTEC
resource area. The replenishment rate of the cold water reservoir is limited by the flow rate of cold water
into and out of the GOM through the Yucatan Channel and the Florida Straits, respectively. The technical
resource potential would also be limited by large warm water discharge rates from the OTEC plants
diluting the local cold water resource, which would require significant spacing between adjacent plants.
Local currents within the gross resource area are typically small, except for transient phenomena, such as
56
eddies spun off from the Loop Current. Conservatively, water current speeds between 0.1 and 0.5 m/s (.2
and 1 mph) may be available to disperse the warm water discharge from the plant. Assuming the
Lockheed Martin 100 MW design was used, plant spacing in the GOM would be limited to approximately
50 km (31 mi) (Ascari et al. 2012). Taking these limitations into account, we estimate the maximum
technical potential for OTEC in the GOM to be 8.1 GW. However, this value may be optimistic; studies
by the National Research Council found reduced thermal gradients during winter months in the GOM that
may further limit the OTEC resource (National Research Council 2013).
2.6.3 OTEC Technical Readiness
OTEC is not a new concept, but it has yet to be demonstrated at commercial scale. Several subscale plants
have been built to demonstrate the principles, including:
• 100 kW OTEC facility presently operating on Kume Island, Okinawa, Japan
• 210 kW Open Cycle OTEC experimental apparatus which operated in Hawaii from 1993 to 1998
• 100 kW closed-cycle OTEC plant on the island of Nauru, Japan which operated from 1981 to
1982
• 50 kW Mini-OTEC plant offshore Hawaii which had a gross production of 50 KW and a net yield
of 15 KW in 1979 (Rafferty and Mero 2011)
Because a commercial scale plant has not been built, key design components such as the cold water pipe
and the large volume heat exchangers have not been developed or validated at full scale.
In the GOM, 20˚C (68°F) temperature differentials, sufficient for an OTEC plant to operate, exist in water
depths mostly greater than 1,000 m (3,281 ft); therefore OTEC plants will need to be built on floating
platforms, moored and anchored to the seabed. A large vertical cold water pipe will be needed to bring
water up to the platform. This cold water pipe poses a difficult challenge as it is very large and expensive
and may be susceptible to damage from extreme lateral currents.
Though currents in the GOM are small on average, floating OTEC platforms placed in the Loop Current
or Florida Current would intermittently experience current velocities in the range up to 2.5 m/s (5.6 mph)
or greater which is perhaps one of the greatest technology challenges for OTEC in the GOM. In the
Florida Keys, cold water is located closer to shore and in shallower water which may possibly enable
shore-based OTEC facilities. However, in these areas, the large discharge must be carefully considered,
first to avoid impacting the quasi-stable baroclinic structure of the offshore waters which could potentially
disturb the path of the Florida Current. Second, the large discharge water volume can potentially
contaminate the local warm and cold water resources. Finally, there may also be ecological and/or
biological concerns about de-stratifying thermal layers if large enough volumes of cold water are pumped
from the bottom of the ocean.
Mooring an OTEC facility in water depths greater than 1,000 m (3,281 ft) is feasible, though it adds cost
when depth increases, but the bigger challenge is the cost of bringing the power to shore. Most of the
potential OTEC sites are located far from shore (50 to 200 nm) and would require a significant grid export
system. The technology for this exists but the cost would be significant, especially at the 100 MW scale
or less.
2.6.4 OTEC Economics
Recent OTEC cost studies have been performed for floating plants and all studies have concluded that the
cost of power strongly improves with plant size (Vega 2016; Ascari et al. 2012). The studies suggest that
a 100 MW plant size may be optimum with an estimated LCOE of between $0.14 and 0.20/kWh. For
smaller plants, approximately10 MW size, LCOE doubles and is estimated to be between $0.35 and
0.45/kWh (Vega 2016). These studies however, assumed the OTEC plant was relatively close to shore (0
57
km), and that the transmission export cable accounted for approximately 10% of the total capital costs. In
the GOM, with sites nominally 50 to 200 nm offshore, higher LCOEs would be likely. No cost studies
have been performed for land-based OTEC plants within the last 25 years. However, earlier studies
indicate that for a very near shore cold water source, the LCOE would be $0.98/kWh for a 10 MW plant
when adjusted for inflation (Vega 1992). A side product of some OTEC cycles is the production of fresh
water which can be used to augment revenue streams.
2.6.5 OTEC Summary
The OTEC processes have been demonstrated for sub-scale systems (50 to 200 kW) during several multi-
year deployments, but no full-scale systems (50 to 100 MW) have been deployed to demonstrate the
efficiencies, reliability and costs. Because the development pace is slow and the resource in the GOM is
marginal in the winter and located relatively far from shore, the cost of energy would be higher in the
GOM relative to sites where OTEC demonstrations have already occurred. There are many sites within
the US with better resource and higher costs of electricity that are more suitable for OTEC development.
These locations include Hawaii, the Mariana Islands (including Guam), Puerto Rico, and the US Virgin
Islands (National Research Council 2013). Based on the nascent stage of the global industry, higher
regional costs, marginal resource quality, and site-specific issues, it is unlikely that OTEC will be
deployed in the GOM in the foreseeable future.
2.7 Cold Water Source Cooling
Cold water source cooling is not an energy source, but it can enable significant energy savings by
providing cooling, primarily for regions with high air conditioning loads. It is considered a potentially
viable option if cold water from the ocean exists in close proximity to large load centers. Unlike OTEC,
cold water source cooling requires only a cold water source, it does not need a thermal gradient. Its
economics are largely determined by the infrastructure cost needed for implementation, which are
difficult to obtain for a generic application. Because of the high thermal capacity of water, cold ocean
water has the potential to reduce energy demands of cooling processes in commercial and industrial
applications, especially in populated regions of the GOM where air conditioning is a primary load.
2.7.1 Cold Water Source Cooling Technology Description
Cold water source cooling uses cold water in the chiller of an air conditioning (A/C) system instead of an
electricity-driven compressor (Figures 36 and 37). Using cold water reduces the electricity use of A/C
systems by up to 85% to 90% (Makai 2017). This provides a significant benefit because electricity used in
A/C is often from periods of peak generation and is the highest cost.

58
Figure 36. Cold water source cooling diagram.
Source: IRENA (2014)
Figure 37. Cold water source cooling schematic.
Source: Makai 2017
59
The most effective form of cold water source cooling is district cooling. District cooling is much like
district heating, but rather than having a central source of heat, a central source of cold is used to chill a
cooling fluid. This cooling fluid is then circulated among buildings and is used for air conditioning (War
2011; Makai 2017). For this to work, cold-water is pumped from ocean sources that are usually deeper
than 300 m and brought to shore. A general threshold is that seawater sources can be as warm as 8˚C
(46.4°F) (Ascari et al. 2012; Makai 2017), but colder water sources yield higher efficiency and require
less water.
It is also worth noting that the chiller efficiency for an A/C system is related to the temperature of the
ambient sink to which the heat from the hot refrigerant is dumped. This is typically air or an evaporative
cooling tower. Cooler water near shore can thus be used to increase the efficiency of conventional A/C
systems with gains between 10 and 25% (personal correspondence with Makai Ocean Engineering).
2.7.2 Cold Water Source Cooling Resource Potential
Ocean surface water flows into the polar regions, cools and becomes more saline as ice is formed and
water evaporates. This denser water sinks to the deep basins of the ocean and slowly flows towards the
equator. Unlike fresh water that has a maximum density at 4˚C (39.2°F), sea water maximum density
occurs at its freezing point of -1.8˚C (28.8°F); thus, cold water is found in all deep water areas of the
oceans.
The GOM has a large volume of cold water which is continually replenished by the cold deep water
flowing in from the Yucatan Channel. Cold water is also found in the Straits of Florida, which is in
shallower water and closer to shore because of the baroclinic-barotropic structure under the Florida
Current.
The GOM holds an enormous volume of cold water that is suitable for cold water air conditioning that is
less than 8˚C (46.4°F). Though the cold waters in the GOM have the potential to meet much of the A/C
cooling requirements of the large coastal load centers, the distance from shore to the cold water source is
generally too far to feasibly transport the cold water using present technologies. The locations of cold
water below 8˚C (46.4°F) in the GOM were determined (Figure 38; NREL 2017b). These are computer
modeled data that have not been validated, but the general trend shows that significant cold water
resources are not present until depths of at least 300 m (984 ft). These locations are further from shore
than is practical for transport to shore due to the cost of the piping systems as well as the unwanted heat
transfer that would raise the temperature of the water before it reached the load unless special pipe
insulation was used.

60
Figure 38. Locations of cold water resource (<8˚C [46.4°F]) in the GOM averaged over a typical year.
2.7.3 Cold Water Source Cooling Technical Readiness
Cold water source cooling systems are not common, but they have been implemented in several
commercial applications, including
• City of Stockholm (>100,000 tons
15
),
• City of Toronto (75,000 tons),
• Cornell University (20,000 tons),
• Purdy’s Warf, Nova Scotia (1,000 tons),
• Intercontinental Hotel, Bora Bora (450 tons)
• Natural Energy Laboratory of Hawaii Authority (50 tons)
Though there are no large technical risks in cold water source cooling, the primary technology hurdle
within the GOM is developing a low cost offshore pipe that can transport water to shore with minimal
heat transfer to the cold water and low power pumping.
2.7.4 Cold Water Source Cooling Economics
In the states that border the GOM, a large proportion of the electricity use goes to air conditioning. For
example, the percent of electricity used for air conditioning, based on an annual average in the residential
sector is up to 27% (EIA 2009). On a seasonal basis, this number is much higher in the summer when air
conditioning use is the greatest. Also, it is often the most expensive electricity (peak generation) that
15
Ton is a standard term used in air conditioning to rate A/C units. It is a measure of how much heat the system can remove and
relative to how much ice it would take to accomplish that same impact.See https://www.energyvanguard.com/blog/55629/Why-Is-
Air-Conditioner-Capacity-Measured-in-Tons.
61
supplies air conditioning. Replacing or increasing the efficiency of conventional electricity-based A/C
systems has the potential to significantly reduce energy use along the GOM. However, the primary costs
of a cold water source cooling system are in the pipe used to transport the water to shore, pumping system
and the cold water distribution system.
Favorable economics for cold water source cooling depend on the following factors:
1. A source of cold water close to shore, ideally within 10 km,
2. A concentrated air conditioning load (e.g., dense city core) near the source, and
3. High electricity costs.
When the cold water source is close to shore (within 10km), the heat exchanger and pumping stations can
be located on shore where they are easier to install and service, with minimal heating of the cold water as
it is brought to shore. For further offshore installations, costs will increase due to the need for larger
diameter pipes and intermediate underwater pump stations, both major cost drivers. Additionally, heat
gain through long runs of pipe through warm water can be significant. For these reasons, cold water
source cooling systems have not been considered when an intake pipe exceeds 10 km (6.2 mi) (personal
correspondence with Makai Ocean Engineering). For new installations, the trenching and tunneling work
to run pipes can be very expensive if infrastructure does not already exist.
2.7.5 Cold Water Source Cooling Summary
Cold water source cooling has potential to offset electricity used for air conditioning in some areas of the
GOM. In most locations, the cold water resources are generally too far from shore to economically
transport (i.e., pipe and pumping costs) while maintaining the cold temperature. In addition, the cost of
upgrading the infrastructure within the large urban areas to install a cold water distribution system would
be high. Thus, cold water source cooling systems will not likely be a suitable option in most GOM
locations. For the GOM, the best opportunity for cold source cooling is in the outer Florida Keys, where
the deeper cold water entering the Florida straits might be close enough to warrant further investigation.
2.8 Hydrogen Conversion and Storage
Hydrogen (H
2
) is an environmentally clean energy medium that can be created to store energy. As a
stored fuel it can be used to manufacture other chemical commodities, power fuel cell vehicles, or
generate electricity. Hydrogen produced by an integrated offshore wind-electrolyzer system could be
moved to shore by ship or pipe, either newly laid pipe or possibly by injection into existing underwater
natural gas infrastructure. It is estimated that the GOM has approximately 13,135 mi (21,139 km) of
active natural gas pipelines in federal waters. There are also more than 15,000 mi (24,140 km) of
abandoned pipeline that could be potentially leveraged to transport hydrogen to shore (Bureau of Safety
and Environmental Enforcement [BSEE] 2018). However, use of existing pipelines could be hindered by
embrittlement due to the flow of hydrogen, unless a means is found for first treating the pipelines. If use
of existing pipelines was not deemed feasible, new pipelines could also potentially be laid for transporting
the produced hydrogen, and likely at a lower cost than laying subsea cables for transporting electricity.
The primary purpose of this section is to evaluate the technical and economic viability of integrating an
electrolyzer into an offshore wind system in the GOM that leverages existing oil and gas pipeline
infrastructure to transport hydrogen to onshore markets. Specifically, it focuses on the economic trade-off
between producing hydrogen offshore through electrolysis and transporting it to shore using the existing
undersea pipeline infrastructure, and the conventional method of transporting offshore electricity from
each wind turbine to shore by undersea cables.

62
2.8.1 Hydrogen Conversion and Storage Technology Description
Electrolysis is the process of using electricity to split water molecules into hydrogen and oxygen
molecules in an electrochemical unit called an electrolyzer, which is made up of an anode and a cathode
separated by an electrolyte (Figure 39). Assuming the electrolyte is pure water, when electricity is passed
through the electrodes, the water molecules split causing the positively charged hydrogen ions to travel
towards the negative cathode to combine into hydrogen gas and the negative oxygen ions to gravitate
towards the positive anode recombining to form oxygen gas. When powered by electricity from offshore
wind, an electrolyzer will produce hydrogen without emitting any greenhouse gases. Other hydrogen
production processes (i.e., thermochemical, direct solar water splitting, and biologically produced) are not
considered because they are technically and/or economically impractical to install in an offshore setting.
Figure 39. Overview of proton exchange membrane electrolyzer.
Source: DOE, Fuel Cell Technologies Office
The two main categories of electrolyzers are High Temperature Electrolyzers (HTE) and Low
Temperature Electrolyzers (LTE).
• An HTE, like a solid oxide electrolysis cell, requires an additional heating system to turn the
water into steam, thus adding additional capital costs and system complexity to a hypothetical
integrated offshore wind-electrolyzer system.
• Alkaline electrolyzers and proton exchange membrane (PEM) electrolyzers are the two most
common LTEs used in the hydrogen market today. Alkaline electrolyzers have been
commercially available for decades but require a potassium hydroxide electrolyte that needs to be
transported and stored offshore, making this technology less than optimal for offshore
applications (Meier 2014). PEM electrolysis cells require only water as an electrolyte and are
compatible with intermittent power flows from renewable electricity sources, potentially making
them the most practical choice for offshore applications. Siemens has commercially deployed a 6
MW PEM electrolyzer at Energiepark Mainz in Germany powered by wind energy (Siemens
2015).

63
2.8.2 Hydrogen Conversion and Storage Resource Potential
The two main feedstocks required for electrolysis are water and electricity. The GOM has a plentiful
supply of salt water. However, electrolysis using ocean water has only been conducted at laboratory scale
(Abdel-Aal et al. 2010). Existing commercial electrolyzer technologies require purified water. In an
offshore setting, this requires installing a desalination system that will add capital costs and require
periodic disposal of salt and other contaminants. Based on the resource assessment in Musial et al (2016)
NREL estimates that the GOM has the net technical potential
16
to generate 1,556 TWh/yr using offshore
wind technology, equivalent to approximately 25% of the U.S.’s net technical offshore wind potential.
Assuming Ruth et al.’s (2017) estimate that a low temperature electrolyzer requires 50.2 kWh
17
to
produce one kilogram (kg) of hydrogen and operates at 66% efficiency
18
, the GOM’s technical offshore
wind resource has the potential to produce approximately 23.7 billion kg H
2
/yr
19
.
2.8.3 Hydrogen Conversion and Storage Technical Readiness
Electrolytic hydrogen production faces four main technical risks in an offshore setting:
1. Hydrogen conversion efficiency and system economics: Energy conversion losses associated
with the production and storage of hydrogen most likely cost more than the cost of the electrical
grid infrastructure that is avoided. This is the primary disadvantage to hydrogen conversion and
storage. A conventional offshore wind system experiences losses converting wind energy into
mechanical energy, converting mechanical energy into electrical energy, and transporting
electrical energy over distance. In total, losses due to electrical transmission from offshore wind
turbines are about 3.4% of total power production (Moné et al. 2017). In a scenario where an
electrolyzer replaces an offshore wind system’s electrical substation and export infrastructure,
these electrical losses would be eliminated. However, overall energy losses increase to about 33%
in converting the electricity to hydrogen. In a typical offshore wind plant, the electrical
infrastructure comprises approximately 20% of the total capital cost but all the revenue is made
from the energy sold. Without accounting for the added cost of the electrolyzers, a rough
assessment indicates that a loss of over 25% of the energy revenue could not be recovered by the
savings gained by avoiding the grid infrastructure.
2. Cost and maturity of electrolyzer technologies: Electrolyzer technologies are relatively
nascent, are just beginning to be commercially deployed at scales larger than one megawatt and
have only been deployed on land. Manufacturers are still searching to find optimal electrolyzer
materials and configurations for different types of commercial applications. This technological
uncertainty and a lack of large-scale deployment means that electrolyzer costs are still
significantly higher than conventional hydrogen production techniques like steam methane
reformation (SMR), which uses a series of chemical reactions to split methane molecules into
hydrogen and carbon dioxide. Because the offshore environment is more demanding to operate
in, an offshore electrolyzer would need to be built to a higher standard, demand more
maintenance, and require novel materials and subsystems all of which would substantially
increase the system’s overall capital and operating costs. The potential added costs and
technological requirements of an offshore electrolyzer decrease the probability of cost
effectiveness when married to an offshore wind turbine, because the electrolyzer, hydrogen
storage, and hydrogen transport mechanism would have to cost less than the offshore wind
16
Net technical offshore wind energy potential refers to the total amount of electricity that could be generated from offshore turbines
given technical and siting limitations.
17
This energy consumption estimate uses a low temperature electrolyzer and is based on DOE’s H2A Production Analyses.
18
Electrolyzer efficiency is highly dependent on a number of factors. Future PEM electrolyzer technologies could experience
efficiencies of up to 80% (Harrison et al. 2009).
19
Note that this estimate is hypothetical and does not include constraints on the number, size, or operational characteristics of a
potential electrolyzer deployed in the GOM.

64
system’s electrical substation and electrical cable infrastructure, in addition to gaining
significantly in conversion efficiency.
3. The transport and storage of hydrogen: In the GOM, hydrogen produced offshore will have to
be transported to markets onshore via specialized transport vessels or pipelines. Moving hydrogen
by ship is technically challenging and potentially very costly. The vessel would require
specialized compression and refrigeration subsystems to prepare hydrogen molecules for
transport and no such vessel yet exists. If treated first for embrittlement by hydrogen, using the
GOM’s substantial existing undersea pipeline infrastructure could provide significant cost savings
and offset an electrolyzer’s substantial capital costs. While many assume that blending low
concentrations of hydrogen into natural gas pipelines with methane is safe, it requires additional
downstream separation technologies to separate the hydrogen from the methane on land
(Melanina et al. 2013). Using existing pipeline infrastructure to move pure hydrogen is untested
and presents unique economic and safety concerns caused by hydrogen molecules’ small size and
increased propensity to leak out of standard pipes and seals (Pellow et al. 2015). To avoid the
potential complications of using existing undersea pipeline infrastructure, specialized pipes and
seals that can handle higher pressures and other tolerances could be used but would make the
project uneconomical. Connecting an offshore hydrogen production system with existing pipeline
infrastructure is unproven and would require additional engineering and safety assessments.
2.8.4 Hydrogen Conversion and Storage Economics
There is significant uncertainty surrounding future hydrogen markets, prices, and costs. Furthermore, it is
extremely difficult to accurately predict the future costs of a large integrated offshore wind-electrolyzer
system because no large-scale electrolyzers or offshore systems have ever been deployed. Meier (2014)
estimated the costs of deploying either an HTE or LTE powered by offshore wind in Norwegian waters
and found that neither system would be profitable under any of the scenarios considered, even excluding
transportation costs (Table 9). The study found that the above-surface platform for the electrolyzer,
desalination subsystem, and a potential steam generation subsystem dramatically increased the system’s
capital costs.
Table 9. Base Case Economics of an Offshore Wind-Powered Electrolyzer
Type pf
Electrolyzer
Electrolyzer Size
Price/kg H
2
Total Investment
Cost
HTE
100 MW
18.85 €
641 million €
LTE (PEM)
100 MW
20.61 €
716 million €
In a best case scenario, the costs for onshore electrolyzers could be transported to an offshore setting.
Ruth et al. (2017) conducted a techno-economic analysis of onshore integrated energy systems producing
hydrogen in Texas using modeled electrolyzers and SMR using DOE’s H2A Production Analyses (Table
10).

65
Table 10. Modeled Hydrogen Production Costs Without Transport Costs
Technology Plant Capacity
Capital
Costs
20
Fixed O&M
Costs
21
per year
Electricity
Requirement
Thermal Energy
Requirement
22
Price/kg H
2
HTE
50,000 kg
H
2
/day
$662/kW $58.69/kW
35.1 kWh/kg
H
2
11.15 kWh/kg
H
2
$3.09
LTE
50,000 kg
H
2
/day
$616/kW $42.73/kW
50.2 kWh/kg
H
2
N/A $3.87
SMR
379,387 kg
H
2
/day
$429/kg
H
2
/day
$6,427,000 N/A
156,000
BTU/kg H
2
$1.47
Leveraging existing GOM infrastructure could reduce the cost of an integrated offshore wind electrolyzer
system by removing the electrical subsystems
23
that move electricity to shore, saving roughly $397/kW
for a fixed bottom system and $698/kW for a floating system.
While the electrolyzer costs modeled by Ruth et al. (2017) are significantly lower than offshore
electrolyzer costs estimated by Meier (2014), both studies’ electrolyzer cost estimates are at least twice as
high as the cost of SMR, which currently produces 95% of hydrogen globally. NREL’s H2@Scale
research team estimated that existing electrolyzer costs will need to be reduced by approximately 75%
and electricity costs reduced by 70% (Ruth et al. 2017) to become competitive with SMR. Therefore,
electrolysis (conducted either onshore or offshore) will be economically uncompetitive for the foreseeable
future if the primary purpose is to produce hydrogen and carbon pricing has not been implemented.
2.8.5 Hydrogen Conversion and Storage Summary
Current electrolyzer technologies have not been commercially scaled to absorb the electrical output of a
commercial wind farm or designed to operate in offshore settings. The analysis did not find any
application that would warrant the use of hydrogen in conjunction with a renewable energy system due to
the following primary reasons:
• Even in an optimistic or best case scenario, hydrogen production using electrolysis is
economically uncompetitive with hydrogen production technologies that use SMR.
• Replacing an offshore wind farm’s electric substation and undersea cable infrastructure with an
electrolyzer that feeds hydrogen into existing undersea pipeline infrastructure is less
economically attractive. The added capital costs and energy conversion losses would likely
decrease the system’s revenue compared to selling electricity to shore via undersea cables.
For the foreseeable future, electrolytic hydrogen production in the GOM will remain challenging
because of significant technical and economic obstacles.
20
All costs are reported in 2012 dollars because the uncertainty in the estimate is greater than the cost differential between years.
21
Operation and Maintenance (O&M) costs include feedstock costs.
22
Heat upgrading costs are not considered in Ruth et al. (2017)’s calculations.
23
Moné et al. (2017) estimate that a 4.14 MW fixed bottom offshore wind plant’s total CapEx is $4,615/kW with its electrical
infrastructure equivalent to 8.6% of capital costs. A 4.14 MW floating offshore wind plant’s total CapEx is $6,647/kW with its
electrical infrastructure equivalent to roughly 10.5% of its capital costs.

66
3. Gulf of Mexico Offshore Renewable Energy Summaries
This section summarizes the findings from the individual offshore renewable energy technology
assessments presented in Section 2. Section 3.1 describes each technology’s gross and technical energy
potential and identifies the geospatial and technical filters used for resource calculations. Section 3.2
provides an overview of each technology’s readiness level. Section 3.3 identifies the levelized cost of
energy (LCOE) ranges reported for each technology.
3.1 Resource Comparisons by Technology
In aggregate, we estimated the Gulf of Mexico (GOM) to have 87,752 GW of gross offshore renewable
energy potential. When applying the technical and geospatial filters identified in Table 11, the GOM was
estimated to have 517 gigawatts (GW) of technical offshore renewable energy potential in aggregate.
Cold water source cooling and hydrogen conversion were not included in either the gross or technical
potential calculations because neither technology generates energy.
24
24
Neither cold source cooling nor hydrogen conversion are energy generation technologies. Cold source cooling is an efficiency
technology that could potentially reduce the amount of energy that costal Gulf cities use to cool buildings. In this study hydrogen
conversion merely converts the energy captured by offshore wind turbines into a different medium that could be potentially
transported to shore using existing oil and gas undersea pipeline networks.

67
Table 11. Offshore Renewable Energy Resource Limit Criteria for the GOM
Technology
Gross Potential Criteria Technical Potential Criteria
Max
Distance
from
Shore (nm)
Max
Water
Depth
(m)
Capacity
Density
(MW/km
2
)
Gross
Resource
Area/Length
(km
2
/ km)
Gross
Resource
Capacity
(GW)
Max
Distance
from Shore
(nm)
Max Water
Depth (m)
Resource
Minimum
Technical
Resource
Area (km
2
)
Max
Wave
Height
Technical
Resource Capacity
(GW)
Offshore wind 200 None 3 624,100 1,872 200 1,000
> 7 m/s (15.7
mph)
169,333 N/A 508
Wave energy 200
50m
Isobath
50% 2,004 km 3.1 200 None > 10 KW/m 0 N/A 0
Tidal energy 200 None None N/A 0.13 200 1,000 >500 W/m
2
N/A N/A 0.06
Ocean current 200 None None 715,100 3.6 200 1,000 >500 W/m
2
N/A N/A 0.359
Offshore solar
energy
200 None 120 715,100 85,812 200 1,000 N/A 0 3 m 0
25
OTEC 200 None 0.19 321,600 61.1 200 None
> 18 °C
Differential
321,600 N/A 8.1
Cold water
source cooling
200 None N/A 321,600 N/A 6 1,000 > 8 °C 0 N/A N/A
nm: nautical mile; MW: megawatt
25
Though the technical potential reported in this chart is zero, there may be sites in protected bays in the GOM that could support offshore solar photovoltaic (PV) deployment.

68
A breakdown of the GOM’s total gross and technical offshore renewable energy potential by technology
resulted in a large range of values (Figure 40). Given this large range of values, it was necessary to use a
log scale on the vertical axis to show values on one chart. In making this conversion, the resource
numbers are shown in megawatts (MW). Note that 1 GW equals 1,000 MW. In terms of gross energy
potential, the analysis estimated that offshore wind has 1,872 GW, wave energy has 3.1 GW, tidal energy
has 0.13 GW, ocean current has 3.6 GW, offshore PV has 85,812 GW, and OTEC has 61.1 GW. After
applying the constraints from Table 11, offshore wind has a technical potential of 508 GW, wave energy
has 0 GW, tidal energy has 0.086 GW, ocean current has 0.358 GW, offshore PV has 0 GW, and OTEC
has 8.1 GW.
Figure 40. Gross and technical offshore renewable energy potential for the GOM by technology.
3.2 Technology Readiness by Technology Type
Technology readiness refers to a given offshore renewable energy technology’s ability to be
commercially deployed. This analysis identified four technology readiness stages: early stage research
and development (R&D), proof of concept, pre-commercial demonstration, and commercially proven as
described in section 1.3.2.2. These readiness stages represent a simplified hierarchy when compared with
other more detailed readiness scales such as the DOE’s Technologies Readiness Levels (TRL) (DOE
2011). Early stage R&D refers to technologies that are conceptual in nature. Proof of concept describes
the stage where individual components and/or the entire system has been tested in a laboratory and
gradually scaled up to prototype-scale technology that has all the capabilities of the eventual commercial
model. Pre-commercial demonstration technologies take the design validated in the proof-of-concept
stage and assess the scaled-up system in advantageous test- or real-world conditions. Commercially
proven denotes a technology that has been deployed exclusively for commercial purposes that is qualified
1
10
100
1,000
10,000
100,000
1,000,000
10,000,000
100,000,000
Offshore Wind Wave Energy Tidal Energy Ocean Current Offshore Solar
PV
OTEC
1,872,000
3,122
130
3,600
85,812,000
61,100
508,000
0
86
358
0
8,100
Resource Potential (MW)
Gross Potential (MW) Technical Potential (MW)

69
to operate under a full range of real world operating conditions. Each offshore renewable energy
technology was assigned a range of readiness levels (Figure 41).
26
Figure 41. Technology readiness for GOM renewable energy technologies.
The rationale for each technology’s readiness level is listed below:
• Offshore wind ranges from pre-commercial demonstration to commercially proven because
although fixed-bottom offshore wind technologies are commercially deployed around the globe
27
,
additional technology development is needed to demonstrate and validate hurricane designs and
to optimize rotors for lower wind regimes.
• Wave technology readiness spans from early stage R&D to pre-commercial demonstration
because while multiple demonstration projects have been deployed, the industry has yet to sustain
the operation of any concept for a duration long enough to demonstrate commercial operation or
predictable energy production profiles. The industry is still actively engaged in new concepts at
an R&D scale without significant convergence.
• Tidal energy has had some success and is approaching commercialization in some projects, partly
due to adaptation of wind energy technology.
• Ocean current technology has been validated at the laboratory/prototype scale and could benefit
from tidal energy successes and similarities, although no prototypes have yet been deployed.
• Ocean-based solar PV benefits from proven technology on land where it has achieved vast
commercial success. This success has been extended commercially to deployment over sheltered
lakes and reservoirs. However, it has yet to be commercially deployed or tested in open-ocean
conditions where the challenges are immense due to extreme waves.
• OTEC requires larger (100 MW) power plants to demonstrate commercial costs and technological
success. Deployments to date have been at a scale 1/100th of that size. Therefore, the technology
has not demonstrated economic or performance feasibility, and significant technical challenges
are still unsolved. The technology requires significant additional research, prototyping and
demonstration before it can be deployed commercially.
• Cold water source cooling has successfully been used in multiple locations around the world, but
its application in the GOM is limited to the Florida Keys and may require additional technology
to overcome longer pipe lengths.
• Hydrogen conversion using electrolysis has been proven and significantly larger demonstration
projects continue to be deployed. Successful deployment in an offshore ocean application will
require a significant amount of additional testing but does not appear to be economically feasible
under any scenario investigated.
26
Note that technology is constantly evolving, and that these “readiness” demarcations reflect our best assessment as of September
2017.
27
For more information about offshore wind deployment levels, see DOE’s 2016 Offshore Wind Technologies Market Report (Musial
et al. 2017).

70
For a more detailed description of each technology’s readiness level please refer to individual technology
assessments located in Section 2.
3.3 Cost Comparison by Technology
A large range of estimated LCOEs is observed across the technologies examined in this report (Figure
42). For some of the technologies, the wide ranges incorporate high uncertainty because developers have
yet to converge on an optimal configuration, develop operational parameters, or demonstrate the
technology at a commercial scale. As a result, costs and cost ranges are difficult to compare because some
technologies, like offshore wind, have established costs based on present day market data that can be
verified. Other technology costs are based on projections of future costs for a mature version of the
technology that has not yet been developed. Therefore, cost information may favor nascent technologies
that are characterized by future cost scenarios that may be optimistic in some cases. Costs are not
provided for cold water source cooling because it is not considered an energy source but an energy
efficiency measure that is difficult to compare with actual energy sources.
Figure 42. Levelized cost ranges for renewable energy technologies.
Offshore wind energy is estimated to have a current LCOE range of $0.095/kWh to $0.19/kWh in U.S.
markets (Figure 42), based on recent sources of information (Table 12). Wave energy is expected to be
able to achieve an LCOE range of $0.12/kWh to $1.00/kWh; the extreme amount of cost variation is
driven by uncertainty of the ultimate design and scale of deployment but none of these costs have been
validated yet. Tidal energy has an estimated LCOE range of $0.15/kWh to $0.31/kWh. Ocean current
energy may be able to achieve an estimated levelized cost range of $0.15/kWh to $0.38/kWh. Offshore
solar PV has a projected LCOE range of $0.13/kWh to $0.35/kWh. OTEC has a projected LCOE range of
$0.14/kWh to $0.98/kWh. Offshore electrolytic hydrogen production is expected to cost between
$3.09/kg H
2
to $127.16/kg H
2
on a levelized basis.
Table 12. Technology Cost Sources
Technology Sources
Offshore wind
NREL (2017); Moné et al. (2017)
Wave energy
IEA-OES (2015); Neary et al. (2014); Lewis et al. (2014)
Tidal energy
IEA-OES (2015); Neary et al. (2014); Lewis et al. (2011)
Ocean current
IEA-OES (2015); Neary et al. (2014); Lewis et al. (2011)
Offshore solar energy
Ciel & Terre (2016); Bureau of Reclamation (2016); Barbusica (2016)
OTEC
Vega 2012; Ascari et al. 2012
Hydrogen conversion and storage Ruth et al. (2017); Meier (2014)
$0.00 $0.10 $0.20 $0.30 $0.40 $0.50 $0.60 $0.70 $0.80 $0.90 $1.00
OTEC
Offshore Solar PV
Ocean Current
Tidal Energy
Wave Energy
Offshore Wind
Levelized Cost of Energy ($/kWh)

71
4. Down-selecting to One Technology
The primary purpose of this study was to examine the range of ocean-based renewable technologies in the
context of the Gulf of Mexico (GOM), assess their viability, and provide Bureau of Ocean Energy
Management (BOEM) with information on offshore renewable energy potential for near-term as well as
long-term planning. The following section narrows the renewable energy technologies above to a single
technology to be examined in more detail in follow-on tasks for this project.
4.1 Down-select Criteria
Based on information presented in Section 3, each technology was evaluated based on the resource
adequacy, technology readiness, and cost competitiveness, on a scale from 1 to 5. The highest score (5)
represents the highest resource adequacy, the most mature technology, and the lowest cost potential
relative to the other technologies, respectively. For each technology, a score was given in each of these
categories, with equal weighting for each category. The sum of these three numbers was the given score
for each technology (Table 13). Some of the scoring was subjective as it was necessary to consider the
global industry progress and the status of each technology relative to each other. The results conclude that
offshore wind received the highest composite score of 13 out of a possible 15.
Table 13. GOM Technology Scoring Assessment Results
Technology Type
Resource
Adequacy
Technology
Readiness
Cost
Competitiveness
Potential
Total
Score
Offshore wind
5
4
4
13
Wave energy
1
2
2
5
Tidal energy
2
3
3
8
Ocean current
1
2
2
5
Offshore solar energy
3
3
3
9
OTEC
3
2
2
7
Cold water source cooling
1
4
N/A
-
Hydrogen conversion
N/A
3
1
-
Across technologies, total scores ranged from a low of 5 to a high of 13 (out of a total 15; Figure 43).
Offshore wind was the top ranked technology, ranking significantly above ocean based solar which
scored 9 out of 15. Based on these results it is recommended that offshore wind be selected as the
technology to be continued for deeper analysis in this study.

72
Figure 43. GOM technology scoring in rank order.
4.2 Down-select Conclusion
Based on the criteria established for resource adequacy, technology readiness, and cost competitiveness,
NREL’s recommendation is to focus the next tasks in this study on offshore wind as the primary
technology. The technical resource potential for offshore wind was 508 GW, the largest of any of the
technologies examined. Its deployment and ability to serve a significant percentage of the load in the
GOM is primarily dependent upon improving the economics over the next decade. Based on global
trends, the economics for offshore wind are improving rapidly, making economic deployment of offshore
wind turbines in the GOM likely by 2030 (Beiter et al 2017) when costs may be approaching acceptable
market levels. During this timeframe, there will be a need to develop offshore wind new technologies to
optimize energy capture in the lower wind regimes of the GOM, to increase understanding of hurricane
risk, and to design machines suitable for hurricane-prone areas.
Ocean-based solar has an enormous gross resource potential in the GOM but is severely constrained by
extreme wave conditions on the ocean surface that would likely damage conventional photovoltaic (PV)
systems and support structures. However, state waters in the GOM have sheltered bays and water bodies
closer to urban load centers that could better take advantage of solar resources and may present a future
opportunity. In addition, new technology concepts for floating solar may be developed in the future.
Other renewable energy technologies surveyed in this study may present opportunities for energy
generation on a limited basis. Tidal energy has very little resource in the GOM. However, specific sites
that were identified in this study in Texas and Florida have potential for small distributed systems. Cold
water source cooling is limited in the GOM because the best resource is located far from shore where it
cannot be easily accessed. A few sites near Key West may be accessible for this purpose but will not
make a major contribution to the GOM electricity needs. Wave energy, ocean thermal energy conversion
(OTEC), and ocean current all have challenges that may preclude their implementation in the GOM in the
foreseeable future. However, longer term technological and economic improvements are possible.
The potential for developing offshore wind to serve loads in the GOM is real in the shorter term and will
be explored further in later tasks.
73
References
Abdel-Aal HK, Zohdy KM, Abdel Kareem M. 2010. Hydrogen production using sea water electrolysis.
Open Fuel Cells J. 3:1-7. https://benthamopen.com/contents/pdf/TOFCJ/TOFCJ-3-1.pdf.
[API] American Petroleum Institute. 2007. API interim guidance on hurricane conditions in the Gulf of
Mexico. API Bulletin 2INT-MET. Washington (DC): American Petroleum Institute.
https://archive.org/stream/gov.law.api.2int-met.2007/api.2int-met.2007_djvu.txt.
Ascari MB, Hanson HP, Rauchenstein L, Van Zwieten J, Bharathan D, Heimiller D, Langle N, Scott GN,
Potemra, J, Nagurny NJ, Jansen E (Lockheed Martin Mission Systems and Sensors, Bathesda, MD).
2012. Ocean thermal extractable energy visualization: Final report. Washington (DC): US
Department of Energy, Office of Energy Efficiency and Renewable Energy. Award DE-EE0002664.
https://www.osti.gov/scitech/biblio/1055457.
Athié, G, Candela, J, Ochoa, J. Sheinbaum, J. 2012. Impact of Caribbean cyclones on the detachment of
loop current anticyclones. J. Geophys. Res. 117 (C03018). doi:10.1029/2011JC007090.
Avery WH, Wu C. 1994. Renewable energy from the ocean: A guide to OTEC. New York: Oxford
University Press.
https://www.researchgate.net/publication/239875533_Renewable_Energy_from_the_Ocean_-
_A_guide_to_OTEC.
AWS Truepower, LLC. 2012. Wind resource maps and data: methods and validation. [accessed 2016
July]. https://www.awstruepower.com/products/maps-and-resource-data.
Barbusica M. 2016. Preliminary study of floating photovoltaic systems on dams (working paper).
Research Gate.
https://www.researchgate.net/publication/312153623_Preliminary_Study_on_Floating_Photovoltaic_
Systems_on_Dams.
Beiter P, Musial W, Smith A, Kilcher L, Damiani R, Maness M, Sirnivas S, Stehly T, Gevorgian V,
Mooney M, Scott G. 2016. A spatial-economic cost reduction pathway analysis for US offshore wind
energy development from 2015–2030.Golden (CO): National Renewable Energy Laboratory. Report
No. NREL/TP-6A20-66579. Contract No. DE-AC36-08GO28308.
https://www.nrel.gov/docs/fy16osti/66579.pdf.
Beiter P, Musial W, Kilcher L, Maness M, Smith A. 2017. An assessment of the economic potential of
offshore wind in the United States from 2015 to 2030. Golden (CO): US Department of Energy,
National Renewable Energy Laboratory. Report No. NREL/TP-6A20-67675. Contract No. DE-AC36-
08GO28308. (CO). http://www.nrel.gov/docs/fy17osti/67675.pdf.
Black & Veatch (Overland Park, KS). 2010. Technology characterization for renewable energy electricity
futures study: GIS database of offshore wind resource competing uses and environmentally sensitive
areas. Golden (CO): National Renewable Energy Lab. Unpublished report.
[BSEE] Bureau of Safety and Environmental Enforcement [US Department of the Interior]. 2018.
Calculation of gas pipeline miles on the OCS. Personal communication with W Fernandez. March 19.
74
Bureau of Reclamation. 2016. Fundamental considerations associated with placing solar generation
structures at Central Arizona Project canal. Phoenix (AZ): Department of the Interior, Bureau of
Reclamation.
https://www.usbr.gov/main/qoi/docs/Placing%20Solar%20Generation%20Structures%20Over%20the
%20CAP%20Canal%207-12-2016%20Final%20r1.pdf.
Choi YW, Lee nm, Jim KJ. 2013. Empirical research on the efficiency of floating PV systems compared
with overland PV systems. Conference paper, International Conference on Circuits, Control,
Communication, Electricity, Electronics, Energy, System, Signal, and Simulation (CES-CUBE 2013).
18–20 July 2013, Guam, US.
https://pdfs.semanticscholar.org/a389/10b49973d099603974c24cd55f43a8b0f64c.pdf.
Ciel & Terre. 2016. Ciel e Terre corporate website [accessed 2018 Mar 1]. http://www.ciel-et-terre.net/.
This image is used with permission. Personal communication 2 March 2018.
Denholm P, Margolis R. 2007. The regional per-capita solar electric footprint for the United States.
Golden (CO): National Renewable Energy Laboratory. Golden, CO (US). Report No. NREL/TP-670-
42463. Contract No. DE-AC36-99-GO10337. https://www.nrel.gov/docs/fy08osti/42463.pdf.
[DOE] US Department of Energy. 2011. Technology readiness assessment guide. Washington (DC): US
Department of Energy. Report No. DOE G 413.3-4A.
http://www2.lbl.gov/dir/assets/docs/TRL%20guide.pdf.
[DOE] Department of Energy. 2015. Wind vision: a new era for wind power in the United States.
Washington (DC): Department of Energy. Report No. DOE/GO-102015-4557.
http://www.energy.gov/sites/prod/files/WindVision_Report_final.pdf.
[DOE] Department of Energy. 2017. Marine and hydrokinetic (MHK) databases and systems (fact sheet).
DOE/EE/EE-1166. Washington (DC): Department of Energy, Wind and Water Technologies Office.
[accessed 2017 Oct 12].
https://www.energy.gov/sites/prod/files/2015/01/f19/MHK_DBsystems1pager.pdf.
[DOE] Department of Energy, Alliance for Sustainable Energy. 2018. 2017 Offshore wind technologies
market update. September 2018. Washington (DC): US Department of Energy, Office of Energy
Efficiency & Renewable Energy. Contract No. DE-AC36-08GO28308.
https://www.energy.gov/sites/prod/files/2018/09/f55/71709_V4.pdf.
Draxl C, Clifton A, Hodge B, McCaa J. 2015. The wind integration national dataset (WIND) toolkit.
Appl. Energy. 151(1):355-366. ISSN 0306-2619. http://dx.doi.org/10.1016/j.apenergy.2015.03.121.
Duerr AE, Dhanak MR. 2012. An assessment of the hydrokinetic energy resource of the Florida Current.
IEEE J. Ocean. Eng. 32(2). DOI: 10.1109/JOE.2012.2186347.
[EIA] US Energy Information Administration. 2009. Residential energy consumption survey (RECS).
[accessed 2018 Feb 1]. https://www.eia.gov/consumption/residential/data/2009/.
Energy BC. 2017. Tidal power. [accessed 2018 Feb 24]. http://www.energybc.ca/tidal.html.
Exploring Our Fluid Earth. 2015. Wave energy and wave changes with depth. [accessed 2017 Sep].
https://manoa.hawaii.edu/exploringourfluidearth/physical/waves/wave-energy-and-wave-changes-
depth.
75
Goodwin B, Hildenbrand K. 2013. A primer on wave energy: wave energy devices.. Corvallis: Oregon
State University. Publication No. ORESU-G-13-004. Award No.: NA06OAR4170010.
http://seagrant.oregonstate.edu/sgpubs/primer-wave-energy-wave-energy-devices.
Haas KA, Fritz HM, French SP, Neary VS (Georgia Tech Research Corp., Atlanta, GA). 2013.
Assessment of energy production potential from ocean currents along the United States coastline.
Washington (DC): US Department of Energy, Office of Energy Efficiency and Renewable Energy,
Wind & Water Power Program. Award No.: DE-EE0002661.
https://www.energy.gov/sites/prod/files/2013/12/f5/energy_production_ocean_currents_us_0.pdf.
Hamilton P, Donohue K, Hall C, Leben RR, Quian H, Sheinbaum J, Watts DR (Leidos, Inc., Raleigh,
NC). 2015. Observations and dynamics of the Loop Current. New Orleans (LA): US Dept. of the
Interior, Bureau of Ocean Energy Management, Gulf of Mexico OCS Region. Report No.: OCS
Study BOEM 2015-006. Contract No.: M08PC20043. https://www.boem.gov/ESPIS/5/5471.pdf.
Harrison KW, Martin GD, Ramsden TG, Kramer WE, Novachek FJ. 2009. The wind-to hydrogen project:
operational experience, performance testing, and systems integration (Technical Report). NREL/TP-
550-44082. National Renewable Energy Laboratory, Golden (CO.
https://www.nrel.gov/docs/fy09osti/44082.pdf.
Heller V, Member I, Chaplin J, Farley F, Hann M, Hearn GE. 2010. Physical model tests of the Anaconda
wave energy converter. Paper presented at: MREc 2010. Proceedings of the 1st IAHR European
Congress.
https://www.researchgate.net/publication/268173217_Physical_model_tests_of_the_anaconda_wave_
energy_converter.
[IEA-OES] International Energy Agency (IEA)—Ocean Energy Systems. 2015. International levelised
cost of energy for ocean energy technologies. https://www.ocean-energy-
systems.org/publications/oes-reports/cost-of-energy/document/international-levelised-cost-of-energy-
for-ocean-energy-technologies-2015-/.
IRENA. 2014. Renewable energy opportunities for island tourism.
http://www.irena.org/publications/2014/Aug/Renewable-Energy-Opportunities-for-Island-Tourism.
Jenne DS, Yu YH, Neary V. 2015. Levelized cost of energy analysis of marine and hydrokinetic reference
models (Conference Paper). NREL/CP-5000-64013. National Renewable Energy Laboratory
(NREL), Golden (CO. https://www.nrel.gov/docs/fy15osti/64013.pdf.
Kaiser MJ. 2008. The impact of extreme weather on offshore production in the Gulf of Mexico. Appl.
Math. Modell.. 32(10):1996–2018.
http://www.sciencedirect.com/science/article/pii/S0307904X07001680.
Kaiser MJ, Snyder B, Pulsipher AG. 2011. Assessment of opportunities for alternative uses of
hydrocarbon infrastructure in the Gulf of Mexico. New Orleans (LA): US Dept. of the Interior,
Bureau of Ocean Energy Management, Regulation and Enforcement, Gulf of Mexico OCS Region ().
OCS Study BOEMRE 2011-028. https://www.boem.gov/ESPIS/5/5153.pdf.
Kilcher L, Thresher R. 2016. Marine hydrokinetic energy site identification and ranking methodology part
I: wave energy. NREL/TP-5000-66038. National Renewable Energy Laboratory (NREL). Golden,
(CO. https://www.nrel.gov/docs/fy17osti/66038.pdf.
76
Kilcher L, Thresher R, Tinnesand H. 2016. Marine hydrokinetic energy site identification and ranking
methodology part II: tidal energy. NREL/TP-5000-66079. National Renewable Energy Laboratory.
Golden (CO. https://www.nrel.gov/docs/fy17osti/66079.pdf.
Krishanaveni N, Anbarasu P, Vigneshkumar D. 2016. A survey on floating solar power systems. Int. J.
Curr. Res. Mod. Educ.. Special issue, NCFTCCPS-2016. http://ijcrme.rdmodernresearch.com/wp-
content/uploads/2015/06/CP-024.pdf.
Lewis A, Estefen S, Huckerby J, Musial W, Pontes T, Torres-Martinez J. 2011. Ocean energy.
In:Edenhofer O, Pichs-Madruga R, Sokona Y, Seyboth K, et al., editors. IPCC special report on
renewable energy resources and climate change mitigation. New York: Cambridge University Press
(). http://www.ipcc.ch/report/srren/.
Lewis MJ, Neill SP, Hashemi MR, Reza M. 2014. Realistic wave conditions and their influence on
quantifying the tidal stream energy resource. Appl Energy. 136:495-508.
https://www.sciencedirect.com/science/article/pii/S0306261914010095#bi0005.
Lilley M, Firestone J, Kempton W. 2010. The effect of wind power installations on coastal tourism.
Energies. 3(1): 1‒22.
https://www.ceoe.udel.edu/File%20Library/Research/Wind%20Power/Publication%20PDFs/LilleyFi
reKemp-WindBeachTourism-10.pdf.
Lissamen R, Radkey R. 1979. Coriolis program: a review of the status of the ocean turbine energy
system. Oceans 79.
[Makai] Makai Ocean Engineering. 2017. An introduction to seawater air conditioning. [accessed 2017
Aug].
https://www.makai.com/brochures/Makai%20Seawater%20Air%20Conditioning%20Brochure%2020
15_9_17.pdf.
Meier K. 2014. Hydrogen production with sea water electrolysis using Norwegian offshore wind energy
potentials. Int. J. Energy Environ. Eng. 5(2-3):1. https://link.springer.com/article/10.1007/s40095-
014-0104-6.
Melanina MW, Antonia O, Penev M. 2013. Blending hydrogen into natural gas pipeline networks: a
review of key issues (Technical Report). NREL-TP-5600-51995. National Renewable Energy
Laboratory (NREL). Golden (CO. https://www.nrel.gov/docs/fy13osti/51995.pdf.
Meyer L, Cooper D, Varley R. 2011. Are we there yet? a developer's roadmap to OTEC
commercialization. Hawaii National Marine Renewable Energy Center.
http://citeseerx.ist.psu.edu/viewdoc/download?doi=10.1.1.1000.317&rep=rep1&type=pdf.
[MeyGen] MeyGen Ltd. 2011. MeyGen phase 1 EIA scoping document. [accessed 2018 January 31].
http://marine.gov.scot/datafiles/lot/Meygen/MeyGen_Offshore_Tidal_Array_SoS_Scoping_Opinion_
Report.pdf.
MeyGen. 2017. Project Development & Operation. (accessed Aug 2017).
https://www.atlantisresourcesltd.com/projects/meygen/.
77
Moné C, Hand M, Bolinger M, Rand J, Heimiller D, Ho J. 2017. 2015 cost of wind energy review
(Technical Report). NREL/TP-6A20-66861. National Renewable Energy Laboratory (NREL),
Golden (CO). https://www.nrel.gov/docs/fy17osti/66861.pdf.
Musial W, Ram B. 2010. Large-scale offshore wind power in the United States: assessment of
opportunities and barriers (Technical Report). NREL/TP-500-40745. National Renewable Energy
Laboratory, Golden (CO). http://www.nrel.gov/docs/fy10osti/40745.pdf.
Musial W, Heimiller D, Beiter P, Scott G, Draxl C. 2016. 2016 offshore wind energy resource assessment
for the United States (Technical Report). NREL/TP-5000-66599. National Renewable Energy
Laboratory (NREL), Golden (CO). http://www.nrel.gov/docs/fy16osti/66599.pdf.
Musial W, Beiter P, Schwabe P, Tian T, Stehly T, Spitsen P. 2017. 2016 offshore wind technologies
market report. US Department of Energy report.
https://energy.gov/sites/prod/files/2017/08/f35/2016%20Offshore%20Wind%20Technologies%20Ma
rket%20Report.pdf.
[NASA] National Aeronautics and Space Administration. 2008. Surface meteorology and solar energy
(SSE) Release 6.0 Data Set, 22-year Monthly & Annual Average (July 1983-June 2005). National
Aeronautical and Space Administration: Atmospheric Science Data Center.
https://eosweb.larc.nasa.gov/sse/.
[NREL] National Renewable Energy Laboratory. 2017a. 2017 annual technology baseline. Golden, CO:
National Renewable Energy Laboratory. https://atb.nrel.gov/.
NREL. 2017b. NREL MHK atlas. [accessed 2017 Sep 13]. 2017. https://maps.nrel.gov/mhk-atlas/.
[NREL] National Renewable Energy Laboratory OpenEI 2018. OpenEI website for Marine
Hydrokinetics. [accessed 2018 May 25]. https://openei.org/wiki/Marine_%26_Hydrokinetic.
National Research Council. 2013. An evaluation of the US Department of Energy's marine and
hydrokinetic resource assessments. Washington, DC: National Academies Press.
https://doi.org/10.17226/18278.
National Weather Service. 2017. Ocean Prediction Center. [accessed 2017 Sep 14].
http://www.opc.ncep.noaa.gov/Loops/NCOM/currents/Ncom_Curr_GmexHR_03_Day_flash.shtml.
Neary VS, Previsic M, Jepsen RA, Lawson MJ, Yu Y, Copping AE, Fontaine AA, Hallett KC, Murray
DK. 2014. Methodology for design and economic analysis of marine energy conversion (MEC)
technologies. SAND2014-9040. Sandia National Laboratories Albuquerque, New Mexico.
http://energy.sandia.gov/wp-content/gallery/uploads/SAND2014-9040-RMP-REPORT.pdf.
Pellow MA, Emmott CJM, Barnhardt CJ, Benson SM. 2015. Hydrogen or batteries for grid storage? A
net energy analysis. Energy Environ. Sci. 8(7):1938–1952.
http://pubs.rsc.org/en/content/articlehtml/2015/ee/c4ee04041d.
Power Technology. 2017. Pentland Firth Tidal power plant, Scotland. [accessed 2017 Sep].
http://www.power-technology.com/projects/pentland-firth-tidal-power-plant-scotland/.
Rafferty JP, Mero JL. 2011. Ocean thermal energy conversion (OTEC). Encyclopedia Britannica.
https://www.britannica.com/technology/ocean-thermal-energy-conversion.
78
Raye R. 2002. Characterization study of the Florida Current at 26.11 north latitude, 79.50 west longitude
for ocean current power generation [thesis]. Boca Raton: Florida Atlantic University (FL).
https://www.researchgate.net/publication/34994724_Characterization_study_of_the_Florida_Current
_at_26.11_north_latitude_79.50_west_longitude_for_ocean_current_power_generation_.
Rooney S, Bagbey R, Thresher R, Reed M. 2013. Open water testing workshop I report, International
Energy Agency (IEA). https://www.ocean-energy-systems.org/news/open-water-testing-workshop/.
Ruth M, Cutler D, Flores-Espino F, Stark G. 2017. The economic potential of nuclear-renewable hybrid
energy systems producing hydrogen. Report No.: NREL/TP-6A50-66764. Golden, CO: National
Renewable Energy Laboratory(. http://www.nrel.gov/docs/fy17osti/66764.pdf
Schwartz M, Heimiller D, Haymes S, Musial W. 2010. Assessment of offshore wind energy resources for
the United States. Report No. NREL/TP-500-45889. Golden, CO: National Renewable Energy
Laboratory (. http://www.nrel.gov/docs/fy10osti/45889.pdf
[SERI] Solar Energy Research Institute. 1989. Ocean thermal energy conversion: An overview. SERI/SP-
220-3024. Golden (CO:). Solar Energy Research Institute. 36 p.
https://www.nrel.gov/docs/legosti/old/3024.pdf.
Soares CG, Bento AR, Gonçalves M, Silva D, Martinho P. 2014. Numerical evaluation of the wave
energy resource along the Atlantic European coast. Comput. Geosci. 71:37-49.
https://www.sciencedirect.com/science/article/pii/S0098300414000582.
[UCAR] University Corporation for Atmospheric Research. 2011. What happened to the oil? [accessed
2017 Aug 10]. https://www2.ucar.edu/atmosnews/perspective/3968/what-happened-oil.
VanZwieten J, Driscoll FR, Leonessa A, Deane G. 2006. Design of a prototype ocean current turbine—
Part I: mathematical modeling and dynamics simulation. Ocean Eng.. 33(11-12).
https://www.sciencedirect.com/science/article/pii/S0029801805002507.
Vega LA. 1992. Economics of ocean thermal energy conversion (OTEC). RJ Seymour, ed. Ocean energy
recovery: The state of the art. New York: American Society of Civil Engineers.
http://hinmrec.hnei.hawaii.edu/wp-content/uploads/2010/01/OTEC-Economics-circa-1990.pdf.
Vega LA. 2016. Economics of ocean thermal energy conversion (OTEC): An update. Offshore
Technology Conference 2016, Houston, Texas.
Von Arx WS, Stewart HB, Apel JR. 1974. The Florida Current as a potential source of usable energy.
Proceedings of the MacArthur Workshop on the Feasibility of Extracting Usable Energy from the
Florida Current.
War, JC. 2011. Seawater air conditioning (SWAC) a renewable energy alternative. IEEE Xplore.
OCEANS 2011. DOI: 10.23919/OCEANS.2011.6107219. [accessed 2018 Feb 22].
http://ieeexplore.ieee.org/document/6107219/.
[Wikipedia] Wikipedia contributors. 2018. Ocean thermal energy conversion. Wikipedia, The Free
Encyclopedia. [accessed 2017 Sep 12].
https://en.wikipedia.org/w/index.php?title=Ocean_thermal_energy_conversion&oldid=819883825.

Department of the Interior (DOI)
The Department of the Interior protects and manages the Nation's natural
resources and cultural heritage; provides scientific and other information about
those resources; and honors the Nation’s trust responsibilities or special
commitments to American Indians, Alaska Natives, and affiliated island
communities.
Bureau of Ocean Energy Management (BOEM)
The mission of the Bureau of Ocean Energy Management is to manage
development of U.S. Outer Continental Shelf energy and mineral resources in
an environmentally and economically responsible way.
BOEM Environmental Studies Program
The mission of the Environmental Studies Program is to provide the
information needed to predict, assess, and manage impacts from offshore
energy and marine mineral exploration, development, and production activities
on human, marine, and coastal environments. The proposal, selection, research,
review, collaboration, production, and dissemination of each of BOEM’s
Environmental Studies follows the DOI Code of Scientific and Scholarly
Conduct, in support of a culture of scientific and professional integrity, as set
out in the DOI Departmental Manual (305 DM 3).
