
1
2018
___________________________________
Bladen County
Community
Health Needs
Assessment

2
Table of Contents
List of Figures ................................................................................................................................... 5
List of Tables ..................................................................................................................................... 7
Executive Summary .......................................................................................................................... 8
Service Area ...................................................................................................................................................... 8
Methods for Identifying Community Health Needs ............................................................................................ 8
Secondary Data ..................................................................................................................................................... 8
Primary Data ......................................................................................................................................................... 8
Summary of Findings ........................................................................................................................................ 8
Selected Priority Areas ...................................................................................................................................... 9
Conclusion ........................................................................................................................................................ 9
Introduction .................................................................................................................................... 10
About Health ENC ........................................................................................................................................... 10
Member Organizations ......................................................................................................................................... 11
Steering Committee ............................................................................................................................................. 12
HealthENC.org .................................................................................................................................................13
Consultants ..................................................................................................................................................... 14
Bladen County [Hospital / Health Department / Collaborative] ........................................................................ 15
Community Health Team Structure ..................................................................................................................... 15
Distribution ..................................................................................................................................................... 15
Evaluation of Progress Since Prior CHNA ........................................................................................ 16
Community Feedback on Prior CHNA ............................................................................................................. 16
Methodology ................................................................................................................................... 17
Overview .......................................................................................................................................................... 17
Secondary Data Sources & Analysis .................................................................................................................. 17
Health and Quality of Life Topic Areas ............................................................................................................ 18
Health ENC Region Comparison ...................................................................................................................... 18
Primary Data Collection & Analysis ................................................................................................................. 18
Community Survey .............................................................................................................................................. 19
Focus Group Discussions ..................................................................................................................................... 22
Data Considerations ........................................................................................................................................ 23
Prioritization .................................................................................................................................................. 24
Overview of Bladen County .............................................................................................................. 25
About Bladen County ....................................................................................................................................... 25
Demographic Profile ....................................................................................................................................... 26
Population .......................................................................................................................................................... 26
Age and Gender ................................................................................................................................................... 28
Birth Rate ............................................................................................................................................................ 30
Race/Ethnicity ..................................................................................................................................................... 30
Tribal Distribution of Population ......................................................................................................................... 32
Military Population ............................................................................................................................................. 32
Veteran Population.............................................................................................................................................. 33
Socioeconomic Profile ..................................................................................................................................... 34
NC Department of Commerce Tier Designation .................................................................................................... 34
Income ................................................................................................................................................................ 34
Poverty ................................................................................................................................................................ 36
Housing .............................................................................................................................................................. 39
Food Insecurity ................................................................................................................................................... 41
Employment ........................................................................................................................................................ 43
SocioNeeds Index ................................................................................................................................................ 44
Educational Profile ......................................................................................................................................... 45
Educational Attainment ....................................................................................................................................... 45
High School Dropouts .......................................................................................................................................... 47
High School Suspension Rate ............................................................................................................................... 48
Transportation Profile .................................................................................................................................... 50
Crime and Safety ............................................................................................................................................. 52

3
Violent Crime and Property Crime ....................................................................................................................... 52
Juvenile Crime .................................................................................................................................................... 54
Child Abuse ......................................................................................................................................................... 56
Incarceration ...................................................................................................................................................... 57
Access to Healthcare, Insurance and Health Resources Information ............................................................... 58
Health Insurance ................................................................................................................................................. 58
Civic Activity ................................................................................................................................................... 60
Political Activity .................................................................................................................................................. 60
Findings ..........................................................................................................................................62
Secondary Data Scoring Results ...................................................................................................................... 62
Primary Data ................................................................................................................................................... 62
Community Survey .............................................................................................................................................. 62
Focus Group Discussions ..................................................................................................................................... 65
Data Synthesis ................................................................................................................................................. 66
Topic Areas Examined in This Report .................................................................................................................. 67
Navigation Within Each Topic .............................................................................................................................. 68
Heart Disease & Stroke .................................................................................................................................... 69
Key Issues ........................................................................................................................................................... 69
Secondary Data ................................................................................................................................................... 69
Primary Data ....................................................................................................................................................... 70
Highly Impacted Populations ............................................................................................................................... 70
Diabetes ........................................................................................................................................................... 71
Key Issues ............................................................................................................................................................71
Secondary Data ....................................................................................................................................................71
Primary Data ........................................................................................................................................................71
Highly Impacted Populations ................................................................................................................................71
Prevention & Safety ......................................................................................................................................... 72
Key Issues ........................................................................................................................................................... 72
Secondary Data ................................................................................................................................................... 72
Primary Data ....................................................................................................................................................... 72
Highly Impacted Populations ............................................................................................................................... 73
Maternal, Fetal & Infant Health ....................................................................................................................... 74
Key Issues ........................................................................................................................................................... 74
Secondary Data ................................................................................................................................................... 74
Primary Data ....................................................................................................................................................... 74
Highly Impacted Populations ............................................................................................................................... 75
Access to Health Services ................................................................................................................................ 76
Key Issues ........................................................................................................................................................... 76
Secondary Data ................................................................................................................................................... 76
Primary Data ....................................................................................................................................................... 77
Mortality ......................................................................................................................................................... 78
Other Significant Health Needs........................................................................................................ 79
Economy ......................................................................................................................................................... 79
Exercise, Nutrition & Weight ........................................................................................................................... 79
Substance Abuse ............................................................................................................................................. 80
A Closer Look at Highly Impacted Populations ............................................................................... 82
Older Adults & Aging ....................................................................................................................................... 82
Disparities by Age, Gender and Race/Ethnicity ................................................................................................ 82
Geographic Disparities .................................................................................................................................... 83
Conclusion ..................................................................................................................................... 84
Appendix A. Impact Since Prior CHNA ............................................................................................85
Appendix B. Secondary Data Scoring .............................................................................................. 88
Overview ......................................................................................................................................................... 88
Comparison Score ............................................................................................................................................... 88
Indicator Score .................................................................................................................................................... 88
Topic Score ......................................................................................................................................................... 88
Comparison Scores ......................................................................................................................................... 89
Comparison to a Distribution of North Carolina Counties and U.S. Counties ........................................................ 89
Comparison to North Carolina Value and U.S. Value ............................................................................................ 89
Comparison to Healthy People 2020 and Healthy North Carolina 2020 Targets .................................................... 90
4
Trend Over Time ................................................................................................................................................. 90
Missing Values .................................................................................................................................................... 90
Indicator Scoring ............................................................................................................................................ 90
Topic Scoring .................................................................................................................................................. 91
Age, Gender and Race/Ethnicity Disparities .................................................................................................... 91
Topic Scoring Table ......................................................................................................................................... 92
Indicator Scoring Table ................................................................................................................................... 93
Sources .......................................................................................................................................................... 107
Appendix C. Primary Data ............................................................................................................. 108
English Survey .............................................................................................................................................. 109
Spanish Survey ............................................................................................................................................... 141
Focus Group Questions .................................................................................................................................. 173
Appendix D. Community Resources ............................................................................................... 176
Appendix E. Community Resources ............................................................................................... 188
Appendix F. Community Resources ............................................................................................... 192
Appendix G. Community Resources ............................................................................................... 194
5
List of Figures
Figure 1. Health ENC Online Data Platform ................................................................................................ 13
Figure 2. Secondary Data Scoring ............................................................................................................... 17
Figure 3. Education of Community Survey Respondents ............................................................................ 20
Figure 4. Employment Status of Community Survey Respondents ............................................................ 21
Figure 5. Health Care Coverage of Community Survey Respondents ......................................................... 21
Figure 6. Total Population (U.S. Census Bureau) ........................................................................................ 26
Figure 7. Population Density of Health ENC Counties (U.S. Census Bureau, 2010) .................................... 27
Figure 8. Population by Age (U.S. Census Bureau, 2016) ........................................................................... 28
Figure 9. Population 18+ and 65+ (U.S. Census Bureau, 2016)................................................................... 29
Figure 10. Birth Rate (North Carolina State Center for Health Statistics) ................................................... 30
Figure 11. Population by Race/Ethnicity (U.S. Census Bureau, 2016) ........................................................ 31
Figure 12. Population in Military / Armed Forces (American Community Survey) .................................... 32
Figure 13. Veteran Population (American Community Survey, 2012-2016) .............................................. 33
Figure 14. Median Household Income (American Community Survey, 2012-2016) .................................. 34
Figure 15. Median Household Income of Health ENC Counties (American Community Survey, 2012-
2016) ........................................................................................................................................................... 35
Figure 16. Median Household Income by Zip Code (American Community Survey, 2012-2016) .............. 36
Figure 17. People Living Below Poverty Level (American Community Survey, 2012-2016) ....................... 37
Figure 18. Children Living Below Poverty Level (American Community Survey, 2012-2016) ..................... 37
Figure 19. People 65+ Living Below Poverty Level (American Community Survey, 2012-2016) ................ 38
Figure 20. Persons with Disability Living in Poverty (American Community Survey, 2012-2016) .............. 38
Figure 21. Mortgaged Owners Median Monthly Household Costs, Health ENC Counties (American
Community Survey 2012-2016) .................................................................................................................. 39
Figure 22. Severe Housing Problems (County Health Rankings, 2010-2014) ............................................. 40
Figure 23. Households with Children Receiving SNAP (American Community Survey, 2012-2016) .......... 41
Figure 24. SocioNeeds Index® (Conduent Healthy Communities Institute, 2018) ..................................... 44
Figure 25. People 25+ with a High School Degree or Higher and Bachelor’s Degree or Higher (American
Community Survey, 2012-2016) ................................................................................................................. 46
Figure 26. People 25+ with a High School Degree or Higher by Zip Code (American Community Survey,
2012-2016) .................................................................................................................................................. 47
Figure 27. High School Dropout Rate (North Carolina Department of Public Instruction) ......................... 48
Figure 28. High School Suspension Rate (North Carolina Department of Public Instruction) .................... 49
Figure 29. Mode of Commuting to Work (American Community Survey, 2012-2016) .............................. 50
Figure 30. Workers who Drive Alone to Work (American Community Survey, 2012-2016) ...................... 51
Figure 31. Violent Crime Rate (North Carolina Department of Justice) ..................................................... 52
Figure 32. Property Crime Rate (North Carolina Department of Justice) ................................................... 53
Figure 33. Juvenile Undisciplined Rate (North Carolina Department of Public Safety) .............................. 54
Figure 34. Juvenile Delinquent Rate (North Carolina Department of Public Safety) .................................. 55
Figure 35. Child Abuse Rate (Management Assistance for Child Welfare, Work First, and Food &
Nutrition Services in North Carolina & University of North Carolina at Chapel Hill Jordan Institute for
Families) ...................................................................................................................................................... 56
Figure 36. Incarceration Rate (North Carolina Department of Public Safety) ............................................ 57
Figure 37. Persons with Health Insurance (Small Area Health Insurance Estimates, 2016) ....................... 58
Figure 38. Persons Only Receiving Health Insurance through Medicaid, Medicare or Military Healthcare
(American Community Survey, 2012-2016) ................................................................................................ 59
6
Figure 39. Voting Age Population (American Community Survey, 2012-2016) .......................................... 60
Figure 40. Voter Turnout in the Last Presidential Election (North Carolina State Board of Elections, 2016)
.................................................................................................................................................................... 61
Figure 41. Top Quality of Life Issues, as Ranked by Survey Respondents .................................................. 63
Figure 42. Level of Agreement Among Bladen County Residents in Response to Nine Statements about
their Community ......................................................................................................................................... 64
Figure 43. Services Needing the Most Improvement, as Ranked by Survey Respondents ........................ 64
Figure 44. Health Behaviors that Residents Need More Information About, As Ranked by Survey
Respondents ............................................................................................................................................... 65
Figure 46. Data Synthesis ............................................................................................................................ 67
Figure 47. Secondary Data Scoring Overview ............................................................................................. 88
Figure 48. Score Range ................................................................................................................................ 88
Figure 49. Comparisons used in Secondary Data Scoring ........................................................................... 89
Figure 50. Compare to Distribution Indicator Gauge .................................................................................. 89
Figure 51. Distribution of County Values .................................................................................................... 89
Figure 52. Comparison to Single Value ....................................................................................................... 89
Figure 53. Comparison to Target Value ...................................................................................................... 90
Figure 54. Trend Over Time ........................................................................................................................ 90
7
List of Tables
Table 1. Significant Health Needs ................................................................................................................. 9
Table 2. Health and Quality of Life Topic Areas .......................................................................................... 18
Table 3. Survey Respondents ...................................................................................................................... 19
Table 4. List of Focus Group Discussions .................................................................................................... 22
Table 5. Population by Gender and Age (U.S. Census Bureau, 2016) ......................................................... 29
Table 6. Named Tribes in North Carolina (American Community Survey, 2012-2016) .............................. 32
Table 7. SocioNeeds Index® (Conduent Healthy Communities Institute, 2018)......................................... 45
Table 8. Secondary Data Scoring Results by Topic Area ............................................................................. 62
Table 9. Focus Group Results by Topic Area ............................................................................................... 66
Table 10. Criteria for Identifying the Top Needs from each Data Source ................................................... 66
Table 11. Topic Areas Examined In-Depth in this Report ........................................................................... 67
Table 12. Description of Gauges and Icons used in Secondary Dara Scoring ............................................. 68
Table 13. Data Scoring Results for Heart Disease & Stroke ........................................................................ 69
Table 14. Data Scoring Results for Diabetes ............................................................................................... 71
Table 15. Data Scoring Results for Prevention & Safety ............................................................................. 72
Table 16. Data Scoring Results for Maternal, Fetal & Infant Health ........................................................... 74
Table 17. Data Scoring Results for Access to Health Services..................................................................... 76
Table 18. Leading Causes of Mortality (2014-2016, CDC WONDER) .......................................................... 78
Table 19. Indicators with Significant Race/Ethnic, Age, or Gender Disparities .......................................... 82
Table 20. Topic Scores for Bladen County .................................................................................................. 92
Table 21. Indicator Scores by Topic Area .................................................................................................... 93
Table 22. Indicator Sources and Corresponding Number Keys ................................................................ 107

8
Executive Summary
Bladen County is pleased to present its 2018 Community Health Needs Assessment. This report provides
an overview of the methods and process used to identify and prioritize significant health needs in
Bladen County.
Service Area
The service area for this report is defined as the geographical boundary of Bladen County, North
Carolina. Bladen County is located inland and is the fourth largest county by land area. The county has a
total area of 887 square miles, of which 874 is land and 13 square miles is water.
Methods for Identifying Community Health Needs
Secondary Data
Secondary data used for this assessment were collected and analyzed from Conduent HCI’s community
indicator database. The database, maintained by researchers and analysts at Conduent HCI, includes
over 100 community indicators from various state and national data sources such as the North Carolina
Department of Health and Human Services, the Centers for Disease Control and Prevention and the
American Community Survey. See Appendix B for a full list of data sources used.
Indicator values for Bladen County were compared to North Carolina counties and U.S. counties to
identify relative need. Other considerations in weighing relative areas of need included comparisons to
North Carolina state values, comparisons to national values, trends over time, Healthy People 2020
targets and Healthy North Carolina 2020 targets. Based on these seven different comparisons, indicators
were systematically ranked from high to low need. For a detailed methodology of the analytic methods
used to rank secondary data indicators see Appendix B.
Primary Data
The primary data used in this assessment consisted of (1) a community survey distributed through
online and paper submissions and (4) focus group discussions. Over 400 Bladen County residents
contributed their input on the community’s health and health-related needs, barriers, and
opportunities, with special focus on the needs of vulnerable and underserved populations.
See Appendix C for all primary data collection tools used in this assessment.
Summary of Findings
The CHNA findings are drawn from an analysis of an extensive set of secondary data (over 100 indicators
from national and state data sources) and in-depth primary data from community leaders, health and
non-health professionals who serve the community at large, vulnerable populations, and populations
with unmet health needs. Through a synthesis of the primary and secondary data the significant health
needs were determined for Bladen County and are displayed in
Table 1 o the next page.

9
Table 1. Significant Health Needs
Access to Health Services
Diabetes
Economy
Exercise, Nutrition & Weight
Heart Disease & Stroke
Maternal, Fetal & Infant Health
Prevention & Safety
Substance Abuse
Selected Priority Areas
The prioritization process identified 3 focus areas: (1) Exercise, Nutrition and Weight (2) Substance
Abuse (3) New and Emerging Issue identified as Maternal, Fetal & Infant Health.
Conclusion
This report describes the process and findings of a comprehensive health needs assessment for the
residents of Bladen County, North Carolina. The prioritization of the identified significant health needs
will guide community health improvement efforts of Bladen County. Following this process, Bladen
County will outline how they plan to address the prioritized health needs in their implementation plan.
Priorities
Maternal, Fetal
&
Infant Health
(New & Emerging
Issue)
Substance
Abuse
Exercise, Nutrition
&
Weight

10
Introduction
Bladen County is pleased to present the 2018 Community Health Needs Assessment, which provides an
overview of the significant community health needs identified in Bladen County, North Carolina.
The goal of this report is to offer a meaningful understanding of the most pressing health needs across
Bladen County, as well as to guide planning efforts to address those needs. Special attention has been
given to the needs of vulnerable populations, unmet health needs or gaps in services, and input
gathered from the community.
Findings from this report will be used to identify, develop and target initiatives to provide and connect
community members with resources to improve the health challenges in their communities.
The 2018 Bladen County Community Health Needs Assessment was developed through a partnership
between the Bladen County Department of Health & Human Services, Cape Fear Valley Hospital, Health
ENC and Conduent Healthy Communities Institute, with Cape Fear Valley Hospital serving as the fiscal
sponsor.
About Health ENC
Initiated in 2015 by the Office of Health Access at the Brody School of Medicine at East Carolina
University, Health ENC grew out of conversations with health care leaders about improving the
community health needs assessment (CHNA) process in eastern North Carolina. Health ENC, now a
program of the Foundation for Health Leadership and Innovation (FHLI), coordinates a regional CHNA in
33 counties of eastern North Carolina. In addition, the Health ENC Program Manager works to build
coalitions and partnerships that will address health issues identified through the regional CHNA process.
As part of the Affordable Care Act, not for profit and government hospitals are required to conduct
CHNAs every three years. Similarly, local health departments in North Carolina are required by the
Division of Public Health (DPH) in the NC Department of Health and Human Services (DHHS) to conduct
periodic community health assessments as well. Local health departments have been required to submit
their community health needs assessments once every four years. The particular year CHNA submissions
are made by hospitals within a three-year cycle or by local health departments within a four-year cycle is
not uniform across the state or region.
Additionally, although local health departments and hospitals have guidance from their respective
oversight authorities on how to conduct and report the results of their CHNAs, that guidance allows for
wide variations in the execution of these reports. The methodologies, specific data items gathered, the
interpretation of the data as well as the general approach and scope of one CHNA may have little
resemblance to a CHNA in another jurisdiction or conducted by another organization.
For these reasons, health care leaders across eastern North Carolina have partnered to standardize the
CHNA process for health departments and hospitals in the region. This effort will also sync all participant
organizations on to the same assessment cycle. Combining efforts of local health departments and
hospitals in a regional CHNA will ultimately lead to an improvement in the quality and utility of
population health data, the ability to compare and contrast information and interventions across
geographic boundaries, and the reduction of costs for everyone involved, while maintaining local control
and decision-making with regard to the selection of health priorities and interventions chosen to

11
address those priorities. Simultaneously, it will create opportunities for new and better ways to
collaborate and partner with one another.
Upon receipt of generous funding support provided by The Duke Endowment, the Office of Health
Access at ECU’s Brody School of Medicine transferred administrative and operational responsibility for
Health ENC to the Foundation for Health Leadership and Innovation in 2018. The project continues to be
guided by a steering committee representing local health departments, hospitals and other stakeholders
committed to improving the health of the people of eastern North Carolina.
Member Organizations
Health ENC is comprised of more than 40 organizations. Twenty-two hospitals, twenty-one health
departments and two health districts participated in the regional CHNA.
Partner Organizations
Foundation for Health Leadership & Innovation
ECU Brody School of Medicine
The Duke Endowment
Hospitals and Health Systems
Cape Fear Valley Health (Cape Fear Valley Medical Center, Hoke Hospital and Bladen County
Hospital)
Carteret Health Care
Halifax Regional Medical Center
Johnston Health
UNC Lenoir Health Care
Nash Health Care System
Onslow Memorial Hospital
The Outer Banks Hospital
Pender Memorial Hospital
Sampson Regional Medical Center
Sentara Albemarle Medical Center
Vidant Beaufort Hospital
Vidant Bertie Hospital
Vidant Chowan Hospital
Vidant Duplin Hospital
Vidant Edgecombe Hospital
Vidant Medical Center
Vidant Roanoke-Chowan Hospital
Wayne UNC Health Care
Wilson Medical Center
Health Departments and Health Districts
Albemarle Regional Health Services
Beaufort County Health Department
Bladen County Health Department
Carteret County Health Department
12
Cumberland County Health Department
Dare County Department of Health and Human Services
Duplin County Health Department
Edgecombe County Health Department
Franklin County Health Department
Greene County Department of Public Health
Halifax County Public Health System
Hoke County Health Department
Hyde County Health Department
Johnston County Public Health Department
Lenoir County Health Department
Martin-Tyrrell-Washington District Health Department
Nash County Health Department
Onslow County Health Department
Pamlico County Health Department
Pitt County Health Department
Sampson County Health Department
Wayne County Health Department
Wilson County Health Department
Steering Committee
Health ENC is advised by a Steering Committee whose membership is comprised of health department
and hospital representatives participating in the regional CHNA, as well as other health care
stakeholders from eastern North Carolina. The program manager oversees daily operations of the
regional community health needs assessment and Health ENC.
Health ENC Program Manager
Will Broughton, MA, MPH, CPH - Foundation for Health Leadership & Innovation
Health ENC Steering Committee Members
Constance Hengel, RN, BSN, HNB-BC - Director, Community Programs and Development, UNC
Lenoir Health Care
James Madson, RN, MPH - Steering Committee Chair, Health Director, Beaufort County Health
Department
Battle Betts - Director, Albemarle Regional Health Services
Caroline Doherty - Chief Development and Programs Officer, Roanoke Chowan Community
Health Center
Melissa Roupe, RN, MSN - Sr Administrator, Community Health Improvement, Vidant Health
Davin Madden – Heath Director, Wayne County Health Department
Angela Livingood – Pharmacy Manager, Pender Memorial Hospital
Lorrie Basnight, MD, FAAP - Executive Director, Eastern AHEC, Associate Dean of CME, Brody
School of Medicine
Anne Thomas- President/CEO, Foundation for Health Leadership & Innovation

13
HealthENC.org
The Health ENC web platform, shown in Figure 1, is a resource for the community health needs
assessment process in eastern North Carolina. The website serves as a “living” data platform, providing
public access to indicator data that is continuously updated, easy to understand and includes
comparisons for context. Much of the data used in this assessment is available on HealthENC.org and
can be downloaded in multiple formats. Results of the 2018 Eastern North Carolina Community Health
Survey can be downloaded by county or the entire Health ENC Region.
In addition to indicator data, the website serves as a repository for local county reports, funding
opportunities, 2-1-1 resources and more. Health departments, hospital leaders and community health
stakeholders in the 33-county region are invited to use the website as a tool for community assessment,
strategic planning, identifying best practices for improvement, collaboration and advocacy.
Visit HealthENC.org to learn more.
Figure 1. Health ENC Online Data Platform

14
Consultants
Health ENC commissioned Conduent Healthy Communities Institute (HCI) to assist with its Community
Health Needs Assessment.
Conduent Healthy Communities Institute is a multi-disciplinary team of public health experts, including
healthcare information technology veterans, academicians and former senior government officials, all
committed to help health-influencing organizations be successful with their projects. Conduent HCI uses
collaborative approaches to improve community health and provides web-based information systems to
public health, hospital and community development sectors, to help them assess population health.
Conduent HCI works with clients across 38 states to drive improved community health outcomes by
assessing needs, developing focused strategies, identifying appropriate intervention programs,
establishing progress monitoring systems, and implementing performance evaluation processes.
Working with diverse clients nationwide has contributed to Conduent HCI’s national knowledge base of
population health solutions. In addition, by engaging directly with clients and communities through the
primary data collection process and final workshops, Conduent HCI works on behalf of our clients to
build trust between and among organizations and their communities.
To learn more about Conduent HCI, please visit https://www.conduent.com/community-population-
health/.
Report authors from Conduent HCI:
Caroline Cahill, MPH
Esther Chung
Liora Fiksel
Zachery Flores
Courtney Kaczmarsky, MPH
Cassandra Miller, MPH
Cara Woodard

15
Bladen County (Hospital/Health Department/Collaborative
CHNA Community Health Team
This document was completed by the following organizations:
Cape Fear Valley Bladen County Hospital
Bladen County Health Department
This document is one of many collaborative efforts between Cape Fear Valley (CFV) Bladen County
Hospital and Bladen County Health Department. CFV Bladen County Hospital is our one and only, local
county hospital. The hospital and the health department serve on many projects and committees
together, and have developed a supportive and collaborative relationship with one another.
Community Health Team Structure
The CHNA Steering Committee is made up of the following agencies and members:
Cape Fear Valley Bladen County Hospital- Teresa Duncan
Cape Fear Valley Bladen County Hospital- Diana Harris
Cape Fear Valley- Will Haithcock
Bladen County Commissioner- Charles Ray Peterson
Bladen County Manager- Greg Martin
Bladen Community College- Tiina Mundy
Innovative Approaches- April Oxendine
Department of Social Services- Jill Sampson
Bladen County Schools- Susan Lanier
Bladen County Library- Kelsey Edwards
Bladen County Health Department- Marianne Valentiner
Bladen County Health Department- Monique Travise
Distribution
An electronic copy of this report is available on:
HealthENC.org
www.bladeninfo.org
www.capefearvalley.com
To view or obtain a paper copy of this document,
Contact:
Bladen County Health Department
Health Education: 910.862.6900 extension 5
P.O. Box 189/300 Mercer Mill Road
Elizabethtown, NC 28337

16
Evaluation of Progress Since Prior CHNA
The CHNA cycle occurs every three years as a collaboration effort between the health department and
the hospital, in which a document is submitted to the state.
As part of the 2015 Community Health Needs Assessment, Heart Disease, Cancer and Diabetes/Obesity
were selected as prioritized health needs. CFVHS hosted over 100 outreach events throughout our
service area in 2017 to address the issues. Preventive education, screening, and support groups were
just a few of the ways we address our community needs. The CFVHS foundation funds nearly 200
screening mammograms each year to catch breast cancer in earlier stages. CPR instruction and Blood
Pressure checks are a service we offer at most outreach events. Our Residency program fosters outreach
amongst our residents, and in their first year they performed over 600 blood pressure screenings at
events. Our Pediatric Diabetes Family Fun Run helped raise awareness and provide education to 220
people in our community. We will continue our aggressive outreach efforts to help educate our patients
about the various risk factors associated with all the identified needs. The health system has added new
access points in the forms of urgent care and primary care practices so patients have greater access to
physicians. We are strengthening our relationships with our local health departments and identifying
potential collaborations with community stakeholders.
A detailed table describing the strategies/action steps and indicators of improvement for each priority
area can be found in Appendix A.
C Community Feedback on Prior CHNA
The 2015 Bladen County Community Health Needs Assessment was made available to the public via
(http://www.capefearvalley.com/downloads/CHNA/Bladen-Hospital-CHNA%202016.pdf).
Community members were invited to submit feedback via phone, email or mail.
No comments had been received on the preceding CHNA at the time this report was written.

17
Methodology
Overview
Two types of data are analyzed for this Community Health Needs Assessment: secondary data and
primary data. Secondary data is data that has been collected from other sources while primary data has
been collected directly as a part of this report. Each type of data is analyzed using a unique
methodology, and findings are organized by health topic areas. These findings are then synthesized for a
comprehensive overview of the health needs in Bladen County.
Secondary Data Sources & Analysis
The main source of the secondary data used for this assessment is HealthENC.org
1
, a web-based
community health platform developed by Conduent Healthy Communities Institute. The Health ENC
dashboard brings non-biased data, local resources, and a wealth of information in one accessible, user-
friendly location. The secondary data analysis was conducted using Conduent HCI’s data scoring tool,
and the results are based on the 145 health and quality of life indicators that were queried on the
Health ENC dashboard on July 18, 2018. The data are primarily derived from state and national public
data sources. For each indicator on the platform, there exist several comparisons to assess Bladen
County's status, including how Bladen County compares to other communities, whether health targets
have been met, and the trend of the indicator value over time.
Conduent HCI’s data scoring tool systematically
summarizes multiple comparisons to rank indicators
based on highest need (Figure 2). For each indicator, the
Bladen County value is compared to a distribution of
North Carolina and U.S. counties, state and national
values, Healthy People 2020 targets, Healthy North
Carolina 2020 targets, and the trend over the four most
recent time periods of measure. Each indicator is then
given a score based on the available comparisons. The
scores range from 0 to 3, where 0 indicates the best
outcome and 3 indicates the worst outcome. Availability
of each type of comparison varies by indicator and is
dependent upon the data source, comparability with data
collected from other communities, and changes in
methodology over time. The indicators are grouped into topic areas for a higher-level ranking of
community health needs.
Please see Appendix B for further details on the secondary data scoring methodology.
1
Health ENC is an online platform that provides access to health, economic and quality of life data, evidence-based
programs, funding opportunities and other resources aimed at improving community health. The platform is
publicly available and can be accessed at http://www.healthenc.org/.
Figure 2. Secondary Data Scoring

18
Health and Quality of Life Topic Areas
Table 2 shows the health and quality of life topic areas into which indicators are categorized. These topic
areas are broadly based on the Healthy People 2020 framework, with each topic area containing
multiple indicators. The five topic areas exhibiting the most significant need as evidenced by the
secondary data analysis are included for in-depth exploration in the data findings. Four topic areas
specific to population subgroups, including Children’s Health, Men’s Health, Women’s Health, and Older
Adults & Aging, include indicators spanning a variety of topics. If a particular subgroup receives a high
topic score, it is not highlighted independently as one of the top 5 findings but is discussed within the
narrative as it relates to highly impacted populations. Three additional categories (County Health
Rankings, Mortality Data, and Wellness & Lifestyle) are not considered for in-depth exploration, since all
three are general categories that include indicators spanning a wide variety of topics. Topic areas with
fewer than three indicators are considered to have data gaps and do not receive topic scores. These
topics are indicated by an asterisk in Table 2.
Table 2. Health and Quality of Life Topic Areas
Access to Health Services
Family Planning*
Prevention & Safety
Cancer
Food Safety*
Public Safety
Children's Health*
Heart Disease & Stroke
Respiratory Diseases
County Health Rankings
Immunizations & Infectious Diseases
Social Environment
Diabetes
Maternal, Fetal & Infant Health
Substance Abuse
Disabilities*
Men's Health*
Teen & Adolescent Health*
Economy
Mental Health & Mental Disorders
Transportation
Education
Mortality Data
Vision*
Environment
Older Adults & Aging
Wellness & Lifestyle
Environmental & Occupational Health
Other Chronic Diseases
Women's Health
Exercise, Nutrition, & Weight
Oral Health*
*Topic area has fewer than 3 indicators and is considered a data gap. No topic score is provided.
Health ENC Region Comparison
When available, county-level data are compared to the state of North Carolina, as well as Health ENC
Counties. The Health ENC region consists of 33 counties in eastern North Carolina participating in the
regional CHNA: Beaufort, Bertie, Bladen, Camden, Carteret, Chowan, Cumberland, Currituck, Dare,
Duplin, Edgecombe, Franklin, Gates, Greene, Halifax, Hertford, Hoke, Hyde, Johnston, Lenoir, Martin,
Nash, Onslow, Pamlico, Pasquotank, Pender, Perquimans, Pitt, Sampson, Tyrrell, Washington, Wayne
and Wilson. Values for the Health ENC region were calculated by aggregating data from these 33
counties.
Primary Data Collection & Analysis
To expand upon the information gathered from the secondary data, Health ENC Counties collected
community input. Primary data used in this assessment consists of focus groups and both an English-
language and Spanish-language community survey. All community input tools are available in Appendix
C.

19
Community Survey
Community input was collected via a 57-question online and paper survey available in both English and
Spanish. Survey Monkey was the tool used to distribute and collect responses for the community survey.
Completed paper surveys were entered into the Survey Monkey tool.
The community survey was distributed across Health ENC’s entire survey area from April 18, 2018 – June
30, 2018.
Survey Distribution
The CHNA surveys were distributed in Spanish and English through survey links and in paper form. The
survey links were shared through the CHNA Steering Committee, local media sites (Bladen Online and
Bladen Journal), Bladen County Employee list serve, and Healthy Bladen Collaborative Partners, via link
through email to share within their respective agencies and contacts. The electronic version was shared
within the Cape Fear Valley Bladen Hospital system and provided to staff via link through email and
paper copies. Paper copies were given to Jury Duty participants on two separate jury duty dates. Paper
copies were given out at hospital and health department clinics. Additional Spanish paper surveys were
taken to local Hispanic stores and restaurants. Due to budgetary restrictions, incentives were not
provided to survey participants. Majority of survey participants completed the survey via electronic
form.
Table 3 summarizes the number of survey respondents. A total of 18,917 responses were collected
across all 33 counties, with a survey completion rate of 86.5%, resulting in 16,358 complete responses
across the entire survey area. A total of 452 responses were collected from Bladen County residents,
with a survey completion rate of 88.3%, resulting in 399 complete responses from Bladen County. The
survey analysis included in this CHNA report is based on complete responses.
Table 3. Survey Respondents
Number of Respondents*
Service Area
English
Survey
Spanish
Survey
Total
All Health ENC Counties
15,917
441
16,358
Bladen County
388
11
399
*Based on complete responses
Survey participants were asked a range of questions related - but not limited - to: what populations are
most negatively affected by poor health outcomes in Bladen County, what their personal health
challenges are, and what the most critical health needs are for Bladen County. The survey instrument is
available in Appendix C.
Demographics of Survey Respondents
The following charts and graphs illustrate Bladen County demographics of the community survey
respondents. Among Bladen County survey participants, 26.2% of respondents were between the ages
of 15 and 39 while the highest concentration of respondents (61.8%) grouped into the 40-64 age range.
Only 12% of respondents were over 65 years old. The majority of respondents were female (77.4%),
White (70.8%), spoke English at home (97.1%) and Not Hispanic (95.1%).The majority of survey
respondents had some exposure to higher education, with the highest share of respondents (25.8 %)
having Associate’s Degrees or Vocational training and the next highest share of respondents (19.7%)
having a Bachelor’s degree followed closely behind by those with some college experience, no degree
(19.5%) (Figure 3).

20
Figure 3. Education of Community Survey Respondents
As shown in Figure 4, the highest share of respondents were employed full-time (69.2 %) and the next
highest share of respondents were either employed part time (11.1 %) or retired (11.1%). Household
annual incomes varied amongst the community survey participants, 30.6% had a household income that
totaled less than $34,999 before taxes. 41.1% of respondents had a household income that totaled
between $35,000 and $74,999 before taxes while 28.4% had a household income over $75,000 before
taxes. The average household size was 2.8 individuals.
25.8%
19.7%
19.5%
16.8%
13.7%
2.9%
0.8% 0.8%
0%
5%
10%
15%
20%
25%
30%

21
Figure 4. Employment Status of Community Survey Respondents
Figure 5 shows the health insurance coverage of community survey respondents. More than half of
survey respondents have health insurance provided by their employer (57.0%) or their spouse’s
employer (12.1%), while 27.5% have Medicare and 3.0% have no health insurance of any kind.
Figure 5. Health Care Coverage of Community Survey Respondents
69.2%
11.1% 11.1%
0.0%
2.4%
3.4%
3.2%
2.4%
2.1%
1.8%
0%
10%
20%
30%
40%
50%
60%
70%
80%
64.2%
10.9%
8.5%
8.0%
5.4%
4.7%
4.4%
2.3%
1.3%
0.5%
0%
10%
20%
30%
40%
50%
60%
70%

22
Overall, the community survey participant population consisted of white, non-Hispanic, women with
some higher education and employed full-time. The survey was a convenience sample survey, and thus
the results are not representative of the community population as a whole.
Key findings from select questions on the community survey are integrated into this report by theme or
topic area, with an emphasis on the most significant needs as evidenced by both primary and secondary
data. This approach is intended to offer a meaningful understanding of health needs. A summary of full
survey results (all 57 questions) is available on HealthENC.org. Full results can be downloaded by county
or for the entire Health ENC Region.
Focus Group Discussions
Another form of community input was collected through focus groups. Focus groups are carefully
constructed dialogues that invite diverse groups of people to discuss important and pressing issues.
Focus groups provide community members an opportunity to engage in productive learning and sharing
sessions. Focus group discussions focused on community strengths, opportunities for improvement,
existing resources, health needs, and possible solutions for improving the health of Bladen County. A list
of questions asked at the focus groups is available in Appendix C.
The purpose of the focus groups for Health ENC’s 2018 CHNA/CHA was to engage with a broad cross-
section of individuals from each county, such as migrant worker groups, healthcare workers, or county
employees, to name a few.
Conduent HCI consultants developed a Focus Group Guide and led training webinars for Health ENC
members. Topics included facilitation techniques, moderator and note taker roles, as well as tips and
expectations for documenting focus group discussions. The list of focus group questions was reviewed
and a transcript was provided for documentation purposes.
Focus groups were scheduled with meetings with collaborative partners in the county. Notifications and
requests were communicated via email and telephone. The Healthy Bladen Collaborative served as a
focus group, which is made up of surrounding agency representatives. Members represented the library,
4H, Smart Start, etc. The second group consisted of the School Health Advisory Council committee
members, which represented school personnel from the county schools. These were principals,
administrative, teachers and school nurses. Incentives were not provided to the participants due to
budget restrictions.
Four focus group discussions were completed within Bladen County between May 29, 2018 – August 3,
2018 with a total of 34 individuals. Participants included community members and health and school
officials. Table 4 shows the date, location, population type, and number of participants for each focus
group.
Table 4. List of Focus Group Discussions
Date Conducted
Focus Group Location
Population Type
Number of
Participants
5/29/2018
Bladen County Health Department
Healthy Bladen
Collaborative
9
6/25/2018
Bladen County Board of Education
School Health Advisory
Council
9
7/31/2018
Participant’s Home
Women, >65
7
8/03/2018
Bladen County Health Department
Health Department Staff
9

23
Focus group transcripts were coded and analyzed by common theme. The frequency with which a topic
area was discussed in the context of needs and concerns or barriers and challenges to achieving health
was used to assess the relative importance of the need in the community. Key themes that emerged
from the focus group discussions are integrated into this report by topic area, with an emphasis on the
most significant needs as evidenced by both primary and secondary data. A deeper analysis of focus
group findings is available on HealthENC.org.
Results of the focus group dialogues further support the results from other forms of primary data
collected (the community survey) and reinforces the findings from the secondary data scoring. By
synthesizing the discussions that took place at the focus groups in tandem with the responses from the
community survey, the primary data collection process for Bladen County is rich with involvement by a
representative cross section of the community.
Data Considerations
Several limitations of the data should be considered when reviewing the findings presented in this
report. Although the topics by which data are organized cover a wide range of health and health-related
areas, within each topic there is a varying scope and depth of data availability. In some topics there is a
robust set of secondary data indicators, but in others there may be a limited number of indicators for
which data is collected, or limited subpopulations covered by the indicators.
Data scores represent the relative community health need according to the secondary data that is
available for each topic and should not be considered to be a comprehensive result on their own. In
addition, these scores reflect what was found in the secondary data for the population as a whole, and
do not factor in the health or socioeconomic need that is much greater for some subpopulations. In
addition, many of the secondary data indicators included in the findings are collected by survey, and
though methods are used to best represent the population at large, these measures are subject to
instability—especially among smaller populations.
The disparities analysis, used to analyze the secondary data, is also limited by data availability. In some
instances, data sources do not provide subpopulation data for some indicators, and for other indicators,
values are only available for a select number of race/ethnic groups. Due to these limitations, it is not
possible to draw conclusions about subpopulation disparities for all indicators.
The breadth of primary data findings is dependent on several factors. Focus group discussion findings
were limited by which community members were invited to and able to attend focus group discussions,
as well as language barriers during discussion for individuals whose native language is not English.
Because the survey was a convenience sample survey, results are vulnerable to selection bias, making
findings less generalizable for the population as whole.

24
Prioritization
The methodology used when setting the priorities was first the Prioritization Matrix and then the
Dot Method/Dotmocracy, to further narrow down the priorities determined from the first meeting.
There were two sessions/meetings held to determine the priorities for the CHNA.
The meetings are detailed on the next page.
Meeting 1 took place on January 18
th
, 2019 at 3 pm at the Bladen County Health Department.
9 Individuals were in attendance.
Agencies Represented:
Bladen County Commissioner
Bladen County Manager
CFV Bladen County Hospital
Innovative Approaches
Bladen Community College
Department of Social Services
Bladen County Library
Bladen County Health Department
Prioritization methods used for the first meeting were the prioritization matrix, where we narrowed
down from our 8 identified health needs.
Meeting 2 took place on January 28
th
, 2019 at 9 am at the Bladen County Health Department.
9 individuals were in attendance.
Agencies Represented:
Innovative Approaches
Bladen County Library
CFV Bladen County Hospital
Department of Social Services
Bladen County Schools
Bladen County Health Department
The criteria used to determine the priorities were the 8 identified health needs documented within this
report. We examined each health need and the impact of addressing these needs in detail. This process
allowed us to narrow down our priorities for the second meeting down to the top three. You can find
the detailed prioritization process and notes within the Appendix E. section of this document.
25
Overview of Bladen County
A Coastal Plain county, and one of the largest in North Carolina, Bladen County is rightfully named the
“Mother County”. In 2016, the United State Census estimates 33,741 people populate Bladen County’s
887 square miles. Agriculture still thrives here with pork, poultry, blueberries, cotton and peanut
industries to be among the most profitable.
Bladen has nine elected County Commissioner Officials. Elizabethtown, Bladenboro, Clarkton, Dublin,
East Arcadia, Tar Heel and White Lake are each governed by a mayor and Council Members or Town
Commissioners. Elizabethtown is the county seat of Bladen County.
Currently there is one centrally located park that is located just outside of Elizabethtown. This park
includes baseball and soccer fields, a playground, picnic tables, tennis courts, and a walking trail. The
towns of Clarkton, Elizabethtown and Bladenboro offer parks with baseball fields and a walking trail for
public use.
Bladen has many lakes and natural forests from which the county is known. White Lake Resort,
Jones Lake State Park, Singletary Lake State Park, and Bladen Lakes State Forest, that provide walking
trails, camping, hiking, canoeing and swimming to increase physical activity opportunities for visitors and
county residents. The town of Elizabethtown recently constructed paved biking/walking pathways as
well as the added trails and playground at Tory Hole Park, and a new Bryant’s Creek bike/hiking trail.
There is also a skate park ramp that has been added. Our county has two large high schools, East Bladen
and West Bladen which provides a resource of walking tracks around the football fields, and tennis
courts.
Although we have many great features that surround us and lots of land space, our county lacks
community walking trails and parks in each community. Elizabethtown, although a central spot for work,
dining, and shopping, is far-removed from the outlying communities where most people live. Residents
in these communities could be as far away as 30 miles from one of these locations, not close enough in
proximity for daily use for physical activity. There is much need, as evidenced by the opinion of the
survey participant’s responses and focus group’s feedback, that our county needs more physical activity
opportunities for all citizens, especially our youth.
Within Bladen County, we have seen an increased growth in our Hispanic population. According
to the 2016 Census Report, Bladen County’s Hispanic rate is 7.7%. This is reflected in the clients served
in Bladen County Clinics, whether migrant workers and their families are moving through, or permanent
residents.
26
Demographic Profile
The demographics of a community significantly impact its health profile. Population growth has an
influence on the county’s current and future needs. Specific population subgroups, including veterans
and different age, gender, race and ethnic groups, may have unique needs and require varied
approaches to health improvement efforts. The following section explores the demographic profile of
Bladen County, North Carolina.
Population
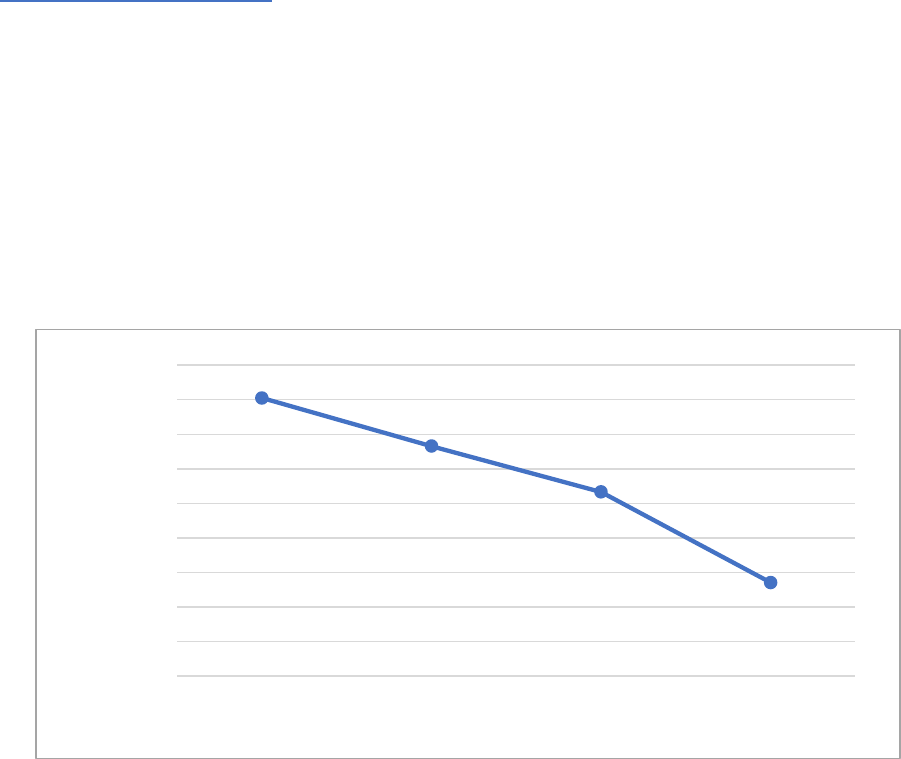
According to the U.S. Census Bureau’s 2016 population estimates, Bladen County has a population of
33,741 (Figure 6). The population of Bladen County has decreased from 2013 to 2016.
Figure 6. Total Population (U.S. Census Bureau)
34,810
34,531
34,266
33,741
33,200
33,400
33,600
33,800
34,000
34,200
34,400
34,600
34,800
35,000
2013 2014 2015 2016
Total Population Count
Year


28
Age and Gender
Overall, Bladen County residents are older than residents of North Carolina and the Health ENC region.
Figure 8 shows the Bladen County population by age group. The 45-54 age group contains the highest
percent of the population at 13%, while the 65-74 age group contains the next highest percent of the
population at 12.1%.
Figure 8. Population by Age (U.S. Census Bureau, 2016)
5.2%
5.8%
6.1% 6.1%
5.5%
10.4%
12.0%
13.0%
7.7%
7.9%
12.1%
5.9%
2.1%
0%
2%
4%
6%
8%
10%
12%
14%
16%
<5 5-9 10-14 15-19 20-24 25-34 35-44 45-54 55-59 60-64 65-74 75-84 85+
Percent of Population
Age Group
Bladen County North Carolina Health ENC Counties

29
People 65 years and older comprise 20.1% of the Bladen County population, compared to 15.5% in
North Carolina and 15.2% in the Health ENC counties (Figure 9).
Figure 9. Population 18+ and 65+ (U.S. Census Bureau, 2016)
Males comprise 47.7% of the population, whereas females comprise 52.3% of the population (Table 5).
The median age for males is 42.4 years, whereas the median age for females is 45.5 years. Both are
higher than the North Carolina median age (37.2 years for males and 40.1 years for females).
Table 5. Population by Gender and Age (U.S. Census Bureau, 2016)
Percent of Total
Population
Percent of
Male Population
Percent of
Female Population
Median Age
(Years)
Male
Female
18+
65+
18+
65+
Male
Female
Bladen County
47.7%
52.3%
77.3%
18.3%
80.0%
21.8%
42.4
45.5
North Carolina
48.6%
51.4%
76.3%
13.9%
78.4%
17.0%
37.2
40.1
Health ENC Counties
49.2%
50.8%
75.8%
13.5%
77.5%
16.9%
N/A
N/A
78.7%
20.1%
77.3%
15.5%
76.7%
15.2%
0%
10%
20%
30%
40%
50%
60%
70%
80%
90%
18+ 65+
Percent of Population
Age Group
Bladen County North Carolina Health ENC Counties

30
Birth Rate
Birth rates are important measures of population health. The birth rate is usually the dominant factor in
determining the rate of population growth; however, population growth is also driven by the age
structure of the population (e.g., deaths), immigration and emigration. Figure 10 illustrates that the
birth rate in Bladen County (9.7 live births per 1,000 population in 2016) is lower than the birth rate in
North Carolina (12.0) and Health ENC counties (13.1). Further, birth rates have decreased slightly over
the past three measurement periods in all three jurisdictions.
Figure 10. Birth Rate (North Carolina State Center for Health Statistics)
Race/Ethnicity
The race and ethnicity composition of a population is important in planning for future community needs,
particularly for schools, businesses, community centers, health care and child care. Race and ethnicity
data are also useful for identifying and understanding disparities in housing, employment, income and
poverty.
Figure 11 shows the racial and ethnic distribution of Bladen County compared to North Carolina and
Health ENC counties. The first six categories (White, Black or African American, American Indian or
Alaska Native, Asian, Native Hawaiian & Other Pacific Islander and Multiracial) are racial groups and may
include persons that identify as Hispanic or Latino. The seventh category (Hispanic or Latino) is an ethnic
group and may include individuals that identify as any race.
The White population accounts for 60.8% of the total population in Bladen County, with the Black or
African American population accounting for 34.2% of the total population. The proportion of residents
that identify as White is smaller in Bladen County (60.8%) as compared to North Carolina (71.0%) and
Health ENC counties (63.8%). Bladen County has a larger share of residents that identify as Black or
African American (34.3%) when compared to North Carolina (22.2%) and Health ENC counties (30.7%).
The Hispanic or Latino population comprises 7.7% of Bladen County.
10.4
10.5
10.2
9.7
12.1
12.2
12.0
12.0
13.6
13.6
13.4
13.1
0.0
2.0
4.0
6.0
8.0
10.0
12.0
14.0
16.0
2013 2014 2015 2016
Live Birth Rate per 1,000 Population
Year
Bladen County North Carolina Health ENC Counties

31
Figure 11. Population by Race/Ethnicity (U.S. Census Bureau, 2016)
60.8%
34.2%
3.0%
0.3%
0.0%
1.6%
7.7%
0%
10%
20%
30%
40%
50%
60%
70%
80%
White Black or
African
American
American
Indian or
Alaska Native
Asian Native
Hawaiian &
Other Pacific
Islander
Multiracial
(Two or More
Races)
Hispanic or
Latino
Percent of Population
Race/Ethnicity
Bladen County North Carolina Health ENC Counties

32
Tribal Distribution of Population
The U.S. Census Bureau collects population estimates for various American Indian and Alaska Native
(AIAN) tribes. While population estimates of tribal data are not available at the county level, Table 6
shows the population estimates of eight tribal areas throughout the state of North Carolina.
Table 6. Named Tribes in North Carolina (American Community Survey, 2012-2016)
State Designated Tribal Statistical Area
(SDTSA)
Total Population
Coharie SDTSA
62,160
Eastern Cherokee Reservation
9,613
Haliwa-Saponi SDTSA
8,700
Lumbee SDTSA
502,113
Meherrin SDTSA
7,782
Occaneechi-Saponi SDTSA
8,938
Sappony SDTSA
2,614
Waccamaw Siouan SDTSA
2,283
Military Population
Figure 12 shows the percent of the population 16 years of age and older in the military (armed forces).
Over the four most recent measurement periods, approximately 0% of Beaufort County residents aged
16 years and older were in the military. In comparison, 1.0% of North Carolina residents aged 16 years
and older and 4.0% of residents from Health ENC Counties were in the military in 2012-2016.
Figure 12. Population in Military / Armed Forces (American Community Survey)
0.0% 0.0% 0.0% 0.0%
1.2%
1.1%
1.1%
1.0%
4.4%
4.2%
4.0%
4.0%
0.0%
0.5%
1.0%
1.5%
2.0%
2.5%
3.0%
3.5%
4.0%
4.5%
5.0%
2009-2013 2010-2014 2011-2015 2012-2016
Percent of Population 16+
Years
Bladen County North Carolina Health ENC Counties

33
Veteran Population
The veteran population is given as a percent of the civilian population aged 18 years and older and this
data is used for policy analyses, to develop programs, and to create budgets for veteran programs and
facilities. Bladen County has a veteran population of 6.7% in 2012-2016, compared to 9.0% for North
Carolina and 12.4% for Health ENC counties (Figure 13).
Figure 13 also shows that the veteran population of Bladen County, North Carolina, and the Health ENC
region is decreasing slightly across four time periods from 2009-2013 to 2012-2016.
Figure 13. Veteran Population (American Community Survey, 2012-2016)
8.0%
7.8%
6.7%
6.7%
9.9%
9.6%
9.3%
9.0%
12.6%
12.4%
12.3%
12.4%
0%
2%
4%
6%
8%
10%
12%
14%
2009-2013 2010-2014 2011-2015 2012-2016
Percent of Civilian Population 18+
Years
Bladen County North Carolina Health ENC Counties

34
Socioeconomic Profile
Social and economic factors are well known to be strong determinants of health outcomes – those with
a low socioeconomic status are more likely to suffer from chronic conditions such as diabetes, obesity
and cancer. Community health improvement efforts must determine which subpopulations are most in
need in order to effectively focus services and interventions.
NC Department of Commerce Tier Designation
The North Carolina Department of Commerce annually ranks the state’s 100 counties based on
economic well-being and assigns each a Tier designation. The 40 most distressed counties are
designated as Tier 1, the next 40 as Tier 2 and the 20 least distressed as Tier 3.
Bladen County has been assigned a Tier 1 designation for 2018.
Income
Median household income reflects the relative affluence and prosperity of an area. Areas with higher
median household incomes are likely to have a greater share of educated residents and lower
unemployment rates. Figure 14 shows the median household income in Bladen County ($30,408), which
is lower than the median household income in North Carolina ($48,256).
Figure 14. Median Household Income (American Community Survey, 2012-2016)
$30,408
$48,256
$0
$10,000
$20,000
$30,000
$40,000
$50,000
$60,000
Bladen County North Carolina
USD


36
Within Bladen County, zip code 28332 has the lowest median household income ($26,386), followed by
zip code 28433 ($28,473), while zip code 28448 has the highest median household income ($43,073)
(Figure 16).
Figure 16. Median Household Income by Zip Code (American Community Survey, 2012-2016)
Poverty
Federal poverty thresholds are set every year by the Census Bureau and vary by size of family and ages
of family members. A high poverty rate is both a cause and a consequence of poor economic conditions.
Children in poverty are more likely to have physical health problems, behavioral problems and
emotional problems. Seniors who live in poverty are an especially vulnerable group due to increased
physical limitations, medical needs, and social isolation. Persons with a disability are more likely to live
in poverty compared to the rest of the population. Without adequate income, individuals with
disabilities may not be able to afford necessary expenses, such as rent or mortgage, utility bills, medical
and dental care, and food.

37
As seen in Figure 17, 28.1% percent of the population in Bladen County lives below the poverty level,
which is higher than the rate for North Carolina (16.8% of the population) and the Health ENC region
(19.2%).
Figure 17. People Living Below Poverty Level (American Community Survey, 2012-2016)
The rate of both children and older adults living below the poverty level is also noticeably higher for
Bladen County when compared to North Carolina and Health ENC counties (Figure 18 and Figure 19).
Figure 18. Children Living Below Poverty Level (American Community Survey, 2012-2016)
28.1%
16.8%
19.2%
0%
5%
10%
15%
20%
25%
30%
Bladen County North Carolina Health ENC Counties
Percent of Population
43.0%
23.9%
27.6%
0%
5%
10%
15%
20%
25%
30%
35%
40%
45%
50%
Bladen County North Carolina Health ENC Counties
Percent of Population <18

38
Figure 19. People 65+ Living Below Poverty Level (American Community Survey, 2012-2016)
As shown in Figure 20, the percent of disabled people living in poverty in Bladen County (45.5%) is also
higher than the rate for North Carolina (29.0%) and Health ENC counties (28.1%).
Figure 20. Persons with Disability Living in Poverty (American Community Survey, 2012-2016)
20.4%
9.7%
11.5%
0%
5%
10%
15%
20%
25%
Bladen County North Carolina Health ENC Counties
Percent of Population 65+
45.5%
29.0%
28.1%
0.0%
5.0%
10.0%
15.0%
20.0%
25.0%
30.0%
35.0%
40.0%
45.0%
50.0%
Bladen County North Carolina Health ENC Counties
Percent of Disabled Population 20-64

39
Housing
The average household size in Bladen County is 2.4 people per household, which is similar to the North
Carolina value of 2.5 people per household.
High costs of homeownership with a mortgage can strain both homeowners and the local housing
market. Figure 21 shows mortgaged owners median monthly household costs in the Health ENC region.
In Bladen County, the median housing costs for homeowners with a mortgage is $983. This is lower than
the North Carolina value of $1,243, and it is within the lowest quintile in the Health ENC region.
Figure 21. Mortgaged Owners Median Monthly Household Costs, Health ENC Counties
(American Community Survey 2012-2016)

40
Safe and affordable housing is an essential component of healthy communities, and the effects of
housing problems are widespread. Figure 22 shows the percent of households with at least one of the
following problems: overcrowding, high housing costs, lack of kitchen, or lack of plumbing facilities.
Approximately 20% of households in Bladen County have severe housing problems, compared to 16.6%
in North Carolina and 17.7% in Health ENC counties.
Figure 22. Severe Housing Problems (County Health Rankings, 2010-2014)
19.9%
16.6%
17.7%
0%
5%
10%
15%
20%
25%
Bladen County North Carolina Health ENC Counties
Percent of Households

41
Food Insecurity
The Supplemental Nutrition Assistance Program (SNAP) is a federal assistance program that provides
low-income families with electronic benefit transfers (EBTs) that can be used to purchase food. The goal
of the program is to increase food security and reduce hunger by increasing access to nutritious food.
Figure 23 shows the percent of households with children that participate in SNAP. The rate for Bladen
County, 45.2%, is lower than the state value of 52.6% and the Health ENC region value of 51.5%.
Figure 23. Households with Children Receiving SNAP (American Community Survey, 2012-2016)
45.2%
52.6%
51.5%
0%
10%
20%
30%
40%
50%
60%
Bladen County North Carolina Health ENC Counties
Percent of Households

42
The below table represents a three-month period of the child care subsidy program
and the funds that are spent per month.
Detailed are the number of children served and on the current waiting list.
Source: Data provided by the Child Care Subsidy Program
at Bladen County Department of Social Services- NC Fast 2018
October 2018
Total Funds Spent:
$93,586
Smart Start Funds Allocated
$3,248
Children Served
Children on
Waiting List
212
(5 were Special
Needs)
(5 were funded
through Smart Start
funds)
204
November 2018
Total Funds Spent:
$93,304
Children Served
Children on
Waiting List
194
(5 were
Special Needs)
214
Children Served
Children on
Waiting List
194
(4 were
Special Needs)
223
December 2018
Total Funds Spent:
$89,838
Bladen County DSS
Subsidy Program
October-November 2018
(3-Months at a Glance)

43
Employment
Bladen County is a very large and rural county. Many employment opportunities are available through
local industries within Bladen. Some of the employees are migrant workers that move in and work on a
seasonal basis.
Some of the industries within the county specialize in the production and processing of cotton,
blueberries, pork, poultry, peanuts and honey.
Others involve rifle, pallet, yarn, cement ornamental products, forestry and lumber processing and
production.
A detailed list of the industries, along with their specialization and number of employees can be found in
Appendix F of this document. Source: Bladen County Economic Development 2019

44
SocioNeeds Index
Conduent Healthy Communities Institute developed the SocioNeeds Index® to easily compare multiple
socioeconomic factors across geographies. This index incorporates estimates for six different social and
economic determinants of health – income, poverty, unemployment, occupation, educational
attainment, and linguistic barriers – that are associated with poor health outcomes including
preventable hospitalizations and premature death.
Zip codes within Bladen County are assigned an index value from 0 (low need) to 100 (high need), based
on how those zip codes compare to others in the U.S. Within Bladen County, the zip codes are then
ranked from 1 (low need) to 5 (high need) to identify the relative level of need. Zip codes with
populations under 300 persons are excluded. Zip code 28392, with an index value of 95.3 has the
highest level of socioeconomic need within Bladen County. This is illustrated in Figure 24. Index values
and the relative ranking of each zip code within Bladen County are provided in Table 7.
Figure 24. SocioNeeds Index® (Conduent Healthy Communities Institute, 2018)

45
Table 7. SocioNeeds Index® (Conduent Healthy Communities Institute, 2018)
Zip Code
Index Value
Relative Rank
28392
95.3
5
28337
95.1
5
28320
91.1
4
28433
88.5
3
28434
88.0
3
28399
85.7
2
28448
80.6
1
Source: http://www.healthenc.org/socioneeds
Understanding where there are communities with high socioeconomic need is critical to forming
prevention and outreach activities.
Educational Profile
Educational Attainment
Graduating from high school is an important personal achievement and is essential for an individual’s
social and economic advancement. Graduation rates can also be an important indicator of the
performance of an educational system. Having a bachelor’s degree opens up career opportunities in a
variety of fields and is often a prerequisite for higher-paying jobs.
Countywide, the percent of residents 25 or older with a high school degree or higher (78.4%) is lower
than the state value (86.3%) and the Health ENC region (84.7%) (Figure 25). Higher educational
attainment in Bladen County is also lower than the state value and the Health ENC region. Only 14.8% of
residents 25 and older have a bachelor’s degree or higher in Bladen County, as compared to 19.9% of
residents 25 and older have a bachelor’s degree or higher in the Health ENC counties (Figure 25).

46
Figure 25. People 25+ with a High School Degree or Higher and Bachelor’s Degree or Higher
(American Community Survey, 2012-2016)
Bladen County’s rate for those with a high school degree or higher is slightly below that of the state rate
and the Health ENC Counties. Only 14.8 % of our population has a bachelor’s degree or higher, which is
way below the rate of the state at 29.0%.
78.4%
14.8%
86.3%
29.0%
84.7%
19.9%
0%
10%
20%
30%
40%
50%
60%
70%
80%
90%
100%
With a High School Degree or Higher With a Bachelor's Degree or Higher
Percent of Population 25+
Bladen County North Carolina Health ENC Counties

47
In some areas of the county, including zip codes 28448, 28337 and 28433, the high school degree
attainment rate is below 80% (Figure 26).
Figure 26. People 25+ with a High School Degree or Higher by Zip Code
(American Community Survey, 2012-2016)
High School Dropouts
High school dropouts earn less income than high school and college graduates, and are more likely to be
unemployed. High school dropouts are generally less healthy and require more medical care. Further,
high school dropout rates are linked with heightened criminal activity and incarceration rates,
influencing a community’s economic, social, and civic health.
Bladen County’s high school dropout rate, given as a percent of high school students in Figure 27, is
2.9% in 2016-2017, which is higher than the rate in North Carolina (2.3%) and the Health ENC region
(2.4%). With the exception of the rate in 2015-2016, Bladen County’s high school dropout rate has been
higher than North Carolina’s and the Health ENC region’s rates since 2013.

48
Figure 27. High School Dropout Rate (North Carolina Department of Public Instruction)
High School Suspension Rate
High school suspension is a form of discipline in which a student is temporarily removed from a
classroom and/or school due to a violation of school conduct or code. Higher rates of suspension can be
related to high rates of antisocial or delinquent behaviors, which may further contribute to potential
future involvement in the juvenile justice system. Additionally, schools with higher suspension rates
have higher rates of law or board of education violations and generally spend more money per student.
Bladen County’s rate of high school suspension (15.8 suspensions per 100 students) is lower than North
Carolina’s rate (18.2) and the rate of Health ENC counties (25.5) in 2016-2017. As shown in Figure 28,
the rates for North Carolina and the Health ENC region are fairly consistent across four time periods, but
Bladen County’s rate experienced an increase in 2014-2015.
4.6%
4.0%
1.5%
2.9%
2.3%
2.4%
2.3%
2.3%
2.3%
2.6%
2.4%
2.4%
0.0%
0.5%
1.0%
1.5%
2.0%
2.5%
3.0%
3.5%
4.0%
4.5%
5.0%
2013-2014 2014-2015 2015-2016 2016-2017
Percent of High School Students
Years
Bladen County North Carolina Health ENC Counties

49
Figure 28. High School Suspension Rate (North Carolina Department of Public Instruction)
Bladen County’s Educational System
(primary and secondary schools, public, private, charter, community colleges,
colleges, universities, trade schools)
From the above data, over time our high school drop-out rates have decreased and are lower
than that of the state rate. With many educational opportunities within the county, our
students now have options for educational growth.
Bladen County is fortunate to have many educational facilities that provide our citizens with the
educational opportunities needed to be successful.
Please see a detailed list of the schools that are available to the county, which include public,
private and charter distinctions) within Appendix G of this document .
15.3
26.3
21.4
15.8
19.5
19.5
19.6
18.2
26.5
27.2
28.8
25.5
0
5
10
15
20
25
30
35
2013-2014 2014-2015 2015-2016 2016-2017
Rate per 100 Students in Grades 9-13
Years
Bladen County North Carolina Health ENC Counties
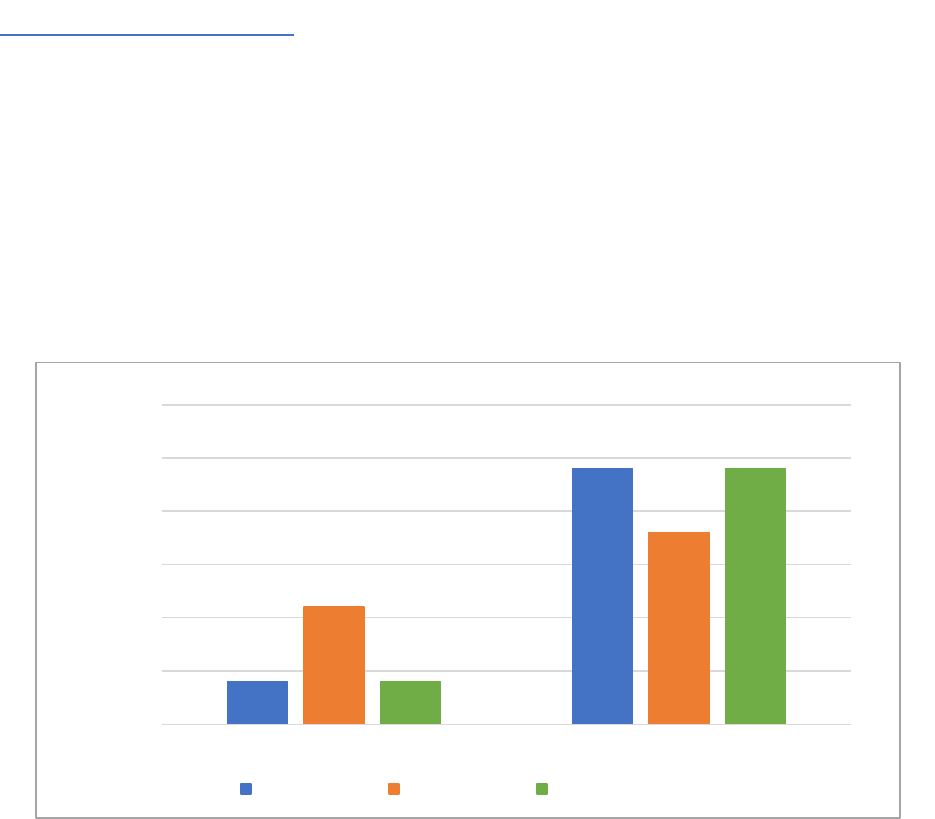
50
Transportation Profile
Public transportation offers mobility, particularly to people without cars. Transit can help bridge the
spatial divide between people and jobs, services, and training opportunities. Public transportation also
reduces fuel consumption, minimizes air pollution, and relieves traffic congestion. Walking to work helps
protect the environment, while also providing the benefit of daily exercise.
Countywide, 2.4% of residents walk to work, compared to the state value of 1.8%. Public transportation
is rare in Bladen County, with 0.4% of residents commuting by public transportation, compared to the
state value of 1.1% (Figure 29). In Bladen County, 82.2% of workers 16 and older drive alone to work,
compared to 81.1% in North Carolina (Figure 30).
Figure 29. Mode of Commuting to Work (American Community Survey, 2012-2016)
0.4%
2.4%
1.1%
1.8%
0.4%
2.4%
0.0%
0.5%
1.0%
1.5%
2.0%
2.5%
3.0%
Workers Commuting by Public Transportation Workers who Walk to Work
Percent of Working Population 16+
Bladen County North Carolina Health ENC Counties

51
Figure 30. Workers who Drive Alone to Work (American Community Survey, 2012-2016)
Bladen County’s Transportation Systems
(Highways, state-maintained roads, airways, and public transportation)
Bladen County has two major highways that intersect in the major city of
Elizabethtown, NC- 87 and US-701. Further, there are four additional large traveled
routes within the county, NC-242, NC-410, NC-41, and NC-211. In addition to the
major highways and state/US routes the county has 332 paved roadways to travel.
There is one public airport “Curtis L. Brown, Jr. Field”
owned by the major city of Elizabethtown that
consists of a lighted 5, 006 feet runway and parallel
taxiway with single point aviation gas and jet fuel for pilots. There is one
public transportation system available, B.A.R.T.S (Bladen Area Rural
Transportation System) to cover its 887 square miles. The route is
scheduled to go through Baltimore, Bladenboro, Clarkton, Smith Pond, Tar Heel, White Lake, White Oak,
and Elizabethtown.
https://www.ncdot.gov/doh/
82.2%
81.1%
81.4%
0%
10%
20%
30%
40%
50%
60%
70%
80%
90%
Bladen County North Carolina Health ENC Counties
Percent of Working Population 16+

52
Crime and Safety
Violent Crime and Property Crime
Both violent crime and property crime are used as indicators of a community’s crime and safety.
Violence negatively impacts communities by reducing productivity, decreasing property values and
disrupting social services. Violent crime includes four offenses: murder and non-negligent manslaughter,
rape, robbery, and aggravated assault. Property crime includes the offenses of burglary, larceny-theft,
motor vehicle theft, and arson.
In 2015, the violent crime rate in Bladen County was 411.8 per 100,000 population, compared to 356.3
per 100,000 people in North Carolina (Figure 31). The property crime rate in Bladen County (2315.3 per
100,000 people) is lower than the state value (2,779.7 per 100,000 people) (Figure 32). As shown in
Figure 26 and Figure 32, the violent crime rate in Bladen County is increasing, whereas the property
crime rate appears to be exhibiting a decrease. Data from 2016 was missing at the time of this analysis.
Figure 31. Violent Crime Rate (North Carolina Department of Justice)
293.1
232.9
411.8
340.4
333
356.3
374.9
0
50
100
150
200
250
300
350
400
450
2013 2014 2015 2016
Violent Crimes Per 100,000 Population
Year
Bladen County North Carolina

53
Figure 32. Property Crime Rate (North Carolina Department of Justice)
3559.4
3155.4
2315.3
3166.6
2954.1
2817.2
2779.7
0
500
1000
1500
2000
2500
3000
3500
4000
2013 2014 2015 2016
Property Crimes Per 100,000 Population
Year
Bladen County North Carolina

54
Juvenile Crime
Youth who commit a crime may not gain the educational credentials necessary to secure employment
and succeed later in life. Negative peer influences, history of abuse/neglect, mental health issues, and
significant family problems increase the risk of juvenile arrest. The juvenile justice system aims to reduce
juvenile delinquency through prevention, intervention, and treatment services.
Figure 33 shows the juvenile undisciplined rate per 1,000 youth ages 6-17 years old. The undisciplined
rate describes juveniles who are unlawfully absent from school, regularly disobedient and beyond
disciplinary control of the parent/guardian, are regularly found where it is unlawful for juveniles to be,
or have run away from home for more than 24 hours. The 2017 juvenile undisciplined rate in Bladen
County (0.4) is lower than the rate in North Carolina (1.5) and the Health ENC region (1.1).
Figure 33. Juvenile Undisciplined Rate (North Carolina Department of Public Safety)
0.5
0.6
0.4
0.4
1.5
1.5
1.5
1.5
1.2
1.3
1.2
1.1
0.0
0.2
0.4
0.6
0.8
1.0
1.2
1.4
1.6
1.8
2014 2015 2016 2017
Undisciplined Rate per 1,000
Population for Youth Aged 6-17
Year
Bladen County North Carolina Health ENC Counties

55
Figure 34 shows the juvenile delinquent rate, or juvenile crime rate, per 1,000 youth ages 6-15 years old.
While the juvenile crime rate in Bladen County decreased from 2014 to 2016, the rate slightly increased
from 6.4 in 2016 to 6.5 in 2017. The 2017 juvenile delinquent rate for Bladen County (6.5) is lower than
North Carolina (19.6) and the Health ENC region (22.8).
Figure 34. Juvenile Delinquent Rate (North Carolina Department of Public Safety)
11.9
8.1
6.4
6.5
22.5
20.8
19.2
19.6
23.6
21.7
21.9
22.8
0.0
5.0
10.0
15.0
20.0
25.0
2014 2015 2016 2017
Delinquent Rate per 1,000 Population
for Youths Aged 6-15
Year
Bladen County North Carolina Health ENC Counties

56
Child Abuse
Child abuse includes physical, sexual and emotional abuse. All types of child abuse and neglect can have
long lasting effects throughout life, damaging a child’s sense of self, ability to have healthy relationships,
and ability to function at home, at work, and at school. Figure 35 shows the child abuse rate per 1,000
population aged 0-18. The 2017 child abuse rate in Bladen County (0.00 per 1,000 population) is lower
than the rate in North Carolina (0.22) and the Health ENC region (0.28). The child abuse rate in Bladen
County has been 0.00 since 2016.
Figure 35. Child Abuse Rate
(Management Assistance for Child Welfare, Work First, and Food & Nutrition Services in North
Carolina & University of North Carolina at Chapel Hill Jordan Institute for Families)
0.13
0.14
0.00 0.00
0.23
0.21
0.21
0.22
0.28
0.24
0.25
0.28
0.00
0.05
0.10
0.15
0.20
0.25
0.30
2014 2015 2016 2017
Child Abuse Rate per 1,000 Population Aged
0-18
Year
Bladen County North Carolina Health ENC Counties

57
Incarceration
According to the U.S. Bureau of Justice Statistics, approximately one out of 100 adults in the U.S. are in
jail or prison. Conditions in jails and prisons can lead to an increased risk of infectious diseases such as
tuberculosis and hepatitis C, as well as assault from other inmates. After incarceration, individuals are
likely to face a variety of social issues such as employment discrimination, disruption of family
relationships and recidivism.
Figure 36 shows the incarceration rate per 1,000 population. The incarceration rate in Bladen County
has fluctuated over the past four measurement periods. The 2017 incarceration rate in Bladen County
(249.6 per 1,000 population) is lower than North Carolina (276.7), but higher than the Health ENC region
(232.6).
Figure 36. Incarceration Rate (North Carolina Department of Public Safety)
328.6
387.6
236.8
249.6
306.5
283.0
281.3
276.7
249.2
228.0
232.7
232.6
0
50
100
150
200
250
300
350
400
450
2014 2015 2016 2017
Incarceration Rate per 1,000
Population
Year
Bladen County North Carolina Health ENC Counties
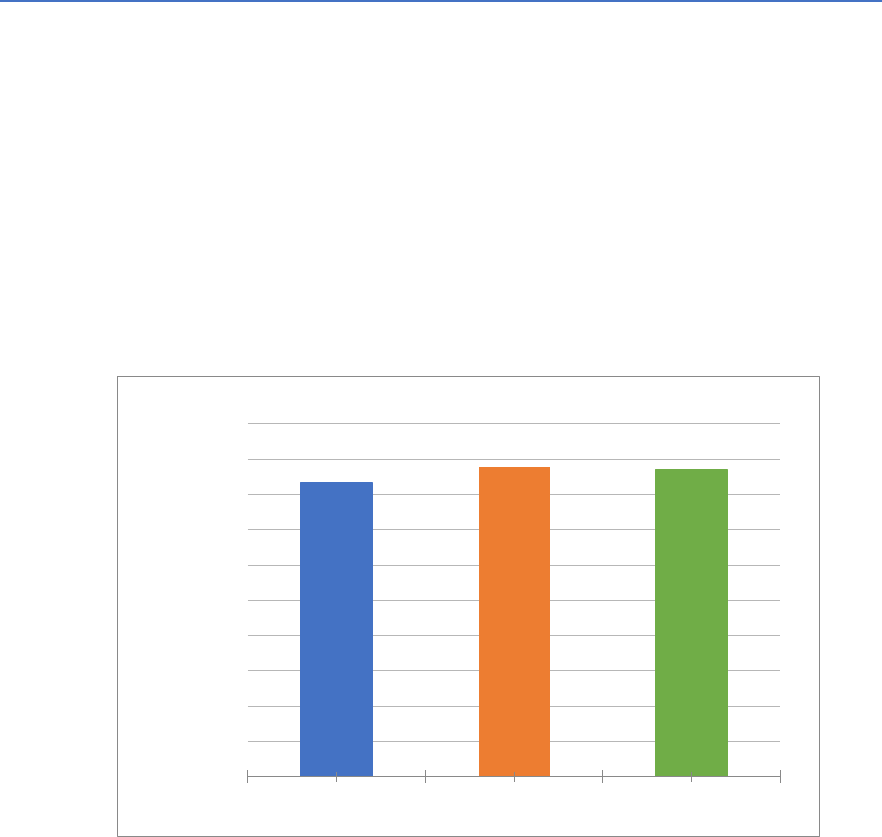
58
Access to Healthcare, Insurance and Health Resources Information
Health Insurance
Medical costs in the United States are very high. People without health insurance may not be able to
afford medical treatment or prescription drugs. They are also less likely to get routine checkups and
screenings, so if they do become ill they may not seek treatment until the condition is more advanced,
and therefore more difficult and costly to treat.
Figure 37 shows the percent of people aged 0-64 years old that have any type of health insurance
coverage. The rate for Bladen County, 83.4%, is slightly lower than the rate for North Carolina (87.8%)
and the Health ENC region (87.2%). Nearly 17% of the population in Bladen County is uninsured.
Figure 37. Persons with Health Insurance (Small Area Health Insurance Estimates, 2016)
83.4%
87.8%
87.2%
0%
10%
20%
30%
40%
50%
60%
70%
80%
90%
100%
Bladen County North Carolina Health ENC Counties
Percent of Population 0-64

59
Figure 38 shows the percent of the population only receiving health insurance through Medicaid,
Medicare, or military healthcare (TRICARE). Bladen County has a higher percent of people receiving
Medicaid (29.5%) than North Carolina (18.2%) and Health ENC counties (21.7%). The percent of people
receiving military health insurance is lower (0.4%) in Bladen County, as compared to North Carolina
(2.1%) and Health ENC counties (6.6%).
Figure 38. Persons Only Receiving Health Insurance through Medicaid, Medicare or Military
Healthcare (American Community Survey, 2012-2016)
Bladen County’s Health Insurance Snap-Shot
Bladen has a high rate of adults ages 18-64 that are not covered by health insurance.
20.2% of the adults in Bladen County have no health insurance.
Resource: http://nciom.org/map/
29.5%
7.0%
0.4%
18.2%
4.8%
2.1%
21.7%
4.5%
6.6%
0%
5%
10%
15%
20%
25%
30%
35%
Receiving Medicaid Only Receiving Medicare Only Receiving TRICARE/Military
Health Insurance Only
Percent of Noninstituationalized
Civilian Population
Bladen County North Carolina Health ENC Counties

60
Civic Activity
Political Activity
Exercising the right to vote allows a community to choose elected officials and hold them accountable.
Voting ensures that all citizens have the opportunity to voice their opinions on issues such as the use of
tax dollars, civil rights and foreign policy. By voting, individuals shape their communities and influence
the next generation of society. A high level of voter turnout indicates that citizens are involved and
interested in who represents them in the political system.
Figure 39 shows the voting age population, or percent of the population aged 18 years and older. Bladen
County has a higher percent of residents of voting age (78.7%) than North Carolina (77.3%) and Health
ENC counties (76.7%).
Figure 39. Voting Age Population (American Community Survey, 2012-2016)
78.7%
77.3%
76.7%
0%
10%
20%
30%
40%
50%
60%
70%
80%
90%
Bladen County North Carolina Health ENC Counties
Percent of Population

61
Figure 40 shows the percent of registered voters who voted in the last presidential election. The rate in
Bladen County was 67.7%, which is equal to the state value and slightly higher than Health ENC counties
(64.3%).
Figure 40. Voter Turnout in the Last Presidential Election
(North Carolina State Board of Elections, 2016)
67.7%
67.7%
64.3%
0%
10%
20%
30%
40%
50%
60%
70%
80%
Bladen County North Carolina Health ENC Counties
Percent of Registered Voters

62
Findings
Secondary Data Scoring Results
Table 8 shows the data scoring results for Bladen County by topic area. Topics with higher scores
indicate greater need. Heart Disease & Stroke is the poorest performing health topic for Bladen County,
followed by Diabetes, Prevention & Safety, Older Adults & Aging, Maternal, Fetal & Infant Health, and
Access to Health Services.
Table 8. Secondary Data Scoring Results by Topic Area
Health Topic
Score
Heart Disease & Stroke
2.19
Diabetes
2.17
Prevention & Safety
2.15
Older Adults & Aging
2.11
Maternal, Fetal & Infant Health
2.09
Access to Health Services
2.07
*See Appendix B for additional details on the indicators within each topic area
Primary Data
Community Survey
Figure 41 shows the list of community issues that were ranked by residents as most affecting the quality
of life in Bladen County. Low-income/poverty was the most frequently selected issue and was ranked by
44.7% of survey respondents, followed by drugs/substance abuse. Survey respondents ranked pollution
as the third issue most affecting quality of life in Bladen County (6.2%) followed closely behind by
discrimination/racism (5.9%). Less than 1% of survey respondents selected homelessness, violent crime,
hopelessness, child abuse, rape/sexual assault, neglect and abuse, elder abuse and domestic violence as
issues most affecting the quality of life in Bladen County.

63
Figure 41. Top Quality of Life Issues, as Ranked by Survey Respondents
Figure 42 displays the level of agreement among Bladen County residents in response to nine
statements about their community. More than half of survey respondents agreed or strongly agreed
that the county has good parks and recreation facilities, is a safe place to live, is a good place to grow old
and is a good place to raise children. 41% of survey respondents strongly disagree or disagree that it is
easy to buy healthy foods in the county and that there is plenty of help for people during times of need.
Further, 64% of survey respondents either disagreed or strongly disagreed that there is plenty of
economic opportunity in the county.
44.7%
25.7%
6.2%
5.9%
3.9% 3.9%
2.3%
2.1%
1.8%
0.8% 0.8%
0.3% 0.3% 0.3%
0.0% 0.0% 0.0%
0%
5%
10%
15%
20%
25%
30%
35%
40%
45%
50%

64
Figure 42. Level of Agreement Among Bladen County Residents in Response to Nine Statements about
their Community
Figure 43 shows the list of services that were ranked by residents as needing the most improvement in
Bladen County. Higher paying employment was the most frequently selected issue, followed by
counseling /mental health /support groups, availability of employment and positive teen activities.
Figure 43. Services Needing the Most Improvement, as Ranked by Survey Respondents
11%
5%
7%
27%
6%
14%
10%
11%
16%
23%
15%
14%
37%
11%
27%
21%
16%
25%
29%
22%
21%
23%
31%
28%
30%
19%
23%
33%
47%
47%
10%
46%
25%
35%
43%
30%
4%
11%
12%
3%
7%
6%
5%
11%
6%
There is good healthcare in my County.
This County is a good place to raise children.
This County is a good place to grow old.
There is plenty of economic opportunity in this County.
This County is a safe place to live.
There is plenty of help for people during times of need…
There is affordable housing that meets my needs in…
There are good parks and recreation facilities in this…
It is easy to buy healthy foods in this County.
Strongly Disagree Disagree Neutral Agree Strongly Agree
23.9%
15.0%
11.9%
10.2%
4.8%
4.6%
4.6%
3.6%
3.0%
3.0%
2.5%
2.0%
2.0%
2.0%
1.8%
1.0%
1.0%
0.8%
0.8%
0.3%
0%
5%
10%
15%
20%
25%
30%

65
Figure 44 shows a list of health behaviors that were ranked by residents as topics that Bladen County
residents need more information about. Substance abuse prevention was the most frequently selected
issue, being ranked by 30.4% of survey respondents. This was followed by other, eating well/nutrition,
managing weight, going to the doctor for yearly checkups and screenings, and caring for family
members with special needs/disabilities.
Figure 44. Health Behaviors that Residents Need More Information About, As Ranked by Survey
Respondents
Focus Group Discussions
Table 9 shows the focus group results for Bladen County by topic area or code. Focus Group transcript
text were analyzed by the Conduent HCI team using a list of codes that closely mirror the health and
quality of life topics used in the data scoring and community survey processes. Text was grouped by
coded excerpts, or quotes, and quantified to identify areas of the highest need per the focus group
participants. All excerpts/quotes were also categorized as a strength or a barrier/need based on the
context in which the participant mentioned the topic. Topics with higher frequency and mentioned in
the context of needs/concerns or barriers/challenges suggests greater need in the community. Topics
with a frequency more than 20 are included in the overall list of significant health needs.
30.4%
10.1%
10.1%
5.9%
5.4%
4.9%
4.1%
3.6%
3.4%
3.4%
2.6%
2.3%
2.3%
1.8%
1.8%
1.8%
1.8%
1.3%
1.0%
0.5%
0.5%
0.3%
0.3%
0.0%
0.0%
0%
5%
10%
15%
20%
25%
30%
35%

66
Table 9. Focus Group Results by Topic Area
Topic Area (Code)
Frequency
Exercise, Nutrition & Weight
34
Economy
18
Built Environment
8
Substance Abuse
6
Children’s Health
5
Heart Disease & Stroke
5
Data Synthesis
All forms of data have strengths and limitations. In order to gain a comprehensive understanding of the
significant health needs for Bladen County, findings from the secondary data, community survey and
focus group discussions were compared and analyzed for areas of overlap. The top needs from each
data source were identified using the criteria displayed in Table 10.
Table 10. Criteria for Identifying the Top Needs from each Data Source
Data Source
Criteria for Top Need
Secondary Data
Topics receiving highest data score
Community Survey
Community issues ranked by survey respondents as most
affecting the quality of life*
Focus Group Discussions
Topics discussed most frequently by participants in context of
needs/concerns or barriers/challenges to achieving health
*Community Survey Q4: Please look at this list of community issues. In your opinion, which one issue most affects the quality of
life in this County?
The top needs from each data source were incorporated into a Venn Diagram. Community issues ranked
by survey respondents were categorized to align with the health and quality of life topic areas displayed
in Table 2.

67
Figure 45 Data Synthesis, displays the top needs from each data source in the Venn diagram.
Figure 45. Data Synthesis
Across the three data sources, there is overlap and strong evidence of need attention the quality of life
topic Economy. As seen in Figure 45, the survey results and focus group discussion analysis cultivated
additional topics not ranked as top priorities in the secondary data scoring findings. A mixed-methods
approach is a strength when assessing a community as a whole. This process ensures robust findings
through statistical analysis of health indicators and examination of constituent’s perceptions of
community health issues.
Topic Areas Examined in This Report
Eight topic areas were identified as high scoring across the three data sources. These topics are listed
below.
Table 11. Topic Areas Examined In-Depth in this Report
Access to Health Services*
Diabetes*
Economy
Exercise, Nutrition & Weight
Heart Disease & Stroke*
Maternal, Fetal & Infant Health*

68
Prevention & Safety*
Substance Abuse
The five topic areas with the highest secondary data scores (starred*) are explored in-depth in the next
section and include corresponding data from community participants when available. Following the five
topic areas is a section called ‘Other Significant Health Needs’ which includes discussion of the
additional topics that were identified specifically in the community survey and focus group discussions.
The additional topics in ‘Other Significant Health Needs’ includes Access to Health Services, Exercise,
Nutrition & Weight, Economy and Substance Abuse.
Navigation Within Each Topic
Findings are organized by topic area. Within each topic, key issues are summarized followed by a review
of secondary and primary data findings. Special emphasis is placed on populations that are highly
impacted, such as older adults, race/ethnic groups or low-income populations. Figures, tables and
extracts from quantitative and qualitative data substantiate findings. Each topic includes a table with
key indicators from the secondary data scoring results. The value for Bladen County is displayed
alongside relevant comparisons, gauges and icons which are color-coded with green indicating good, red
indicating bad and blue indicating neutral. Table 12 describes the gauges and icons used to evaluate the
secondary data.
Table 12. Description of Gauges and Icons used in Secondary Dara Scoring
Gauge or Icon
Description
Green represents the "best" 50th percentile.
Yellow represents the 50th to 25th quartile
Red represents the "worst" quartile.
There has been a non-significant increase/decrease over time.
There has been a significant increase/decrease over time.
There has been neither a statistically significant increase nor decrease
over time.

69
Heart Disease & Stroke
Key Issues
Stroke, heart disease and ischemic heart disease are top health issues amongst the Medicare
population
Atrial fibrillation within the Medicare population is significantly increasing over time
The age-adjusted death rate due to heart disease is higher in the Bladen County than in North
Carolina and does not meet the goal for Healthy North Carolina 2020
Secondary Data
The secondary data scoring results reveal Prevention and Safety as the top need in Bladen County with a
score of 2.19. Additional analysis is performed to find specific indicators that contribute to this area of
concern, and these indicators are identified with high indicator data scores, shown in Table 13.
Table 13. Data Scoring Results for Heart Disease & Stroke
Score
Indicator (Year)
(Units)
Bladen
County
North
Carolina
U.S.
North
Carolina
Counties
U.S.
Counties
Trend
Healthy
NC 2020
HP
2020
2.5
Stroke: Medicare
Population
(2015)
(percent)
5.1
3.9
4
-
-
2.3
Hypertension:
Medicare
Population
(2015)
(percent)
68.4
58
55
-
-
2.1
Age-Adjusted
Death Rate due to
Heart Disease
(2012-2016)
(deaths/ 100,000
population)
243.4
161.3
-
161.5
-
2.3
Hyperlipidemia:
Medicare
Population
(2015)
(percent)
55.6
46.3
44.6
-
-
2.1
Atrial Fibrillation:
Medicare
Population
(2015)
(percent)
8.1
7.7
8.1
-
-

70
2.5
Ischemic Heart
Disease: Medicare
Population
(2015)
(percent)
33
24
26.5
-
-
2.5
Heart Failure:
Medicare
Population
(2015)
(percent)
18.7
12.5
13.5
-
-
*See Appendix B for full list of indicators included in each topic area
Primary Data
42% of survey participant reported being told by a health care professional that they had high blood
pressure and 30% had been told they have high cholesterol. When asked about challenges to accessing
health services for themselves or a family member, 18% community survey respondents indicated that
they had an issue in the past 12 months accessing health care services or provider. For those
respondents who had experienced challenges accessing health care services or providers in the past 12
months, 23% indicated that they had trouble accessing a specialist. Indirectly related, community survey
respondents rated eating well/nutrition, going to the doctor for yearly checkups and screenings and
managing weight as topics the community needs more information about which may impact the
population living with conditions related to heart disease and stroke.
Heart Disease and Stroke came up in all focus groups and was mentioned specifically by five participants
as a primary concern. Heart disease, heart attacks, high blood pressure, hypertension were the
conditions participants felt were health issues experienced by community members.
Highly Impacted Populations
Data scoring analysis identified the Medicare population as highly impacted within the Heart Disease &
Stroke topic area. No specific groups were identified in the primary data sources.

71
Diabetes
Key Issues
Diabetes amongst the Medicare population is a top area of concern for Bladen County
Diabetes amongst adults over 20 years old is higher in Bladen County than in the state and U.S.
The age-adjusted death care due to diabetes shows signs of increasing over time
Secondary Data
Diabetes is a top area of need based on the secondary data analysis and received a score of 2.17. Table
14 highlights indicators of concern.
Table 14. Data Scoring Results for Diabetes
Score
Indicator (Year) (Units)
Bladen
County
North
Carolina
U.S.
North
Carolina
Counties
U.S.
Counties
Trend
2.3
Adults 20+ with Diabetes
(2014)
(percent)
14.7
11.1
10
2.28
Age-Adjusted Death Rate due
to Diabetes
(2012-2016)
(deaths/ 100,000 population)
36.5
23
21.1
2.5
Diabetes: Medicare Population
(2015)
(percent)
37.5
28.4
26.5
*See Appendix B for full list of indicators included in each topic area
Primary Data
Community survey respondents rated eating well/nutrition, going to the doctor for yearly checkups and
screenings and managing weight as topics the community needs more information about which may
also impact the adult population living with Diabetes. 15% of community survey participants reported
being told by a medical professional that they have diabetes and 50% had been told that they were
overweight or obese. Diabetes was not discussed at length in the focus group sessions though it was
raised by three participants as a top issue they see as impacting the community.
Highly Impacted Populations
Data scoring analysis identified the Medicare population as a group highly impacted within the Diabetes
topic area. No specific groups were identified in the primary data sources.

72
Prevention & Safety
Key Issues
Severe housing problems reported within Bladen County are significantly increasing over time
The age-adjusted death rate due to firearms is higher in Bladen County than in North Carolina
and the U.S. overall
The death rate due to unintentional poisoning does not meet the Healthy North Carolina 2020
goal of 9.9 deaths per 100,000 population
Secondary Data
The Prevention & Safety topic received a data score of 2.15. Indicators in this category relate to harm,
housing and unintentional deaths in the community. The highest scoring indicators related to the
Prevention & Safety topic area are displayed in Table 15.
Table 15. Data Scoring Results for Prevention & Safety
Score
Indicator (Year)
(Units)
Bladen
County
North
Carolina
U.S.
North
Carolina
Counties
U.S.
Counties
Trend
Healthy
NC 2020
HP
2020
2.55
Severe Housing
Problems
(2010-2014)
(percent)
19.9
16.6
18.8
-
-
2.55
Age-Adjusted Death
Rate due to Firearms
(2014-2016)
(deaths/ 100,000
population)
27.5
12.7
11
-
9.3
2.4
Age-Adjusted Death
Rate due to
Unintentional
Poisonings
(2013-2015)
(deaths/ 100,000
population)
20.9
12.9
13.4
9.9
-
2.1
Death Rate due to
Drug Poisoning
(2014-2016)
(deaths/ 100,000
population)
20.4
16.2
16.9
-
-
*See Appendix B for full list of indicators included in each topic area
Primary Data
According to survey results, Prevention & Safety did not rank high as one of the top quality of life topics
individuals in Bladen County felt effected their lives. Less than 3% selected safety related topics overall
73
as top issues in the community. 2.5% of participants selected more affordable or better housing as a
service needing the most improvement. 40% of participants shared that they strongly agreed or agreed
that Bladen County has affordable housing that meets their needs while, 53% strongly agreed or agreed
that Bladen County is a safe place to live. Since survey results are not necessarily representative of the
community as a whole, the respondents may not be experiencing housing and safety issues to the
extent certain segments of the population may be. Focus group discussion did not reveal any needs or
concerns related to safety more generally though this may have been related to the nature of the
conversations.
Highly Impacted Populations
Data scoring analysis did not identify, or there was not data available, to indicate any groups highly
impacted within the Prevention & Safety topic area. No specific groups were identified in the primary
data sources.

74
Maternal, Fetal & Infant Health
Key Issues
The percentage of babies born with low birth weight and very low birth weight are higher in
Bladen County than in North Carolina and the U.S.
12.9% of babies are born preterm in Bladen County which does not meet the Healthy People
2020 goal of 9.4%
Secondary Data
Maternal, Fetal & Infant Health received a topic score of 2.09. Indicators with high scores and of concern
are displayed in Table 16.
Table 16. Data Scoring Results for Maternal, Fetal & Infant Health
Score
Indicator
(Year) (Units)
Bladen
County
North
Carolina
U.S.
North
Carolina
Counties
U.S.
Counties
Trend
Healthy
NC 2020
HP
2020
2.23
Babies with
Very Low
Birth Weight
(2012-2016)
(percent)
2.2
1.7
1.4
-
1.4
2.43
Babies with
Low Birth
Weight
(2012-2016)
(percent)
10.2
9
8.1
-
7.8
2.33
Preterm
Births
(2016)
(percent)
12.9
10.4
9.8
-
9.4
*See Appendix B for full list of indicators included in each topic area
Primary Data
In the community survey, participants were asked to identify health behaviors people in the community
need more information about and “getting prenatal care during pregnancy” was selected by less than
1% of the survey respondents. This result may have been due to the demographics of survey
respondents and not necessarily reflect the ultimate need in the community. During the focus group
discussions, teen pregnancy and pre/post-natal care was not raised by two participants as issues in the
community. One participant the Young Families Connect program as an asset in the community that
supported mothers about making healthy choices and preparing healthier foods at home. The lack of
discussion in relation to Maternal, fetal and Infant Health may also indicate a lack of awareness in the
community about these issues.
75
Related to teen health and pregnancy, “positive teen activities” was the 4
th
highest ranking service
needing improvement in the community (10.2%) and preventing pregnancy/sexually transmitted
diseases was selected by 1.8% of survey respondents as a health behavior that people in the community
need more information about.
Highly Impacted Populations
Data scoring analysis did not identify, or there was not data available, to indicate any groups highly
impacted within the Maternal, Fetal & Infant Health topic area. No specific groups were identified in the
primary data sources.

76
Access to Health Services
Key Issues
The primary care and mental health provider rates are lower in Bladen County than in North
Carolina and the U.S. and may be decreasing over time
Preventable hospital stays are a concern for the Medicare population in Bladen County with a
value of 80.5 discharges per 1,000 Medicare enrollees
The percentage of the population with health insurance does not meet the Healthy North
Carolina 2020 goal of 92%
Secondary Data
From the secondary data scoring results, Access to Health Services was identified to be a top need in
Bladen County, with a score of 2.07. Specific indicators of concern are highlighted in Table 17.
Table 17. Data Scoring Results for Access to Health Services
Score
Indicator (Year)
(Units)
Bladen
County
North
Carolina
U.S.
North
Carolina
Counties
U.S.
Counties
Trend
Healthy
NC 2020
HP
2020
2.5
Primary Care
Provider Rate
(2015)
(providers/
100,000
population)
20.4
70.6
75.5
-
-
2.3
Preventable
Hospital Stays:
Medicare
Population
(2014)
(discharges/ 1,000
Medicare
enrollees)
80.5
49
49.9
-
-
2.15
Mental Health
Provider Rate
(2017)
(providers/
100,000
population)
59.3
215.5
214.3
-
-
2.13
Persons with
Health Insurance
(2016)
(percent)
83.4
87.8
-
92
100
*See Appendix B for full list of indicators included in each topic area

77
“The elderly population
suffers from barriers such as
finances and transportation
to get to doctors’
appointments. Some of
them have to choose
between paying for
medications or having
food.”
Primary Data
As previously summarized, the majority of community survey
respondents have health insurance through an employer (64.2%)
followed by Medicare (10.9%). Participants were asked where
they most often go to seek medical treatment, the majority
sought care at a doctor’s office (69%). Most participants did not
report any problems getting the health care they needed in the
past 12 months (80%). For those who reported have difficulties
accessing health care services, the most common reported
provider that they had trouble getting services from was a general
practitioner (42%) followed by a dentist (24%) or a specialist
(23%). The top reasons participants reported not being able to get
the necessary health care they needed were not being able to get
an appointment (38%), they did not have health insurance (32%)
and insurance didn’t cover what they needed (29%). 61% of
participants reported being able to see the medical provider they
needed within Bladen County other sought care in places including
Cumberland County (13%).
Focus Group participants discussed barriers to access health services specifically due to the geographic
limitations that come with living in rural community. One participant felt that the Hispanic/Latino
population do not seek medical care out of fear and lack of trust. A few participants felt that the elderly
population is not getting the medical treatment that they need because of financial and transportation
barriers. Other participants brought up child health care as limited only to mandatory vaccinations and
drops off after those occur.
Highly Impacted Populations
Focus Group Participants brought up the Hispanic/Latino population, the elderly and children as groups
they perceived are not able to access health services.
“Children ages 5-12 years old get neglected with health after they have
finished their vaccinations needed, there’s a drop off for check-ups and
health care.”

78
Mortality
Knowledge about the leading causes of death in a population is critical to understanding how to target
interventions to maximize population health. Table 18 shows the leading causes of mortality in Bladen
County, North Carolina, and Health ENC Counties in 2014-2016, where the rate is age-adjusted to the
2000 U.S. standard population and is given as an age-adjusted death rate per 100,000 population.
Table 18. Leading Causes of Mortality (2014-2016, CDC WONDER)
Bladen County
North Carolina
Health ENC Counties
Rank
Cause
Deaths
Rate*
Cause
Deaths
Rate*
Cause
Deaths
Rate*
1
Heart Diseases
363
255.7
Cancer
58,187
165.1
Cancer
12,593
177.5
2
Cancer
252
168
Heart Diseases
54,332
159
Heart Diseases
12,171
178.8
3
Accidental
Injuries
80
78.8
Chronic Lower
Respiratory
Diseases
15,555
45.1
Cerebrovascular
Diseases
3,247
48.5
4
Chronic Lower
Respiratory
Diseases
67
44.8
Accidental
Injuries
15,024
48.2
Accidental
Injuries
3,136
50.1
5
Diabetes
56
38.6
Cerebrovascular
Diseases
14,675
43.6
Chronic Lower
Respiratory
Diseases
3,098
44.9
6
Cerebrovascular
Diseases
52
36.9
Alzheimer’s
Disease
11,202
34.2
Diabetes
2,088
29.9
7
Kidney Diseases
32
23.2
Diabetes
8,244
23.6
Alzheimer's
Disease
1,751
27.3
8
Alzheimer's
Disease
30
22.1
Influenza and
Pneumonia
5,885
17.5
Influenza and
Pneumonia
1,148
17.2
9
Septicemia
29
20.6
Kidney Diseases
5,614
16.5
Kidney Diseases
1,140
16.8
10
Hypertension
19
Unreliable
Septicemia
4,500
13.1
Septicemia
1,033
15.1
*Age-adjusted death rate per 100,000 population

79
“There are a lot of families in
poverty in our county.”
Other Significant Health Needs
Economy
Secondary Data
From the secondary data scoring results, Economy was the 9
th
most pressing health need in Bladen
County with a score of 1.94. Top related indicators include: People 65+ Living Below Poverty Level (2.70),
People Living Below Poverty Level (2.65), Severe Housing Problems (2.55), Children Living Below Poverty
Level (2.50), Female Population 16+ in Civilian Labor Force (2.50), Population 16+ in Civilian Labor Force
(2.50) and Students Eligible for the Free Lunch Program.
Primary Data
Community survey participants were asked to rank the issues most
negatively impacting their community’s quality of life. According to
the data, both poverty and the economy were the top issues in
Bladen County that negatively impact quality of life. Community
survey participants were also asked to weigh-in on areas of
community services that needed the most improvement. Higher
paying employment received the highest share of responses
(23.9%), while availability employment was 3
rd
(11.9%). When
asked to expand on services that could be improved the need for
more economic activity in the community and jobs offering higher
salaries.
Focus group participants also touched on key economic stressors: challenges with being able to afford
healthy behaviors or activities and delays in seeking health care due to costs. One participant raised
concerns about the number of families in the county living poverty another participant felt that salaries
needed to be increased in the community.
Exercise, Nutrition & Weight
Secondary Data
From the secondary data scoring results, Exercise, Nutrition & Weight was the 14
th
most pressing health
need in Bladen County with a score of 1.78. Top related indicators include: Adults 20+ who are Obese
(2.65), Access to Exercise Opportunities (2.40), Child Food Insecurity Rate (2.30), Food Insecurity Rate
(2.30) and Adults 20+ who are Sedentary (2.25).
Primary Data
Among community survey respondents, 43% rated their health is good and 30% rated their health as
very good. However, 50% of respondents reported being told by a health professional that they were
overweight and/or obese. Data from the community survey participants show that 42.2% of community
members do not engage in any physical activity or exercise during the week that lasts at least 30
minutes. Among individuals that do not exercise, respondents reported reasons including not having
enough time (33%) and being too tired (33%). For those individuals that do exercise, 74% reported
exercising or engaging in physical activity at home while 19% do so at a public park or work
site/employer (19%).

80
“It would be great if we could
have a more organized
recreation center or YMCA that
children could use. They need
more to do.”
Exercise, nutrition & Weight was discussed in all focus groups.
Participants shared that they struggled with not being able to afford
to eat healthy or knowing what to select as healthy food choices
when eating away from home. Specific issues included difficulty
finding healthy food option due to limited choices healthy
restaurants, limited access to purchase healthy foods and family
traditions around cooking. Several participants raised that more
activities that engage children in physical activity were needed in
the community either through recreation sports or center such as a
YMCA. Overall people felt that nutritional education is needed in
the community and too many people rely on fast food restaurants
for their meals. To emphasize this point, when community
members were asked about specific topic areas they were
interested in learning more about in the community survey, managing weight, nutrition, and
exercising/fitness were high frequency responses. Participants also suggested taking advantage of
community assets such as walking trails and initiating no-cost fitness groups.
Substance Abuse
Secondary Data
From the secondary data scoring results, Substance Abuse was the 22
nd
most pressing health need in
Bladen County and received a score of 1.48. Top related indicators include: Adults who Smoke (2.70) and
Death Rate due to Drug Poisoning (2.10).
Primary Data
Community survey participants ranked substance abuse (25.7%) as a top issue affecting quality of life in
Gates County. Additionally, 30.4% of community survey respondents reported wanting to learn more
about substance abuse prevention.
16% of survey participants reported currently use tobacco products. Of those who reported tobacco
product use, 34% would go to a doctor if they wanted to quit and 26% stated that they did not want to
quit. 48% of survey participants reported having been exposed to secondhand smoke in the last year. Of
those who indicated that they had been exposed to secondhand smoke, 32% were exposed in the home
and 33% selected ‘other’, mostly adding that they had been exposed in other people’s homes and
outside. Most participants (79%) reported that in the past 30 days, there were zero times where they
drank more than 4/5 drinks on a single occasion and 8% had one time. Reported illicit drug use amongst
survey participants in the past 30-days was low, 98% reported no illegal drug use and 99% reported no
use of prescription drugs they did not have a prescription for. Of those who reported any illegal drug use
“Farmer’s Markets could have more and be used more. Our
farmer’s market really only has some vegetables and a croissant
place in it. Farmer’s rather sell from their homes or on the
roadside.”

81
(<2%) in the past 30 days, 80% reported marijuana use. Focus group discussion did not focus heavily on
substance abuse, however, five participants specifically raised prescription drugs, tobacco products and
secondhand smoke as issues they see as problems that needs to be addressed in the community.

82
A Closer Look at Highly Impacted Populations
Several subpopulations emerged from the primary and secondary data for their disparities in access to
care, risk factors, and health outcomes. This section focuses on these subpopulations and their unique
needs.
Older Adults & Aging
Older Adults & Aging ranks as a top need in Bladen County as determined by the secondary data scoring
results; a number of indicators (21) are contributing to its topic score of 2.11. Death rates due to
prostate cancer are of particular concern. Chronic Kidney Disease amongst the Medicare population in
Bladen received a comparison score of 2.70 when compared to other counties, which is higher than the
state value and national value. In addition, 20.4% of adults over 65 years old are living below the poverty
level in Bladen County and Black or African American community members are disparately impacted.
The following indicators are of concern and received a high score of 2.50 and specifically impact the
Medicare population in the county, including: Asthma: Medicare Population, COPD: Medicare
Population, Diabetes: Medicare Population, Heart Failure: Medicare Population, Ischemic Heart Disease:
Medicare Population, Rheumatoid Arthritis or Osteoarthritis: Medicare Population and Stroke: Medicare
Population.
Disparities by Age, Gender and Race/Ethnicity
Secondary data are further assessed to determine health disparities for race/ethnic, age, or gender
groups. Table 19 identifies indicators in which a specific population subgroup differs significantly and
negatively from the overall population in Bladen County, with significance determined by non-
overlapping confidence intervals.
Table 19. Indicators with Significant Race/Ethnic, Age, or Gender Disparities
Health Indicator
Group(s) Disparately Affected*
People 65+ Living Below Poverty Level
Black or African American
People Living Below Poverty Level
12-17, 6-11, <6, Black or African American, Hispanic
or Latino, Other
Children Living Below Poverty Level
Black or African American, Hispanic or Latino, Other
Families Living Below Poverty Level
Black or African American, Hispanic or Latino
Per Capita Income
Black or African American, Hispanic or Latino, Other,
Two or More Races
Median Household Income
Black or African American
Young Children Living Below Poverty Level
Black or African American

83
People 25+ with a High School Degree or Higher
65+, Hispanic or Latino
Workers who Drive Alone to Work
60-64, Female, Asian
Lung and Bronchus Cancer Incidence Rate
Male
Workers who Walk to Work
45-54, Black or African American
*See HealthENC.org for indicator values for population subgroups
The list of indicators with significant disparities should be interpreted with caution. Indicators beyond
those displayed in Table 19 may also negatively impact a specific subgroup; however, not all data
sources provide subpopulation data, so it is not possible to draw conclusions about every indicator used
in the secondary data analysis.
Geographic Disparities
Geographic disparities are identified using the SocioNeeds Index®. Zip code 28392, with an index value
of 95.3, has the highest socioeconomic need within Bladen County, potentially indicating poorer health
outcomes for its residents. See the SocioNeeds Index® for more details, including a map of Bladen
County zip codes and index values.

84
Conclusion
The Community Health Needs Assessment utilized a comprehensive set of secondary data indicators
measuring the health and quality of life needs for Bladen County. The assessment was further informed
with input from Bladen County residents through a community survey and focus group discussions that
included participants from broad interests of the community. The data synthesis process identified 8
significant health needs: Access to Health Services, Diabetes, Economy, Exercise, Nutrition & Weight,
Heart Disease & Stroke, Maternal, Fetal & Infant Health, Prevention & Safety and Substance Abuse.
The prioritization process identified 3 focus areas: (1) Exercise, Nutrition and Weight (2) Substance
Abuse (3) New and Emerging Issue identified as Maternal, Fetal & Infant Health.
Following this process, Bladen County will outline how it plans to address these health needs in its
implementation plan.
We hope to incorporate any feedback on this report into the next CHNA process.
Please send your feedback and comments to:
William Haithcock
1638 Owen Dr.
Fayetteville, NC 28304
Phone: 910-615-7667
Email: whait@capefearvalley.com
Bladen County Health Department
Attn: Marianne Valentiner
P. O. Box 189
Elizabethtown, NC 28337
Phone: 910-872-6264
Email: mvalentine[email protected]

85
Appendix A. Impact Since Prior CHNA
Cape Fear Valley Health system details their priorities, significant health needs, planned activities to address these issues and the results in the
table below.
Significant
Health Need
Identified in
Preceding CHNA
Planned Activities to
Address Health Needs
Identified in Preceding
Implementation Strategy
Was Activity
Implemented
(Yes/No)
Results, Impact & Data Sources
Heart Disease
Clinics will distribute
educational information
to patients about risk
Yes
Over 130,000 clinic visits over the three year period in Bladen
County clinics. Providers are able to provide educational material
specific to heart disease. Providers discuss risks with patients and
go over the educational material. Patients are educated about
resources that are available in the Cape Fear Valley Health System.
Blood Pressure Screenings
at Events
Yes
Participated in over 36 events in Bladen County during the three
year window. Performed blood pressure screenings. Provided
educational information to individuals with high blood pressure.
Highlighted available resources both in the community as well as
from Cape Fear Valley Health System. Provided Hands Only CPR
education at the Bladenboro Beast Fest each year.
Cancer
Education and Screening
of Top 4 cancers at
Outreach Events
Yes
Participated in over 36 events in Bladen County during the three
year window. Highlighted available resources both in the
community as well as from Cape Fear Valley Health System. Cancer
Center staff participate and educate attendees about the four
main sites of cancer(Breast, Lung, Prostate, & Colorectal). For the
top 4 cancers, Bladen County mortality rates associated with
cancer are decreasing at/or superior to the statewide rate(2013-
2017 Key Health Indicator Trends).

86
Work with CFVHS
Foundation to raise funds
for Low Dose Lung CTs
No
Foundation did not have funds available to offer free Low Dose
Lung CTs. However, Bladen Hospital performed 84 Low Dose Lung
CTs in FY 2017 & FY 2018 combined. Patients were referred to
CFVHS Cancer Center when they need further evaluation.
Diabetes/Obesity
Clinics will distribute
educational information
to patients about risk
Yes
Over 130,000 clinic visits over the three year period in Bladen
County clinics. Providers are able to provide disease specific
material to patients. Providers discuss risks with patients and go
over the educational material. Patients are educated about
resources that are available in the Cape Fear Valley Health System.
Education and Screening
of Diabetes at Outreach
events
Yes
Participated in over 36 events in Bladen County during the three
year window. Highlighted available resources both in the
community as well as from Cape Fear Valley Health System.
Residents from CFVHS residency program perform blood pressure
& blood sugar tests at outreach events. Residents will educate
attendees about the risk of diabetes.


88
Appendix B. Secondary Data Scoring
Overview
Data scoring consists of three stages, which are summarized in Figure 46:
Comparison Score
For each indicator, Bladen County is assigned up to 7 comparison scores based on its comparison to
other communities, whether health targets have been met, and the trend of the indicator value over
time. Comparison scores range from 0-3, where 0 indicates the best outcome and 3 indicates the worst
outcome (Figure 47).
Indicator Score
Indicator scores are calculated as a weighted average of comparison scores. Indicator scores range from
0-3, where 0 indicates the best outcome and 3 indicates the worst outcome (Figure 47).
Topic Score
Indicators are then categorized into topic areas. Topic scores are calculated by averaging all relevant
indicator scores, with indicators equally weighted. Topic scores range from 0-3, where 0 indicates the
best outcome and 3 indicates the worst outcome (Figure 47). Indicators may be categorized into more
than one topic area.
Comparison
Score
•Quantitatively
score all
possible
comparisons
Indicator
Score
•Summarize
comparison
scores for
each indicator
Topic Score
•Summarize
indicator scores
by topic area
Figure 46. Secondary Data Scoring
Overview
Figure 47. Score Range

89
Comparison Scores
Up to 7 comparison scores were used to assess the status of
Bladen County. The possible comparisons are shown in Figure
48 and include a comparison of Bladen County to North
Carolina counties, all U.S. counties, the North Carolina state
value, the U.S. value, Healthy People 2020 targets, Healthy
North Carolina 2020 targets, and the trend over time.
Availability of each type of comparison varies by indicator and
is dependent upon the data source, comparability with data
collected for other communities, and changes in methodology
over time. The determination of comparison scores for each
type of comparison is discussed in more detail below.
Comparison to a Distribution of North Carolina Counties and U.S.
Counties
For ease of interpretation and analysis, indicator data on HealthENC.org is visually
represented as a green-yellow-red gauge showing how Bladen County is faring
against a distribution of counties in North Carolina or the U.S. (Figure 49).
A distribution is created by taking all county values within the state or nation,
ordering them from low to high, and dividing them into four equally sized groups based on their order
(Figure 50). The comparison score is determined by how Bladen County falls within these four groups or
quartiles.
Figure 50. Distribution of County Values
Comparison to North Carolina Value and U.S. Value
As shown in Figure 51, the diamond represents how Bladen County
compares to the North Carolina state value and the national value. When
comparing to a single value, the comparison score is determined by how
much better or worse the county value is relative to the comparison value.
Figure 49. Compare to
Distribution Indicator
Gauge
Figure 51. Comparison
to Single Value
Figure 48. Comparisons used in Secondary
Data Scoring

90
Comparison to Healthy People 2020 and Healthy North Carolina
2020 Targets
As shown in Figure 52, the circle represents how Bladen County compares to
a target value. Two target values are taken into consideration for this analysis:
Healthy People 2020 and Healthy North Carolina 2020. Healthy People 2020
2
goals are national objectives for improving the health of the nation set by the
Department of Health and Human Services’ (DHHS) Healthy People Initiative.
Healthy North Carolina 2020
3
objectives provide a common set of health indicators that the state can
work to improve. The North Carolina Institute of Medicine, in collaboration with the Governor’s Task
Force for Healthy Carolinians; the Division of Public Health, North Carolina Department of Health and
Human Services (NC DHHS); the Office of Healthy Carolinians and Health Education, NC DHHS; and the
State Center for Health Statistics, NC DHHS, helped lead the development of the Healthy NC 2020
objectives. When comparing to a target, the comparison score is determined by whether the target is
met or unmet, and the percent difference between the indicator value and the target value.
Trend Over Time
As shown in Figure 53, the square represents the measured trend. The Mann-Kendall statistical test for
trend is used to assess whether the value for Bladen County is increasing or decreasing over time and
whether the trend is statistically significant. The trend comparison uses the four most recent
comparable values for the county, and statistical significance is determined at the 90% confidence level.
For each indicator with values available for four time periods, a comparison score is determined by the
trend’s direction and its statistical significance.
Figure 53. Trend Over Time
Missing Values
Indicator scores are calculated using the comparison scores, availability of which depends on the data
source. If an indicator does not have data for a specific comparison type that is included for indicator
score calculations, the missing comparison is substituted with a neutral score. When information is
unknown due to lack of comparable data, the neutral value assumes that the missing comparison score
is neither good nor bad and does not impact the indicator’s weighted average.
Indicator Scoring
Indicator scores are calculated as a weighted average of all included comparison scores. If none of the
included comparison types are possible for an indicator, no score is calculated, and the indicator is
excluded from the data scoring results.
2
For more information on Healthy People 2020, see https://www.healthypeople.gov/
3
For more Information on Healthy North Carolina 2020, see: https://publichealth.nc.gov/hnc2020/
Figure 52. Comparison
to Target Value

91
Topic Scoring
Indicator scores are averaged by topic area to calculate topic scores. Each indicator may be included in
up to three topic areas if appropriate. Resulting scores range from 0-3, where a higher score indicates a
greater level of need as evidenced by the data. A topic score is only calculated if it includes at least three
indicators.
Age, Gender and Race/Ethnicity Disparities
When a given indicator has data available for population subgroups – such as age, gender and
race/ethnicity – and values for these subgroups include confidence intervals, we are able to determine if
there is a significant difference between the subgroup’s value and the overall value. A significant
difference is defined as two values with non-overlapping confidence intervals. Confidence intervals are
not available for all indicators. In these cases, disparities cannot be determined because there is not
enough data to conclude whether two values are significantly different from each other.

92
Topic Scoring Table
Table 20 shows the Topic Scores for Bladen County, with higher scores indicating a higher need.
Table 20. Topic Scores for Bladen County
Health and Quality of Life Topics
Score
Heart Disease & Stroke
2.19
Diabetes
2.17
Prevention & Safety
2.15
Older Adults & Aging
2.11
Wellness & Lifestyle
2.09
Maternal, Fetal & Infant Health
2.09
Access to Health Services
2.07
Mental Health & Mental Disorders
1.97
Economy
1.94
Other Chronic Diseases
1.90
Public Safety
1.84
Social Environment
1.84
Mortality Data
1.80
Exercise, Nutrition, & Weight
1.78
Environmental & Occupational Health
1.73
County Health Rankings
1.71
Transportation
1.69
Education
1.62
Respiratory Diseases
1.52
Environment
1.50
Cancer
1.50
Substance Abuse
1.48
Women's Health
1.32
Immunizations & Infectious Diseases
1.22
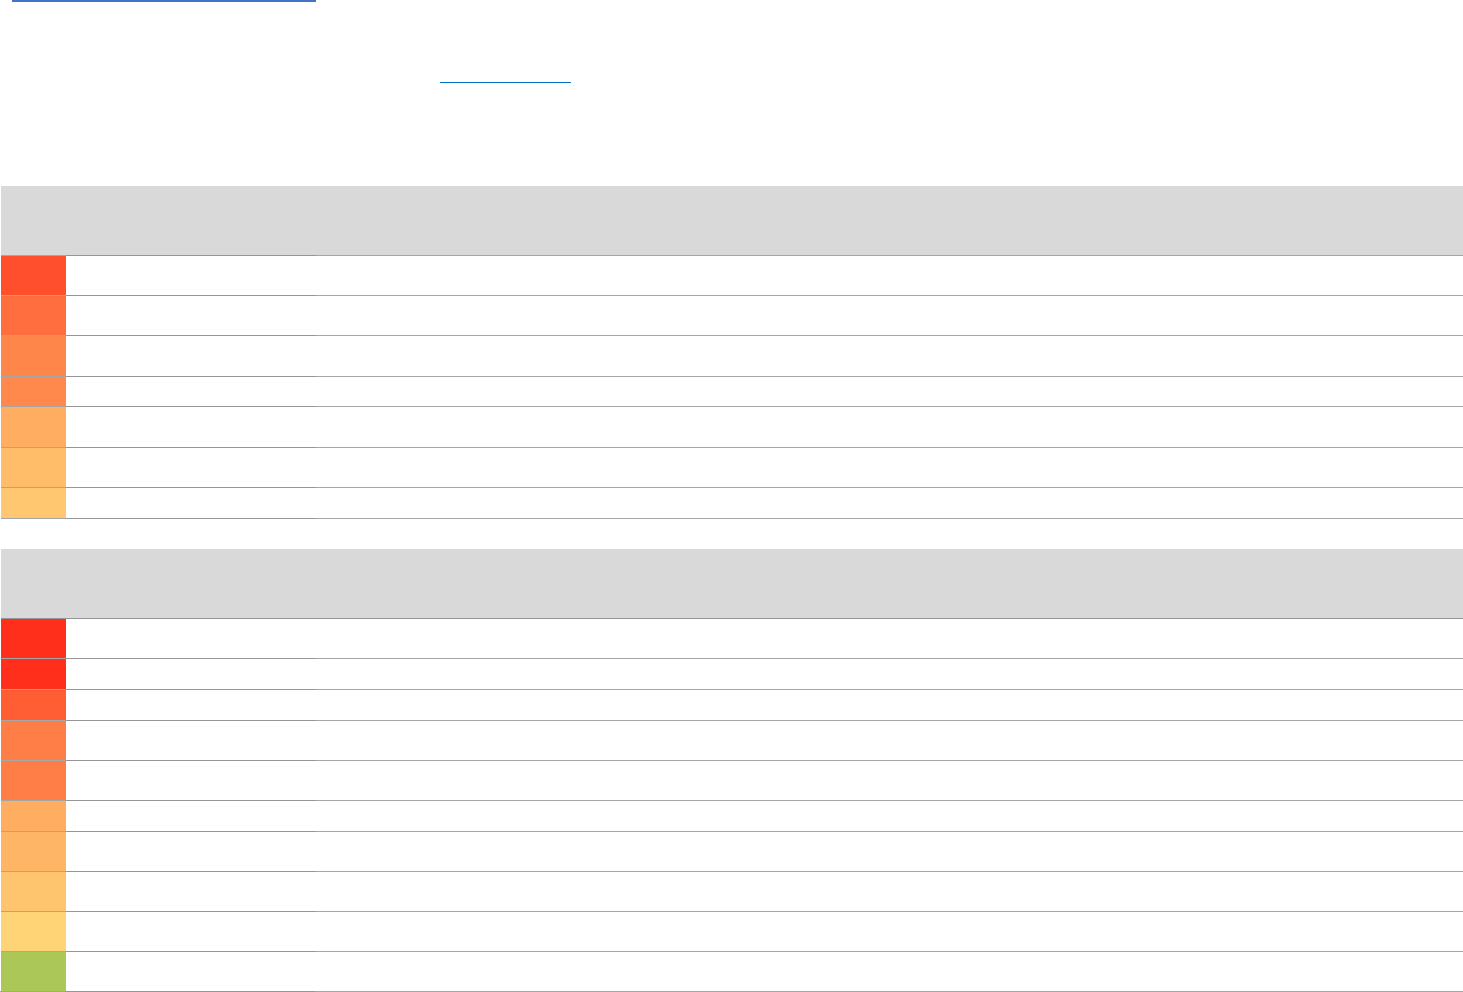
*
High Disparity includes differences in which subgroups do significantly better or significantly worse than the overall county value. Subgroup values are given in parentheses.
93
Indicator Scoring Table
Table 21 (spanning multiple pages) presents the indicator data used in the quantitative data analysis. Indicators are grouped into topic areas and sorted by
indicator score, with higher scores indicating a higher need. Bladen County values are displayed alongside various comparison values and the period of
measurement. Additional data can be found on HealthENC.org.
Table 21. Indicator Scores by Topic Area
SCOR
E
ACCESS TO HEALTH SERVICES
MEASUREMENT
PERIOD
UNITS
BLADEN
COUNTY
NORTH
CAROLINA
U.S.
HP2020
HEALTHY NC
2020
HIGH
DISPARITY*
SOURC
E
2.50
Primary Care Provider Rate
2015
providers/ 100,000
population
20.4
70.6
75.5
4
2.30
Preventable Hospital Stays:
Medicare Population
2014
discharges/ 1,000 Medicare
enrollees
80.5
49.0
49.9
19
2.15
Mental Health Provider Rate
2017
providers/ 100,000
population
59.3
215.5
214.3
4
2.13
Persons with Health Insurance
2016
percent
83.4
87.8
100.0
92.0
18
1.90
Non-Physician Primary Care
Provider Rate
2017
providers/ 100,000
population
71.1
102.5
81.2
4
1.80
Dentist Rate
2016
dentists/ 100,000
population
35.6
54.7
67.4
4
1.73
Clinical Care Ranking
2018
ranking
98.0
4
SCOR
E
CANCER
MEASUREMENT
PERIOD
UNITS
BLADEN
COUNTY
NORTH
CAROLINA
U.S.
HP2020
HEALTHY NC
2020
HIGH
DISPARITY*
SOURC
E
2.70
Age-Adjusted Death Rate due to
Pancreatic Cancer
2010-2014
deaths/ 100,000 population
13.0
10.8
10.9
7
2.70
Pancreatic Cancer Incidence Rate
2010-2014
cases/ 100,000 population
14.8
12.0
12.5
7
2.40
Colorectal Cancer Incidence Rate
2010-2014
cases/ 100,000 population
47.5
37.7
39.8
39.9
7
2.20
Mammography Screening:
Medicare Population
2014
percent
59.4
67.9
63.1
19
2.20
Oral Cavity and Pharynx Cancer
Incidence Rate
2010-2014
cases/ 100,000 population
13.5
12.2
11.5
7
1.90
Cancer: Medicare Population
2015
percent
7.9
7.7
7.8
3
1.85
Age-Adjusted Death Rate due to
Lung Cancer
2010-2014
deaths/ 100,000 population
52.5
50.7
44.7
45.5
7
1.75
Age-Adjusted Death Rate due to
Colorectal Cancer
2010-2014
deaths/ 100,000 population
15.5
14.1
14.8
14.5
10.1
7
1.65
Lung and Bronchus Cancer
Incidence Rate
2010-2014
cases/ 100,000 population
69.2
70.0
61.2
Male
7
1.00
Age-Adjusted Death Rate due to
Cancer
2010-2014
deaths/ 100,000 population
161.9
172.0
166.1
161.4
7

*
High Disparity includes differences in which subgroups do significantly better or significantly worse than the overall county value. Subgroup values are given in parentheses.
94
0.90
Liver and Bile Duct Cancer
Incidence Rate
2010-2014
cases/ 100,000 population
6.8
7.7
7.8
7
0.85
All Cancer Incidence Rate
2010-2014
cases/ 100,000 population
405.3
457.0
443.6
7
0.65
Prostate Cancer Incidence Rate
2010-2014
cases/ 100,000 males
103.1
125.0
114.8
7
0.50
Bladder Cancer Incidence Rate
2010-2014
cases/ 100,000 population
13.1
20.1
20.5
7
0.50
Breast Cancer Incidence Rate
2010-2014
cases/ 100,000 females
80.7
129.4
123.5
7
0.25
Age-Adjusted Death Rate due to
Breast Cancer
2010-2014
deaths/ 100,000 females
18.9
21.6
21.2
20.7
7
SCOR
E
CHILDREN'S HEALTH
MEASUREMENT
PERIOD
UNITS
BLADEN
COUNTY
NORTH
CAROLINA
U.S.
HP2020
HEALTHY NC
2020
HIGH
DISPARITY*
SOURC
E
2.30
Child Food Insecurity Rate
2016
percent
27.5
20.9
17.9
5
1.20
Children with Low Access to a
Grocery Store
2015
percent
1.2
22
SCOR
E
COUNTY HEALTH RANKINGS
MEASUREMENT
PERIOD
UNITS
BLADEN
COUNTY
NORTH
CAROLINA
U.S.
HP2020
HEALTHY NC
2020
HIGH
DISPARITY*
SOURC
E
1.73
Clinical Care Ranking
2018
ranking
98.0
4
1.73
Health Behaviors Ranking
2018
ranking
91.0
4
1.73
Morbidity Ranking
2018
ranking
89.0
4
1.73
Mortality Ranking
2018
ranking
98.0
4
1.73
Social and Economic Factors
Ranking
2018
ranking
93.0
4
1.58
Physical Environment Ranking
2018
ranking
58.0
4
SCOR
E
DIABETES
MEASUREMENT
PERIOD
UNITS
BLADEN
COUNTY
NORTH
CAROLINA
U.S.
HP2020
HEALTHY NC
2020
HIGH
DISPARITY*
SOURC
E
2.50
Diabetes: Medicare Population
2015
percent
37.5
28.4
26.5
3
2.30
Adults 20+ with Diabetes
2014
percent
14.7
11.1
10.0
4
2.28
Age-Adjusted Death Rate due to
Diabetes
2012-2016
deaths/ 100,000 population
36.5
23.0
21.1
17
1.60
Diabetic Monitoring: Medicare
Population
2014
percent
88.1
88.8
85.2
19
SCOR
E
DISABILITIES
MEASUREMENT
PERIOD
UNITS
BLADEN
COUNTY
NORTH
CAROLINA
U.S.
HP2020
HEALTHY NC
2020
HIGH
DISPARITY*
SOURC
E
*
High Disparity includes differences in which subgroups do significantly better or significantly worse than the overall county value. Subgroup values are given in parentheses.
95
2.30
Households with Supplemental
Security Income
2012-2016
percent
10.9
5.0
5.4
1
2.18
Persons with Disability Living in
Poverty (5-year)
2012-2016
percent
45.5
29.0
27.6
1
SCOR
E
ECONOMY
MEASUREMENT
PERIOD
UNITS
BLADEN
COUNTY
NORTH
CAROLINA
U.S.
HP2020
HEALTHY NC
2020
HIGH
DISPARITY*
SOURC
E
2.70
People 65+ Living Below Poverty
Level
2012-2016
percent
20.4
9.7
9.3
Black or African
American
1
2.65
People Living Below Poverty Level
2012-2016
percent
28.1
16.8
15.1
12.5
12-17, 6-11, <6,
Black or African
American,
Hispanic or
Latino, Other
1
2.55
Severe Housing Problems
2010-2014
percent
19.9
16.6
18.8
4
2.50
Children Living Below Poverty
Level
2012-2016
percent
43.0
23.9
21.2
Black or African
American,
Hispanic or
Latino, Other
1
2.50
Female Population 16+ in Civilian
Labor Force
2012-2016
percent
47.6
57.4
58.3
1
2.50
Population 16+ in Civilian Labor
Force
2012-2016
percent
50.3
61.5
63.1
1
2.50
Students Eligible for the Free
Lunch Program
2015-2016
percent
98.6
52.6
42.6
8
2.40
Families Living Below Poverty
Level
2012-2016
percent
22.7
12.4
11.0
Black or African
American,
Hispanic or
Latino
1
2.40
People Living 200% Above Poverty
Level
2012-2016
percent
46.4
62.3
66.4
1
2.40
Per Capita Income
2012-2016
dollars
19510
26779
29829
Black or African
American,
Hispanic or
Latino, Other,
Two or More
Races
1
2.30
Child Food Insecurity Rate
2016
percent
27.5
20.9
17.9
5
2.30
Food Insecurity Rate
2016
percent
20.9
15.4
12.9
5
2.30
Households with Supplemental
Security Income
2012-2016
percent
10.9
5.0
5.4
1
2.30
Median Household Income
2012-2016
dollars
30408
48256
55322
Black or African
American
1
2.25
Young Children Living Below
Poverty Level
2012-2016
percent
35.8
27.3
23.6
Black or African
American
1

*
High Disparity includes differences in which subgroups do significantly better or significantly worse than the overall county value. Subgroup values are given in parentheses.
96
2.18
Persons with Disability Living in
Poverty (5-year)
2012-2016
percent
45.5
29.0
27.6
1
2.10
Unemployed Workers in Civilian
Labor Force
April 2018
percent
5.1
3.7
3.7
20
2.08
Median Housing Unit Value
2012-2016
dollars
85700
157100
18470
0
1
1.90
Homeownership
2012-2016
percent
54.8
55.5
55.9
1
1.73
Social and Economic Factors
Ranking
2018
ranking
93.0
4
1.28
Median Monthly Owner Costs for
Households without a Mortgage
2012-2016
dollars
376
376
462
1
1.20
Low-Income and Low Access to a
Grocery Store
2015
percent
2.9
22
1.10
Households with Cash Public
Assistance Income
2012-2016
percent
2.0
1.9
2.7
1
1.10
SNAP Certified Stores
2016
stores/ 1,000 population
1.2
22
0.93
Median Household Gross Rent
2012-2016
dollars
615
816
949
1
0.73
Mortgaged Owners Median
Monthly Household Costs
2012-2016
dollars
983
1243
1491
1
0.70
Renters Spending 30% or More of
Household Income on Rent
2012-2016
percent
39.1
49.4
47.3
36.1
1
0.60
Total Employment Change
2014-2015
percent
18.2
3.1
2.5
21
SCOR
E
EDUCATION
MEASUREMENT
PERIOD
UNITS
BLADEN
COUNTY
NORTH
CAROLINA
U.S.
HP2020
HEALTHY NC
2020
HIGH
DISPARITY*
SOURC
E
2.00
People 25+ with a High School
Degree or Higher
2012-2016
percent
78.4
86.3
87.0
65+, Hispanic or
Latino
1
1.80
People 25+ with a Bachelor's
Degree or Higher
2012-2016
percent
14.8
29.0
30.3
1
1.70
4th Grade Students Proficient in
Reading
2016-2017
percent
50.4
57.7
13
1.65
8th Grade Students Proficient in
Math
2016-2017
percent
30.6
45.8
13
1.65
High School Graduation
2016-2017
percent
86.1
86.5
87.0
94.6
13
1.60
Student-to-Teacher Ratio
2015-2016
students/ teacher
15.8
15.6
17.7
8
1.35
4th Grade Students Proficient in
Math
2016-2017
percent
54.4
58.6
13
1.20
8th Grade Students Proficient in
Reading
2016-2017
percent
52.9
53.7
13

*
High Disparity includes differences in which subgroups do significantly better or significantly worse than the overall county value. Subgroup values are given in parentheses.
97
SCOR
E
ENVIRONMENT
MEASUREMENT
PERIOD
UNITS
BLADEN
COUNTY
NORTH
CAROLINA
U.S.
HP2020
HEALTHY NC
2020
HIGH
DISPARITY*
SOURC
E
2.55
Severe Housing Problems
2010-2014
percent
19.9
16.6
18.8
4
2.40
Access to Exercise Opportunities
2018
percent
35.6
76.1
83.1
4
1.90
Fast Food Restaurant Density
2014
restaurants/ 1,000
population
0.8
22
1.85
Food Environment Index
2018
6.6
6.4
7.7
4
1.80
Farmers Market Density
2016
markets/ 1,000 population
0.0
22
1.80
Households with No Car and Low
Access to a Grocery Store
2015
percent
4.5
22
1.80
Recreation and Fitness Facilities
2014
facilities/ 1,000 population
0.03
22
1.60
PBT Released
2016
pounds
1
23
1.58
Physical Environment Ranking
2018
ranking
58.0
4
1.45
Grocery Store Density
2014
stores/ 1,000 population
0.2
22
1.40
Recognized Carcinogens Released
into Air
2016
pounds
114736
23
1.20
Children with Low Access to a
Grocery Store
2015
percent
1.2
22
1.20
Low-Income and Low Access to a
Grocery Store
2015
percent
2.9
22
1.20
People 65+ with Low Access to a
Grocery Store
2015
percent
1.4
22
1.10
SNAP Certified Stores
2016
stores/ 1,000 population
1.2
22
0.98
Drinking Water Violations
FY 2013-14
percent
0.2
4.0
5.0
4
0.60
Houses Built Prior to 1950
2012-2016
percent
8.6
9.1
18.2
1
0.60
Liquor Store Density
2015
stores/ 100,000 population
2.9
5.8
10.5
21
SCOR
E
ENVIRONMENTAL &
OCCUPATIONAL HEALTH
MEASUREMENT
PERIOD
UNITS
BLADEN
COUNTY
NORTH
CAROLINA
U.S.
HP2020
HEALTHY NC
2020
HIGH
DISPARITY*
SOURC
E
2.50
Asthma: Medicare Population
2015
percent
10.0
8.4
8.2
3
1.58
Physical Environment Ranking
2018
ranking
58.0
4
1.10
Age-Adjusted Hospitalization Rate
due to Asthma
2014
hospitalizations/ 10,000
population
80.8
90.9
10
SCOR
E
EXERCISE, NUTRITION, & WEIGHT
MEASUREMENT
PERIOD
UNITS
BLADEN
COUNTY
NORTH
CAROLINA
U.S.
HP2020
HEALTHY NC
2020
HIGH
DISPARITY*
SOURC
E

*
High Disparity includes differences in which subgroups do significantly better or significantly worse than the overall county value. Subgroup values are given in parentheses.
98
2.65
Adults 20+ who are Obese
2014
percent
38.3
29.6
28.0
30.5
4
2.40
Access to Exercise Opportunities
2018
percent
35.6
76.1
83.1
4
2.30
Child Food Insecurity Rate
2016
percent
27.5
20.9
17.9
5
2.30
Food Insecurity Rate
2016
percent
20.9
15.4
12.9
5
2.25
Adults 20+ who are Sedentary
2014
percent
32.0
24.3
23.0
32.6
4
1.90
Fast Food Restaurant Density
2014
restaurants/ 1,000
population
0.8
22
1.85
Food Environment Index
2018
6.6
6.4
7.7
4
1.80
Farmers Market Density
2016
markets/ 1,000 population
0.0
22
1.80
Households with No Car and Low
Access to a Grocery Store
2015
percent
4.5
22
1.80
Recreation and Fitness Facilities
2014
facilities/ 1,000 population
0.03
22
1.73
Health Behaviors Ranking
2018
ranking
91.0
4
1.45
Grocery Store Density
2014
stores/ 1,000 population
0.2
22
1.25
Workers who Walk to Work
2012-2016
percent
2.4
1.8
2.8
3.1
45-54
1
1.20
Children with Low Access to a
Grocery Store
2015
percent
1.2
22
1.20
Low-Income and Low Access to a
Grocery Store
2015
percent
2.9
22
1.20
People 65+ with Low Access to a
Grocery Store
2015
percent
1.4
22
1.10
SNAP Certified Stores
2016
stores/ 1,000 population
1.2
22
SCOR
E
FAMILY PLANNING
MEASUREMENT
PERIOD
UNITS
BLADEN
COUNTY
NORTH
CAROLINA
U.S.
HP2020
HEALTHY NC
2020
HIGH
DISPARITY*
SOURC
E
1.35
Teen Pregnancy Rate
2012-2016
pregnancies/ 1,000 females
aged 15-17
19.1
15.7
36.2
17
SCOR
E
GOVERNMENT & POLITICS
MEASUREMENT
PERIOD
UNITS
BLADEN
COUNTY
NORTH
CAROLINA
U.S.
HP2020
HEALTHY NC
2020
HIGH
DISPARITY*
SOURC
E
1.50
Voter Turnout: Presidential
Election
2016
percent
67.7
67.7
15
SCOR
E
HEART DISEASE & STROKE
MEASUREMENT
PERIOD
UNITS
BLADEN
COUNTY
NORTH
CAROLINA
U.S.
HP2020
HEALTHY NC
2020
HIGH
DISPARITY*
SOURC
E
2.50
Heart Failure: Medicare Population
2015
percent
18.7
12.5
13.5
3

*
High Disparity includes differences in which subgroups do significantly better or significantly worse than the overall county value. Subgroup values are given in parentheses.
99
2.50
Ischemic Heart Disease: Medicare
Population
2015
percent
33.0
24.0
26.5
3
2.50
Stroke: Medicare Population
2015
percent
5.1
3.9
4.0
3
2.30
Hyperlipidemia: Medicare
Population
2015
percent
55.6
46.3
44.6
3
2.30
Hypertension: Medicare
Population
2015
percent
68.4
58.0
55.0
3
2.10
Age-Adjusted Death Rate due to
Heart Disease
2012-2016
deaths/ 100,000 population
243.4
161.3
161.5
17
2.10
Atrial Fibrillation: Medicare
Population
2015
percent
8.1
7.7
8.1
3
1.23
Age-Adjusted Death Rate due to
Cerebrovascular Disease (Stroke)
2012-2016
deaths/ 100,000 population
37.3
43.1
36.9
34.8
17
SCOR
E
IMMUNIZATIONS & INFECTIOUS
DISEASES
MEASUREMENT
PERIOD
UNITS
BLADEN
COUNTY
NORTH
CAROLINA
U.S.
HP2020
HEALTHY NC
2020
HIGH
DISPARITY*
SOURC
E
2.18
Gonorrhea Incidence Rate
2016
cases/ 100,000 population
225.2
194.4
145.8
11
2.03
Age-Adjusted Death Rate due to
HIV
2012-2016
deaths/ 100,000 population
3.2
2.2
2.0
3.3
17
1.48
Chlamydia Incidence Rate
2016
cases/ 100,000 population
539.4
572.4
497.3
11
1.40
AIDS Diagnosis Rate
2016
cases/ 100,000 population
7.0
7.0
11
1.10
HIV Diagnosis Rate
2014-2016
cases/ 100,000 population
11.5
16.1
22.2
11
0.58
Tuberculosis Incidence Rate
2014
cases/ 100,000 population
0.0
2.0
3.0
1.0
11
0.50
Syphilis Incidence Rate
2016
cases/ 100,000 population
0.0
10.8
8.7
9
0.48
Age-Adjusted Death Rate due to
Influenza and Pneumonia
2012-2016
deaths/ 100,000 population
12.8
17.8
14.8
13.5
17
SCOR
E
MATERNAL, FETAL & INFANT
HEALTH
MEASUREMENT
PERIOD
UNITS
BLADEN
COUNTY
NORTH
CAROLINA
U.S.
HP2020
HEALTHY NC
2020
HIGH
DISPARITY*
SOURC
E
2.43
Babies with Low Birth Weight
2012-2016
percent
10.2
9.0
8.1
7.8
16
2.33
Preterm Births
2016
percent
12.9
10.4
9.8
9.4
16
2.23
Babies with Very Low Birth Weight
2012-2016
percent
2.2
1.7
1.4
1.4
16
1.35
Teen Pregnancy Rate
2012-2016
pregnancies/ 1,000 females
aged 15-17
19.1
15.7
36.2
17
SCOR
E
MEN'S HEALTH
MEASUREMENT
PERIOD
UNITS
BLADEN
COUNTY
NORTH
CAROLINA
U.S.
HP2020
HEALTHY NC
2020
HIGH
DISPARITY*
SOURC
E
2.15
Life Expectancy for Males
2014
years
71.6
75.4
76.7
79.5
6

*
High Disparity includes differences in which subgroups do significantly better or significantly worse than the overall county value. Subgroup values are given in parentheses.
100
0.65
Prostate Cancer Incidence Rate
2010-2014
cases/ 100,000 males
103.1
125.0
114.8
7
SCOR
E
MENTAL HEALTH & MENTAL
DISORDERS
MEASUREMENT
PERIOD
UNITS
BLADEN
COUNTY
NORTH
CAROLINA
U.S.
HP2020
HEALTHY NC
2020
HIGH
DISPARITY*
SOURC
E
2.55
Poor Mental Health: Average
Number of Days
2016
days
4.6
3.9
3.8
2.8
4
2.15
Mental Health Provider Rate
2017
providers/ 100,000
population
59.3
215.5
214.3
4
2.10
Alzheimer's Disease or Dementia:
Medicare Population
2015
percent
10.2
9.8
9.9
3
2.10
Frequent Mental Distress
2016
percent
14.9
12.3
15.0
4
1.95
Depression: Medicare Population
2015
percent
17.1
17.5
16.7
3
1.88
Age-Adjusted Death Rate due to
Suicide
2012-2016
deaths/ 100,000 population
12.7
12.9
13.0
10.2
8.3
17
1.03
Age-Adjusted Death Rate due to
Alzheimer's Disease
2012-2016
deaths/ 100,000 population
24.0
31.9
26.6
17
SCOR
E
MORTALITY DATA
MEASUREMENT
PERIOD
UNITS
BLADEN
COUNTY
NORTH
CAROLINA
U.S.
HP2020
HEALTHY NC
2020
HIGH
DISPARITY*
SOURC
E
2.70
Age-Adjusted Death Rate due to
Pancreatic Cancer
2010-2014
deaths/ 100,000 population
13.0
10.8
10.9
7
2.70
Premature Death
2014-2016
years/ 100,000 population
11523.8
7281.1
6658.1
4
2.58
Age-Adjusted Death Rate due to
Homicide
2012-2016
deaths/ 100,000 population
12.2
6.2
5.5
5.5
6.7
17
2.55
Age-Adjusted Death Rate due to
Firearms
2014-2016
deaths/ 100,000 population
27.5
12.7
11.0
9.3
2
2.40
Age-Adjusted Death Rate due to
Unintentional Poisonings
2013-2015
deaths/ 100,000 population
20.9
12.9
13.4
9.9
2
2.28
Age-Adjusted Death Rate due to
Diabetes
2012-2016
deaths/ 100,000 population
36.5
23.0
21.1
17
2.10
Age-Adjusted Death Rate due to
Heart Disease
2012-2016
deaths/ 100,000 population
243.4
161.3
161.5
17
2.10
Death Rate due to Drug Poisoning
2014-2016
deaths/ 100,000 population
20.4
16.2
16.9
4
2.03
Age-Adjusted Death Rate due to
HIV
2012-2016
deaths/ 100,000 population
3.2
2.2
2.0
3.3
17
1.95
Age-Adjusted Death Rate due to
Motor Vehicle Collisions
2012-2016
deaths/ 100,000 population
35.8
14.1
17
1.88
Age-Adjusted Death Rate due to
Suicide
2012-2016
deaths/ 100,000 population
12.7
12.9
13.0
10.2
8.3
17
1.88
Age-Adjusted Death Rate due to
Unintentional Injuries
2012-2016
deaths/ 100,000 population
39.1
31.9
41.4
36.4
17

*
High Disparity includes differences in which subgroups do significantly better or significantly worse than the overall county value. Subgroup values are given in parentheses.
101
1.85
Age-Adjusted Death Rate due to
Lung Cancer
2010-2014
deaths/ 100,000 population
52.5
50.7
44.7
45.5
7
1.75
Age-Adjusted Death Rate due to
Colorectal Cancer
2010-2014
deaths/ 100,000 population
15.5
14.1
14.8
14.5
10.1
7
1.73
Mortality Ranking
2018
ranking
98.0
4
1.30
Alcohol-Impaired Driving Deaths
2012-2016
percent
26.4
31.4
29.3
4.7
4
1.23
Age-Adjusted Death Rate due to
Cerebrovascular Disease (Stroke)
2012-2016
deaths/ 100,000 population
37.3
43.1
36.9
34.8
17
1.03
Age-Adjusted Death Rate due to
Alzheimer's Disease
2012-2016
deaths/ 100,000 population
24.0
31.9
26.6
17
1.00
Age-Adjusted Death Rate due to
Cancer
2010-2014
deaths/ 100,000 population
161.9
172.0
166.1
161.4
7
0.48
Age-Adjusted Death Rate due to
Influenza and Pneumonia
2012-2016
deaths/ 100,000 population
12.8
17.8
14.8
13.5
17
0.25
Age-Adjusted Death Rate due to
Breast Cancer
2010-2014
deaths/ 100,000 females
18.9
21.6
21.2
20.7
7
SCOR
E
OLDER ADULTS & AGING
MEASUREMENT
PERIOD
UNITS
BLADEN
COUNTY
NORTH
CAROLINA
U.S.
HP2020
HEALTHY NC
2020
HIGH
DISPARITY*
SOURC
E
2.70
Chronic Kidney Disease: Medicare
Population
2015
percent
23.3
19.0
18.1
3
2.70
People 65+ Living Below Poverty
Level
2012-2016
percent
20.4
9.7
9.3
Black or African
American
1
2.50
Asthma: Medicare Population
2015
percent
10.0
8.4
8.2
3
2.50
COPD: Medicare Population
2015
percent
15.4
11.9
11.2
3
2.50
Diabetes: Medicare Population
2015
percent
37.5
28.4
26.5
3
2.50
Heart Failure: Medicare Population
2015
percent
18.7
12.5
13.5
3
2.50
Ischemic Heart Disease: Medicare
Population
2015
percent
33.0
24.0
26.5
3
2.50
Rheumatoid Arthritis or
Osteoarthritis: Medicare
Population
2015
percent
34.7
29.1
30.0
3
2.50
Stroke: Medicare Population
2015
percent
5.1
3.9
4.0
3
2.30
Hyperlipidemia: Medicare
Population
2015
percent
55.6
46.3
44.6
3
2.30
Hypertension: Medicare
Population
2015
percent
68.4
58.0
55.0
3
2.30
People 65+ Living Alone
2012-2016
percent
31.9
26.8
26.4
1
2.20
Mammography Screening:
Medicare Population
2014
percent
59.4
67.9
63.1
19
2.10
Alzheimer's Disease or Dementia:
Medicare Population
2015
percent
10.2
9.8
9.9
3

*
High Disparity includes differences in which subgroups do significantly better or significantly worse than the overall county value. Subgroup values are given in parentheses.
102
2.10
Atrial Fibrillation: Medicare
Population
2015
percent
8.1
7.7
8.1
3
1.95
Depression: Medicare Population
2015
percent
17.1
17.5
16.7
3
1.90
Cancer: Medicare Population
2015
percent
7.9
7.7
7.8
3
1.60
Diabetic Monitoring: Medicare
Population
2014
percent
88.1
88.8
85.2
19
1.20
People 65+ with Low Access to a
Grocery Store
2015
percent
1.4
22
1.03
Age-Adjusted Death Rate due to
Alzheimer's Disease
2012-2016
deaths/ 100,000 population
24.0
31.9
26.6
17
0.50
Osteoporosis: Medicare
Population
2015
percent
3.3
5.4
6.0
3
SCOR
E
ORAL HEALTH
MEASUREMENT
PERIOD
UNITS
BLADEN
COUNTY
NORTH
CAROLINA
U.S.
HP2020
HEALTHY NC
2020
HIGH
DISPARITY*
SOURC
E
2.20
Oral Cavity and Pharynx Cancer
Incidence Rate
2010-2014
cases/ 100,000 population
13.5
12.2
11.5
7
1.80
Dentist Rate
2016
dentists/ 100,000
population
35.6
54.7
67.4
4
SCOR
E
OTHER CHRONIC DISEASES
MEASUREMENT
PERIOD
UNITS
BLADEN
COUNTY
NORTH
CAROLINA
U.S.
HP2020
HEALTHY NC
2020
HIGH
DISPARITY*
SOURC
E
2.70
Chronic Kidney Disease: Medicare
Population
2015
percent
23.3
19.0
18.1
3
2.50
Rheumatoid Arthritis or
Osteoarthritis: Medicare
Population
2015
percent
34.7
29.1
30.0
3
0.50
Osteoporosis: Medicare
Population
2015
percent
3.3
5.4
6.0
3
SCOR
E
PREVENTION & SAFETY
MEASUREMENT
PERIOD
UNITS
BLADEN
COUNTY
NORTH
CAROLINA
U.S.
HP2020
HEALTHY NC
2020
HIGH
DISPARITY*
SOURC
E
2.55
Age-Adjusted Death Rate due to
Firearms
2014-2016
deaths/ 100,000 population
27.5
12.7
11.0
9.3
2
2.55
Severe Housing Problems
2010-2014
percent
19.9
16.6
18.8
4
2.40
Age-Adjusted Death Rate due to
Unintentional Poisonings
2013-2015
deaths/ 100,000 population
20.9
12.9
13.4
9.9
2
2.10
Death Rate due to Drug Poisoning
2014-2016
deaths/ 100,000 population
20.4
16.2
16.9
4
1.95
Age-Adjusted Death Rate due to
Motor Vehicle Collisions
2012-2016
deaths/ 100,000 population
35.8
14.1
17

*
High Disparity includes differences in which subgroups do significantly better or significantly worse than the overall county value. Subgroup values are given in parentheses.
103
1.88
Age-Adjusted Death Rate due to
Unintentional Injuries
2012-2016
deaths/ 100,000 population
39.1
31.9
41.4
36.4
17
1.60
Domestic Violence Deaths
2016
number
1
14
SCOR
E
PUBLIC SAFETY
MEASUREMENT
PERIOD
UNITS
BLADEN
COUNTY
NORTH
CAROLINA
U.S.
HP2020
HEALTHY NC
2020
HIGH
DISPARITY*
SOURC
E
2.58
Age-Adjusted Death Rate due to
Homicide
2012-2016
deaths/ 100,000 population
12.2
6.2
5.5
5.5
6.7
17
2.55
Age-Adjusted Death Rate due to
Firearms
2014-2016
deaths/ 100,000 population
27.5
12.7
11.0
9.3
2
2.18
Violent Crime Rate
2015
crimes/ 100,000 population
411.8
356.3
373.7
12
1.95
Age-Adjusted Death Rate due to
Motor Vehicle Collisions
2012-2016
deaths/ 100,000 population
35.8
14.1
17
1.60
Domestic Violence Deaths
2016
number
1
14
1.30
Alcohol-Impaired Driving Deaths
2012-2016
percent
26.4
31.4
29.3
4.7
4
0.75
Property Crime Rate
2016
crimes/ 100,000 population
0.0
2779.7
12
SCOR
E
RESPIRATORY DISEASES
MEASUREMENT
PERIOD
UNITS
BLADEN
COUNTY
NORTH
CAROLINA
U.S.
HP2020
HEALTHY NC
2020
HIGH
DISPARITY*
SOURC
E
2.50
Asthma: Medicare Population
2015
percent
10.0
8.4
8.2
3
2.50
COPD: Medicare Population
2015
percent
15.4
11.9
11.2
3
1.85
Age-Adjusted Death Rate due to
Lung Cancer
2010-2014
deaths/ 100,000 population
52.5
50.7
44.7
45.5
7
1.65
Lung and Bronchus Cancer
Incidence Rate
2010-2014
cases/ 100,000 population
69.2
70.0
61.2
Male
7
1.10
Age-Adjusted Hospitalization Rate
due to Asthma
2014
hospitalizations/ 10,000
population
80.8
90.9
10
0.58
Tuberculosis Incidence Rate
2014
cases/ 100,000 population
0.0
2.0
3.0
1.0
11
0.48
Age-Adjusted Death Rate due to
Influenza and Pneumonia
2012-2016
deaths/ 100,000 population
12.8
17.8
14.8
13.5
17
SCOR
E
SOCIAL ENVIRONMENT
MEASUREMENT
PERIOD
UNITS
BLADEN
COUNTY
NORTH
CAROLINA
U.S.
HP2020
HEALTHY NC
2020
HIGH
DISPARITY*
SOURC
E
2.65
People Living Below Poverty Level
2012-2016
percent
28.1
16.8
15.1
12.5
12-17, 6-11, <6,
Black or African
American,
Hispanic or
Latino, Other
1

*
High Disparity includes differences in which subgroups do significantly better or significantly worse than the overall county value. Subgroup values are given in parentheses.
104
2.50
Children Living Below Poverty
Level
2012-2016
percent
43.0
23.9
21.2
Black or African
American,
Hispanic or
Latino, Other
1
2.50
Female Population 16+ in Civilian
Labor Force
2012-2016
percent
47.6
57.4
58.3
1
2.50
Population 16+ in Civilian Labor
Force
2012-2016
percent
50.3
61.5
63.1
1
2.50
Single-Parent Households
2012-2016
percent
55.0
35.7
33.6
1
2.40
Per Capita Income
2012-2016
dollars
19510
26779
29829
Black or African
American,
Hispanic or
Latino, Other,
Two or More
Races
1
2.30
Median Household Income
2012-2016
dollars
30408
48256
55322
Black or African
American
1
2.30
People 65+ Living Alone
2012-2016
percent
31.9
26.8
26.4
1
2.25
Young Children Living Below
Poverty Level
2012-2016
percent
35.8
27.3
23.6
Black or African
American
1
2.13
Persons with Health Insurance
2016
percent
83.4
87.8
100.0
92.0
18
2.08
Median Housing Unit Value
2012-2016
dollars
85700
157100
18470
0
1
2.00
People 25+ with a High School
Degree or Higher
2012-2016
percent
78.4
86.3
87.0
65+, Hispanic or
Latino
1
1.90
Homeownership
2012-2016
percent
54.8
55.5
55.9
1
1.80
People 25+ with a Bachelor's
Degree or Higher
2012-2016
percent
14.8
29.0
30.3
1
1.73
Social and Economic Factors
Ranking
2018
ranking
93.0
4
1.65
Mean Travel Time to Work
2012-2016
minutes
25.4
24.1
26.1
1
1.55
Linguistic Isolation
2012-2016
percent
2.5
2.5
4.5
1
1.50
Voter Turnout: Presidential
Election
2016
percent
67.7
67.7
15
1.28
Median Monthly Owner Costs for
Households without a Mortgage
2012-2016
dollars
376
376
462
1
0.93
Median Household Gross Rent
2012-2016
dollars
615
816
949
1
0.73
Mortgaged Owners Median
Monthly Household Costs
2012-2016
dollars
983
1243
1491
1
0.60
Social Associations
2015
membership associations/
10,000 population
13.7
11.5
9.3
4
0.60
Total Employment Change
2014-2015
percent
18.2
3.1
2.5
21

*
High Disparity includes differences in which subgroups do significantly better or significantly worse than the overall county value. Subgroup values are given in parentheses.
105
SCOR
E
SUBSTANCE ABUSE
MEASUREMENT
PERIOD
UNITS
BLADEN
COUNTY
NORTH
CAROLINA
U.S.
HP2020
HEALTHY NC
2020
HIGH
DISPARITY*
SOURC
E
2.70
Adults who Smoke
2016
percent
21.2
17.9
17.0
12.0
13.0
4
2.10
Death Rate due to Drug Poisoning
2014-2016
deaths/ 100,000 population
20.4
16.2
16.9
4
1.73
Health Behaviors Ranking
2018
ranking
91.0
4
1.30
Alcohol-Impaired Driving Deaths
2012-2016
percent
26.4
31.4
29.3
4.7
4
0.60
Liquor Store Density
2015
stores/ 100,000 population
2.9
5.8
10.5
21
0.45
Adults who Drink Excessively
2016
percent
13.4
16.7
18.0
25.4
4
SCOR
E
TEEN & ADOLESCENT HEALTH
MEASUREMENT
PERIOD
UNITS
BLADEN
COUNTY
NORTH
CAROLINA
U.S.
HP2020
HEALTHY NC
2020
HIGH
DISPARITY*
SOURC
E
1.35
Teen Pregnancy Rate
2012-2016
pregnancies/ 1,000 females
aged 15-17
19.1
15.7
36.2
17
SCOR
E
TRANSPORTATION
MEASUREMENT
PERIOD
UNITS
BLADEN
COUNTY
NORTH
CAROLINA
U.S.
HP2020
HEALTHY NC
2020
HIGH
DISPARITY*
SOURC
E
2.00
Households without a Vehicle
2012-2016
percent
8.4
6.3
9.0
1
1.85
Workers Commuting by Public
Transportation
2012-2016
percent
0.4
1.1
5.1
5.5
1
1.80
Households with No Car and Low
Access to a Grocery Store
2015
percent
4.5
22
1.75
Workers who Drive Alone to Work
2012-2016
percent
82.2
81.1
76.4
60-64, Female,
Asian
1
1.65
Mean Travel Time to Work
2012-2016
minutes
25.4
24.1
26.1
1
1.55
Solo Drivers with a Long Commute
2012-2016
percent
33.5
31.3
34.7
4
1.25
Workers who Walk to Work
2012-2016
percent
2.4
1.8
2.8
3.1
45-54
1
SCOR
E
WELLNESS & LIFESTYLE
MEASUREMENT
PERIOD
UNITS
BLADEN
COUNTY
NORTH
CAROLINA
U.S.
HP2020
HEALTHY NC
2020
HIGH
DISPARITY*
SOURC
E
2.55
Self-Reported General Health
Assessment: Poor or Fair
2016
percent
24.1
17.6
16.0
9.9
4
2.40
Poor Physical Health: Average
Number of Days
2016
days
4.5
3.6
3.7
4
2.15
Life Expectancy for Males
2014
years
71.6
75.4
76.7
79.5
6
2.10
Frequent Physical Distress
2016
percent
14.6
11.3
15.0
4

*
High Disparity includes differences in which subgroups do significantly better or significantly worse than the overall county value. Subgroup values are given in parentheses.
106
2.05
Life Expectancy for Females
2014
years
77.5
80.2
81.5
79.5
6
1.73
Morbidity Ranking
2018
ranking
89.0
4
1.65
Insufficient Sleep
2016
percent
35.2
33.8
38.0
4
SCOR
E
WOMEN'S HEALTH
MEASUREMENT
PERIOD
UNITS
BLADEN
COUNTY
NORTH
CAROLINA
U.S.
HP2020
HEALTHY NC
2020
HIGH
DISPARITY*
SOURC
E
2.20
Mammography Screening:
Medicare Population
2014
percent
59.4
67.9
63.1
19
2.05
Life Expectancy for Females
2014
years
77.5
80.2
81.5
79.5
6
1.60
Domestic Violence Deaths
2016
number
1
14
0.50
Breast Cancer Incidence Rate
2010-2014
cases/ 100,000 females
80.7
129.4
123.5
7
0.25
Age-Adjusted Death Rate due to
Breast Cancer
2010-2014
deaths/ 100,000 females
18.9
21.6
21.2
20.7
7

107
Sources
Table 22 displays the list of sources used in secondary data scoring. Number keys are referenced alongside each indicator in the Indicator Scoring Table.
Table 22. Indicator Sources and Corresponding Number Keys
Number Key
Source
1
American Community Survey
2
Centers for Disease Control and Prevention
3
Centers for Medicare & Medicaid Services
4
County Health Rankings
5
Feeding America
6
Institute for Health Metrics and Evaluation
7
National Cancer Institute
8
National Center for Education Statistics
9
National Center for HIV/AIDS, Viral Hepatitis, STD, and TB Prevention
10
North Carolina Department of Health and Human Services
11
North Carolina Department of Health and Human Services, Communicable Disease Branch
12
North Carolina Department of Justice
13
North Carolina Department of Public Instruction
14
North Carolina Department of Public Safety
15
North Carolina State Board of Elections
16
North Carolina State Center for Health Statistics
17
North Carolina State Center for Health Statistics, Vital Statistics
18
Small Area Health Insurance Estimates
19
The Dartmouth Atlas of Health Care
20
U.S. Bureau of Labor Statistics
21
U.S. Census - County Business Patterns
22
U.S. Department of Agriculture - Food Environment Atlas
23
U.S. Environmental Protection Agency


109
English Survey
Eastern North Carolina Community Health Survey 2018
Welcome to the Community Health Survey for Eastern North Carolina!
We are conducting a Community Health Assessment for your county. This assessment is being
undertaken by a partnership of 33 counties, hospitals, health systems, and health departments in
Eastern North Carolina. It allows these partners to better understand the health status and needs
of the community they serve and use the knowledge gained to implement programs that will
benefit the community.
We can better understand community needs by gathering voices from the community. This
survey allows community members like you to tell us about what you feel are important issues
for your community. We estimate that it will take about 20 minutes to complete this ~60
question survey. Your answers to these questions will be kept confidential and anonymous.
Thank you very much for your input and your time! If you have questions about this survey,
please contact Will Broughton at [email protected].
Part 1: Quality of Life
First, tell us a little bit about yourself...
1. Where do you currently live?
ZIP/Postal Code

110
2. What county do you live in?
Beaufort
Bertie
Bladen
Camden
Carteret
Chowan
Cumberland
Currituck
Dare
Duplin
Edgecombe
Franklin
Gates
Greene
Halifax
Hertford
Hoke
Hyde
Johnston
Lenoir
Martin
Nash
Onslow
Pamlico
Pasquotank
Pender
Perquimans
Pitt
Sampson
Tyrrell
Washington
Wayne
Wilson
North Carolina County Map

111
3. Think about the county that you live in. Please tell us whether you “strongly disagree”,
“disagree”, “neutral”, “agree” or “strongly agree” with each of the next 9 statements.
Statements
Strongly Strongly
Disagree Disagree Neutral Agree Agree
There is good healthcare in my County.
This County is a good place to raise children.
This County is a good place to grow old.
There is plenty of economic opportunity in this
County.
This County is a safe place to live.
There is plenty of help for people during times
of need in this County.
There is affordable housing that meets my
needs in this County.
There are good parks and recreation facilities
in this County.
It is easy to buy healthy foods in this County.

112
PART 2: Community Improvement
The next set of questions will ask about community problems, issues, and services that are
important to you. Remember your choices will not be linked to you in any way.
4. Please look at this list of community issues. In your opinion, which one issue most affects
the quality of life in this County? (Please choose only one.)
Pollution (air,
water, land)
Dropping out of
school
Low
income/poverty
Homelessness
Lack
of/inadequate health
insurance
Hopelessness
Discrimination/
racism
Lack of community
support
Drugs (Substance
Abuse)
Neglect and abuse
Elder abuse
Child abuse
Domestic violence
Violent crime
(murder, assault)
Theft
Rape/sexual
assault
Other (please specify)

113
5. In your opinion, which one of the following services needs the most improvement in your
neighborhood or community? (Please choose only one.)
Animal control
Child care options
Elder care options
Services for
disabled people
More affordable
health services
Better/ more
healthy food choices
More
affordable/better housing
Number of health
care providers
Culturally
appropriate health
services
Counseling/
mental health/ support
groups
Better/ more
recreational facilities
(parks, trails, community
centers)
Healthy family
activities
Positive teen
activities
Transportation
options Availability
of employment
Higher paying
employment
Road maintenance
Road safety
None
Other (please specify)

114
PART 3: Health Information
Now we'd like to hear more about where you get health information...
6. In your opinion, which one health behavior do people in your own community need more
information about? (Please suggest only one.)
Eating well/
nutrition
Exercising/ fitness
Managing weight
Going to a dentist
for check-ups/ preventive
care
Going to the
doctor for yearly check-
ups and screenings
Getting prenatal
care during pregnancy
Getting flu shots
and other vaccines
Preparing for an
emergency/disaster
Using child safety
car seats
Using seat belts
Driving safely
Quitting smoking/
tobacco use prevention
Child care/
parenting
Elder care
Caring for family
members with special
needs/ disabilities
Preventing
pregnancy and sexually
transmitted disease (safe
sex)
Substance abuse
prevention (ex: drugs and
alcohol)
Suicide prevention
Stress
management
Anger
management
Domestic violence
prevention
Crime prevention
Rape/ sexual
abuse prevention
None
Other (please specify)

115
7. Where do you get most of your health-related information? (Please choose only one.)
Friends and family
Doctor/nurse
Pharmacist
Church
Internet
My child's school
Hospital
Health department
Employer
Help lines
Books/magazines
Other (please specify)

116
8. What health topic(s)/ disease(s) would you like to learn more about?
9. Do you provide care for an elderly relative at your residence or at another residence?
(Choose only one.)
Yes
No
10. Do you have children between the ages of 9 and 19 for whom you are the caretaker?
(Includes step-children, grandchildren, or other relatives.) (Choose only one.)
Yes
No (if No, skip to question #12)
11. Which of the following health topics do you think your child/children need(s) more
information about? (Check all that apply.)
Dental hygiene
Nutrition
Eating disorders
Fitness/Exercise
Asthma
management
Diabetes
management
Tobacco
STDs (Sexually
Transmitted Diseases)
Sexual intercourse
Alcohol
Drug abuse
Reckless
driving/speeding
Mental health
issues
Suicide prevention
Other (please specify)

117
PART 4: Personal Health
These next questions are about your own personal health. Remember, the answers you give for
this survey will not be linked to you in any way.
12. Would you say that, in general, your health is... (Choose only one.)
Excellent
Very Good
Good
Fair
Poor
Don't know/not sure
13. Have you ever been told by a doctor, nurse, or other health professional that you have
any of the following health conditions?
Yes
No
Don’t Know
Asthma
Depression or anxiety
High blood pressure
High cholesterol
Diabetes (not during
pregnancy)
Osteoporosis
Overweight/obesity
Angina/heart disease
Cancer

118
14. Which of the following preventive services have you had in the past 12 months? (Check
all that apply.)
Mammogram
Prostate cancer
screening
Colon/rectal exam
Blood sugar check
Cholesterol
Hearing screening
Bone density test
Physical exam
Pap smear
Flu shot
Blood pressure
check
Skin cancer
screening
Vision screening
Cardiovascular
screening
Dental cleaning/X-
rays
None of the above
15. About how long has it been since you last visited a dentist or dental clinic for any
reason? Include visits to dental specialists, such as orthodontists. (Choose only one.)
Within the past year (anytime less than 12 months ago)
Within the past 2 years (more than 1 year but less than 2 years ago)
Within the past 5 years (more than 2 years but less than 5 years ago)
Don't know/not sure
Never
16. In the past 30 days, have there been any days when feeling sad or worried kept you
from going about your normal activities? (Choose only one.)
Yes
No
Don’t know/not sure

119
17. The next question is about alcohol. One drink is equivalent to a 12-ounce beer, a 5
ounce glass of wine, or a drink with one shot of liquor.
Considering all types of alcoholic beverages, how many times during the past 30 days did
you have 5 or more drinks (if male) or 4 or more drinks (if female) on an occasion?
0
1
2
3
4
5
6
7
8
9
10
11
12
13
14
15
16
17
18
19
20
21
22
23
24
25
26
27
28
29
30
Don’t know / not sure
18. Now we will ask a question about drug use. The answers that people give us about their
use of drugs are important for understanding health issues in the county. We know that
this information is personal, but remember your answers will be kept confidential.
Have you used any illegal drugs within the past 30 days? When we say illegal drugs this
includes marijuana, cocaine, crack cocaine, heroin, or any other illegal drug substance. On
about how many days have you used one of these drugs? (Choose only one.)
0
1
2
3
4
5
6
7
8
9
10
11
12
13
14
15
16
17
18
19
20
21
22
23
24
25
26
27
28
29
30
Don’t know / not sure
(if you responded 0, skip to question #20)
19. During the past 30 days, which illegal drug did you use? (Check all that apply.)
Marijuana
Cocaine
Heroin
Other (please specify)

120
20. During the past 30 days, have you taken any prescription drugs that you did not have a
prescription for (such as Oxycontin, Percocet, Demerol, Adderall, Ritalin, or Xanax)? How
many times during the past 30 days did you use a prescription drug that you did not have a
prescription for? (Choose only one.)
0
1
2
3
4
5
6
7
8
9
10
11
12
13
14
15
16
17
18
19
20
21
22
23
24
25
26
27
28
29
30
Don’t know / not sure
21. The next question relates to veteran's health. Have you ever served on active duty in the
US Armed Forces (not including active duty only for training in the Reserves or National
Guard)? (Choose only one.)
Yes
No (if No, skip to question #23)
22. Has a doctor or other health professional ever told you that you have depression,
anxiety, or post traumatic stress disorder (PTSD)? (Choose only one.)
Yes
No
23. Now we'd like to know about your fitness. During a normal week, other than in your
regular job, do you engage in any physical activity or exercise that lasts at least a half an
hour? (Choose only one.)
Yes
No (if No, skip to question #26)
Don’t know/not sure (if Don’t know/not sure, skip to question #26)

121
24. Since you said yes, how many times do you exercise or engage in physical activity
during a normal week?
25. Where do you go to exercise or engage in physical activity? (Check all that apply.)
YMCA
Park
Public Recreation Center
Private Gym
Worksite/Employer
School Facility/Grounds
Home
Place of Worship
Other (please specify)
Since you responded YES to #23 (physical activity/exercise), skip to question #27.
26. Since you said "no", what are the reasons you do not exercise for at least a half hour
during a normal week? You can give as many of these reasons as you need to.
My job is physical or hard labor
Exercise is not important to me.
I don't have access to a facility that
has the things I need, like a pool, golf course,
or a track.
I don't have enough time to exercise.
I would need child care and I
don't have it.
I don't know how to find
exercise partners.
I don't like to exercise.
It costs too much to exercise.

122
There is no safe place to exercise.
I would need transportation and I
don't have it.
I'm too tired to exercise.
I'm physically disabled.
I don't know
Other (please specify)

123
27. Not counting lettuce salad or potato products such as french fries, think about how
often you eat fruits and vegetables in an average week.
How many cups per week of fruits and vegetables would you say you eat? (One apple or 12
baby carrots equal one cup.)
Number of Cups of Fruit
Number of Cups of Vegetables
Number of Cups of 100% Fruit Juice
28. Have you ever been exposed to secondhand smoke in the past year? (Choose only one.)
Yes
No (if No, skip to question #30)
Don’t know/not sure (if Don’t know/not sure, skip to question #30)
29. If yes, where do you think you are exposed to secondhand smoke most often? (Check
only one.)
Home
Workplace
Hospitals
Restaurants
School
I am not exposed to secondhand smoke.
Other (please specify)

124
30. Do you currently use tobacco products? (This includes cigarettes, electronic cigarettes,
chewing tobacco and vaping.) (Choose only one.)
Yes
No (if No, skip to question #32)
31. If yes, where would you go for help if you wanted to quit? (Choose only one).
Quit Line NC
Doctor
Pharmacy
Private counselor/therapist
Health Department
I don't know
Not applicable; I don't want to quit
Other (please specify)
32. Now we will ask you questions about your personal flu vaccines. An influenza/flu
vaccine can be a "flu shot" injected into your arm or spray like "FluMist" which is
sprayed into your nose. During the past 12 months, have you had a seasonal flu vaccine?
(Choose only one.)
Yes, flu shot

125
Yes, flu spray
Yes, both
No
Don’t know/not sure

126
Part 5: Access to Care/Family Health
33. Where do you go most often when you are sick? (Choose only one.)
Doctor’s office
Health department
Hospital
Medical clinic
Urgent care center
Other (please specify)
34. Do you have any of the following types of health insurance or health care
coverage? (Choose all that apply.)
Health insurance my employer provides
Health insurance my spouse's employer provides
Health insurance my school provides
Health insurance my parent or my parent's employer provides
Health insurance I bought myself
Health insurance through Health Insurance Marketplace (Obamacare)
The military, Tricare, or the VA
Medicaid
Medicare
No health insurance of any kind

127
35. In the past 12 months, did you have a problem getting the health care you needed for
you personally or for a family member from any type of health care provider, dentist,
pharmacy, or other facility? (Choose only one.)
Yes
No (if No, skip to question #38)
Don’t know/not sure
36. Since you said "yes," what type of provider or facility did you or your family member
have trouble getting health care from? You can choose as many of these as you need to.
Dentist
General practitioner
Eye care/
optometrist/
ophthalmologist
Pharmacy/
prescriptions
Pediatrician
OB/GYN
Health
department
Hospital
Urgent Care Center
Medical Clinic
Specialist
Other (please specify)
37. Which of these problems prevented you or your family member from getting the
necessary health care? You can choose as many of these as you need to.
No health insurance.
Insurance didn't cover what I/we needed.

128
My/our share of the cost (deductible/co-pay) was too high.
Doctor would not take my/our insurance or Medicaid.
Hospital would not take my/our insurance.
Pharmacy would not take my/our insurance or Medicaid.
Dentist would not take my/our insurance or Medicaid.
No way to get there.
Didn't know where to go.
Couldn't get an appointment.
The wait was too long.
The provider denied me care or treated me in a discriminatory manner because of my
HIV status, or because I am an LGBT individual.

129
38. In what county are most of the medical providers you visit located? (Choose only one.)
Beaufort
Bertie
Bladen
Brunswick
Camden
Carteret
Chowan
Columbus
Craven
Cumberland
Currituck
Dare
Duplin
Edgecombe
Franklin
Gates
Granville
Greene
Halifax
Harnett
Hertford
Hoke
Hyde
Johnston
Jones
Lenoir
Martin
Moore
Nash
New
Hanover
Northampton
Onslow
Pamlico
Pasquotank
Pender
Perquimans
Pitt
Richmond
Robeson
Sampson
Scotland
Tyrrell
Vance
Wake
Warren
Washington
Wayne
Wilson
The State of
Virginia
Other (please specify)

130
North Carolina County Map

131
39. In the previous 12 months, were you ever worried about whether your family's food
would run out before you got money to buy more? (Choose only one.)
Yes
No
Don’t know/not sure
40. If a friend or family member needed counseling for a mental health or a drug/alcohol
abuse problem, who is the first person you would tell them to talk to? (Choose only one.)
Private counselor or therapist
Support group (e.g., AA. Al-Anon)
School counselor
Don't know
Doctor
Pastor/Minister/Clergy
Other (please specify)

132
Part 6: Emergency Preparedness
41. Does your household have working smoke and carbon monoxide detectors? (Choose
only one.)
Yes, smoke detectors only
Yes, both
Don't know/not sure
Yes, carbon monoxide detectors only
No
42. Does your family have a basic emergency supply kit? (These kits include water, non-
perishable food, any necessary prescriptions, first aid supplies, flashlight and batteries,
non-electric can opener, blanket, etc.)
Yes
No
Don't know/not sure
If yes, how many days do you have supplies for? (Write number of days)
43. What would be your main way of getting information from authorities in a large-scale
disaster or emergency? (Check only one.)
Television
Radio
Internet
Telephone (landline)
Cell Phone
Print media (ex: newspaper)
Social networking site
Neighbors
Family
Text message (emergency alert
system)
Don't know/not sure

133
Other (please specify)
44. If public authorities announced a mandatory evacuation from your neighborhood or
community due to a large-scale disaster or emergency, would you evacuate?
(Check only one.)
Yes (if Yes, skip to question #46)
No
Don’t know/not sure
45. What would be the main reason you might not evacuate if asked to do so? (Check only
one.)
Lack of transportation
Lack of trust in public officials
Concern about leaving property
behind
Concern about personal safety
Concern about family safety
Concern about leaving pets
Concern about traffic jams and
inability to get out
Health problems (could not be
moved)
Don't know/not sure
Other (please specify)

134
Part 7: Demographic Questions
The next set of questions are general questions about you, which will only be reported as a
summary of all answers given by survey participants. Your answers will remain anonymous.
46. How old are you? (Choose only one.)
15-19
20-24
25-29
30-34
35-39
40-44
45-49
50-54
55-59
60-64
65-69
70-74
75-79
80-84
85 or older
47. What is your gender? (Choose only one.)
Male
Female
Transgender
Gender non-conforming
Other
48. Are you of Hispanic, Latino, or Spanish origin? (Choose only one).
I am not of Hispanic, Latino or Spanish origin
Mexican, Mexican American, or Chicano
Puerto Rican
Cuban or Cuban American
Other Hispanic or Latino (please specify)

135
49. What is your race? (Choose only one).
White or Caucasian
Black or African American
American Indian or Alaska Native
Asian Indian
Other Asian including Japanese, Chinese, Korean, Vietnamese, and Filipino/a
Other Pacific Islander including Native Hawaiian, Samoan, Guamanian/Chamorro
Other race not listed here (please specify)
50. Is English the primary language spoken in your home? (Choose only one.)
Yes
No. If no, please specify the primary language spoken in your home.
51. What is your marital status? (Choose only one.)
Never married/single
Married
Unmarried partner
Divorced

136
Widowed
Separated
Other (please specify)

137
52. Select the highest level of education you have achieved. (Choose only one.)
Less than 9th grade
9-12th grade, no diploma
High School graduate (or GED/equivalent)
Associate's Degree or Vocational Training
Some college (no degree)
Bachelor's degree
Graduate or professional degree
Other (please specify)
53. What was your total household income last year, before taxes? (Choose only one.)
Less than $10,000
$10,000 to $14,999
$15,000 to $24,999
$25,000 to $34,999
$35,000 to $49,999
$50,000 to $74,999
$75,000 to $99,999
$100,000 or more
54. Enter the number of individuals in your household (including yourself).
55. What is your employment status? (Check all that apply.)
Employed full-time
Employed part-time
Retired
Armed forces
Disabled
Student

138
Homemaker
Self-employed
Unemployed for 1 year or less
Unemployed for more than 1
year

139
56. Do you have access to the Internet at home (including broadband, wifi, dial-up or cellular data)?
(Choose only one.)
Yes
No
Don't know/not sure
57. (Optional) Is there anything else you would like us to know about your community? Please feel free to
tell us below.


141
Spanish Survey
Encuesta de salud de la comunidad del Este de Carolina del Norte 2018
¡Bienvenido a la encuesta de salud comunitaria para el Este de Carolina del Norte!
Estamos llevando a cabo una evaluación de salud comunitaria para su condado. Esta evaluación
está siendo realizada por una asociación de 33 condados, hospitales, sistemas de salud y
departamentos de salud en el Este de Carolina del Norte. Esta evaluación les permite a estos
socios comprender mejor el estado de salud y las necesidades de la comunidad a la que sirven y
utilizar el conocimiento adquirido para implementar programas que beneficiarán a esta
comunidad.
Podemos entender mejor las necesidades de la comunidad reuniendo las voces de los miembros
de su comunidad. Esta evaluación permite que los miembros de la comunidad como usted, nos
cuente sobre lo que considera son asuntos importantes para su comunidad. De ante mano le
agradecemos por los 20 minutos que tomará completar esta encuesta de 57 preguntas. Sus
respuestas a estas preguntas se mantendrán confidenciales y anónimas.
¡Muchas gracias por su aporte y su tiempo! Si tiene preguntas sobre esta encuesta, puede enviar
un correo electrónico a Will Broughton en [email protected].
PARTE 1: Calidad de vida
Primero, cuéntanos un poco sobre usted:
3. ¿Dónde vive actualmente?
Código postal

142
4. ¿En qué condado vive?
Beaufort
Bertie
Bladen
Camden
Carteret
Chowan
Cumberland
Currituck
Dare
Duplin
Edgecombe
Franklin
Gates
Greene
Halifax
Hertford
Hoke
Hyde
Johnston
Lenoir
Martin
Nash
Onslow
Pamlico
Pasquotank
Pender
Perquimans
Pitt
Sampson
Tyrrell
Washington
Wayne
Wilson
Mapa del condado de Carolina del Norte

143
3. Piense en el condado en el que vive. Por favor díganos si está "totalmente en
desacuerdo", "en desacuerdo", "neutral", "de acuerdo" o "muy de acuerdo" con cada una
de las siguientes 9 declaraciones.
Declaración
Muy en En De Muy de
desacuerdo desacuerdo Neutral acuerdo acuerdo
Hay una buena atención médica en mi
condado.
Este condado es un buen lugar para criar
niños.
Este condado es un buen lugar para envejecer.
Hay buenas oportunidades económicas en
este condado.
Este condado es un lugar seguro para vivir.
Hay mucha ayuda para las personas durante
los momentos de necesidad en este condado.
Hay viviendas accesibles que satisfacen mis
necesidades en este condado.
Hay buenos parques e instalaciones de
recreación en este condado.
Es fácil adquirir comidas saludables en este
condado.

144
PARTE 2: Mejora de la comunidad
La siguiente serie de preguntas le preguntará sobre problemas y servicios de la comunidad que
son importantes para usted. Recuerde que sus respuestas son privadas y no serán relacionadas
con usted en ninguna manera.
4. Mire esta lista de problemas de la comunidad. En su opinión, ¿qué problema afecta más
la calidad de vida en este condado? (Elija solo una respuesta)
Contaminación
(aire, agua, tierra)
Abandono de la
escuela
Bajos ingresos /
pobreza
Falta de hogar
Falta de un seguro
de salud adecuado
Desesperación
Discriminación /
racismo
Falta de apoyo de
la comunidad
Drogas (Abuso de
sustancias)
Descuido y abuso
Maltrato a
personas mayores
Abuso infantil
Violencia
doméstica
Delito violento
(asesinato, asalto)
Robo
Violación /
agresión sexual
Otros (especificar)

145
5. En su opinión, ¿cuál de los siguientes servicios necesita la mayor mejoría en su
vecindario o comunidad? (Por favor elija solo uno)
Control Animal
Opciones de
cuidado infantil
Opciones de
cuidado para ancianos
Servicios para
personas con
discapacidad
Servicios de salud
más accesibles
Mejores y más
opciones de alimentos
saludables
Más accesibilidad /
mejores vivienda
Número de
proveedores de atención
médica
Servicios de salud
apropiados de acuerdo a
su cultura
Consejería / salud
mental / grupos de apoyo
Mejores y más
instalaciones recreativas
(parques, senderos,
centros comunitarios)
Actividades
familiares saludables
Actividades
positivas para
adolescentes
Opciones de
transporte
Disponibilidad de
empleo
Empleos mejor
pagados
Mantenimiento de
carreteras
Carreteras seguras
Ninguna
Otros (especificar)

146
PARTE 3: Información de salud
Ahora nos gustaría saber un poco más sobre dónde usted obtiene información de salud.
6. En su opinión, ¿sobre qué área de salud necesitan más información las personas de su
comunidad? (Por favor sugiera solo uno)
Comer bien /
nutrición
Ejercicio
Manejo del peso
Ir a un dentista
para chequeos / cuidado
preventivo
Ir al médico para
chequeos y exámenes
anuales
Obtener cuidado
prenatal durante el
embarazo
Recibir vacunas
contra la gripe y otras
vacunas
Prepararse para
una emergencia /
desastre
Usar asientos de
seguridad para niños
Usar cinturones de
seguridad
Conducir
cuidadosamente
Dejar de fumar /
prevención del uso de
tabaco
Cuidado de niños /
crianza
Cuidado de
ancianos
Cuidado de
miembros de familia con
necesidades especiales o
discapacidades
Prevención del
embarazo y
enfermedades de
transmisión sexual (sexo
seguro)
Prevención del
abuso de sustancias (por
ejemplo, drogas y
alcohol)
Prevención del
suicidio
Manejo del estrés
Control de la
ira/enojo
Prevención de
violencia doméstica
Prevención del
crimen
Violación /
prevención de abuso
sexual
Ninguna

147
Otros (especificar)

148
7. De dónde saca la mayor parte de su información relacionada con la salud? (Por favor
elija solo una respuesta)
Amigos y familia
Doctor /
enfermera
Farmacéutico
Iglesia
Internet
La escuela de mi
hijo
Hospital
Departamento de
salud
Empleador
Líneas telefónicas
de ayuda
Libros / revistas
Otros (especificar)
8. ¿De qué temas o enfermedades de salud le gustaría aprender más?
9. ¿Cuida de un pariente anciano en su casa o en otra casa? (Elija solo una).
Sí
No
10. ¿Tiene hijos entre las edades de 9 y 19 de los cuales usted es el guardián? (Incluye
hijastros, nietos u otros parientes). (Elija solo una).
Sí
No (Si su respuesta es No, salte a la pregunta numero 12)

149
11. ¿Cuáles de los siguientes temas de salud cree que sus hijos necesitan más información?
(Seleccione todas las opciones que corresponden).
Higiene dental
Nutrición
Trastornos de la
alimentación
Ejercicios
Manejo del asma
Manejo de la
diabetes
Tabaco
ETS
(enfermedades de
transmisión sexual)
Relación sexual
Alcohol
Abuso de drogas
Manejo
imprudente / exceso de
velocidad
Problemas de
salud mental
Prevención del
suicidio
Otros (especificar)

150
PARTE 4: Salud personal
Las siguientes preguntas son sobre su salud personal. Recuerde, las respuestas que brinde para
esta encuesta no serán ligadas con usted de ninguna manera.
12. En general, diría que su salud es... (Elija solo una).
Excelente
Muy buena
Buena
Justa
Pobre
No sé / no estoy seguro
13. ¿Alguna vez un médico, enfermera u otro profesional de la salud le dijo que tiene
alguna de las siguientes condiciones de salud?
Sí
No
No lo sé
Asma
Depresión o ansiedad
Alta presión sanguínea
Colesterol alto
Diabetes (no durante el
embarazo)
Osteoporosis
Sobrepeso / obesidad
Angina / enfermedad cardíaca
Cáncer

151
14. ¿Cuál de los siguientes servicios preventivos ha tenido usted en los últimos 12 meses?
(Seleccione todas las opciones que corresponden).
Mamografía
Examen de cáncer
de próstata
Examen de colon /
recto
Control de azúcar
en la sangre
Examen de
Colesterol
Examen de
audición (escucha)
Prueba de
densidad de los huesos
Examen físico
Prueba de
Papanicolaou
Vacuna contra la
gripe
Control de la
presión arterial
Pruebas de cáncer
de piel
Examen de la vista
Evaluación
cardiovascular (el
corazón)
Limpieza dental /
radiografías
Ninguna de las
anteriores
15. ¿Cuánto tiempo hace desde la última vez que visitó a un dentista o clínica dental por
algún motivo? Incluya visitas a especialistas dentales, como ortodoncista. (Elija solo una).
En el último año (en los últimos 12 meses)
Hace 2 (más de un año pero menos de dos años)
Hace más de 5 años (más de 2 años pero menos de 5 años)
No sé / no estoy seguro
Nunca
16. En los últimos 30 días, ¿ha habido algún día que se ha sentido triste o preocupado y le
haya impedido realizar sus actividades normales? (Elija solo una).
Sí

152
No
No sé / no estoy seguro

153
17. La siguiente pregunta es sobre el alcohol. Un trago es equivalente a una cerveza de 12
onzas, una copa de vino de 5 onzas o una bebida con un trago de licor.
Considerando todos los tipos de bebidas alcohólicas, ¿cuántas veces durante los últimos 30
días tomó 5 o más bebidas (si es hombre) o 4 o más bebidas (si es mujer) en una ocasión?
0
1
2
3
4
5
6
7
8
9
10
11
12
13
14
15
16
17
18
19
20
21
22
23
24
25
26
27
28
29
30
No sé / no estoy seguro
18. Ahora le vamos a hacer una pregunta sobre el uso de drogas. Las respuestas que nos
dan las personas sobre su uso de drogas son importantes para comprender los problemas
de salud en el condado. Sabemos que esta información es personal, pero recuerde que sus
respuestas se mantendrán confidenciales.
¿Has usado alguna droga ilegal en los últimos 30 días? Cuando decimos drogas, incluimos
marihuana, cocaína, crack, heroína o cualquier otra sustancia ilegal. ¿Aproximadamente
cuántos días has usado una de estas drogas ilegales? (Elija solo una).
0
1
2
3
4
5
6
7
8
9
10
11
12
13
14
15
16
17
18
19
20
21
22
23
24
25
26
27
28
29
30
No sé / no estoy seguro
(Si su respuesta es 0, salte a la pregunta numero 20)
19. Durante los últimos 30 días, ¿qué droga ilegal ha usado? (Marque todas las que
corresponden).
Mariguana
Cocaína

154
Heroína
Otros (especificar)
20. Durante los últimos 30 días, ¿ha tomado algún medicamento recetado para el que no
tenía una receta (por ejemplo, Oxycontin, Percocet, Demerol, Adderall, Ritalin o Xanax)?
¿Cuántas veces durante los últimos 30 días usó un medicamento recetado para el cual no
tenía una receta? (Elija solo una).
0
1
2
3
4
5
6
7
8
9
10
11
12
13
14
15
16
17
18
19
20
21
22
23
24
25
26
27
28
29
30
No sé / no estoy seguro
21. La siguiente pregunta se relaciona con la salud de una persona que ha servido en las
fuerzas Armadas. ¿Alguna vez ha estado en servicio activo en las Fuerzas Armadas de los
Estados Unidos (Sin incluir el servicio activo de solo entrenamientos en las Reservas o la
Guardia Nacional)? (Elija solo una).
Sí
No (Si su respuesta es No, salte a la pregunta numero 23)
22. ¿Alguna vez un médico u otro profesional de la salud le ha dicho que tiene depresión,
ansiedad o trastorno por estrés postraumático (TEPT)? (Elija solo una).
Sí
No

155
23. Ahora nos gustaría saber sobre su estado físico. Durante una semana normal, aparte de
su trabajo habitual, ¿realiza alguna actividad física o ejercicio que dure al menos media
hora? (Elija solo una).
Sí
No (Si su respuesta es No, salte a la pregunta numero 26)
No sé / no estoy seguro (Si su respuesta es No se / no estoy seguro, salte a la
pregunta numero 26)
24. Como dijo que sí, ¿cuántas veces hace ejercicio o se involucra en alguna actividad física
durante una semana normal?

156
25. ¿A dónde va a hacer ejercicio o participa en actividad físicas? (Marque todas las que
corresponden).
YMCA
Parque
Centro de Recreación Pública
Gimnasio privado
Sitio de trabajo / Empleador
Terrenos escolares / instalaciones
Casa
Iglesia
Otros (especificar)
Como su respuesta fue Si a la pregunta 23 (actividad física / ejercicio), salte a la pregunta
numero 27
26. Ya que dijo "no", ¿cuáles son las razones por las que no hace ejercicio por media hora
durante una semana normal? Puedes dar tantos de estos motivos como necesite.
Mi trabajo es trabajo físico o trabajo
duro
El ejercicio no es importante para mí.
No tengo acceso a una instalación
que tenga las cosas que necesito, como una
piscina, un campo de golf o una pista.
No tengo suficiente tiempo para hacer
ejercicio.
Necesitaría cuidado de niños y
no lo tengo.
No sé cómo encontrar
compañeros de ejercicio.
No me gusta hacer ejercicio
Me cuesta mucho hacer
ejercicio.
No hay un lugar seguro para
hacer ejercicio.

157
Necesito transporte y no lo tengo.
Estoy demasiado cansado para hacer
ejercicio.
Estoy físicamente deshabilitado.
No lo sé.
Otros (especificar)

158
27. Sin contar ensalada de lechuga o productos de papa como papas fritas, piense en la
frecuencia con la que come frutas y verduras en una semana normal.
¿Cuántas tazas por semana de frutas y vegetales dirías que comes? (Una manzana o 12
zanahorias pequeñas equivalen a una taza).
Cantidad de tazas de fruta
Número de tazas de verduras
Cantidad de tazas de jugo de fruta 100%
28. ¿Alguna vez estuvo expuesto al humo del cigarro de alguien que fumó cerca de usted
durante el último año? (Elija solo una).
Sí
No (Si su respuesta es No, salte a la pregunta numero 30)
No sé / no estoy seguro (Si su respuesta es No se / no estoy seguro, salte a la
pregunta numero 30)
29. En caso afirmativo, ¿dónde cree que está expuesto al humo de segunda mano con
mayor frecuencia? (Marque solo uno)
Casa
Lugar de trabajo
Hospitales
Restaurantes
Colegio
No estoy expuesto al humo de segunda mano.
Otros (especificar)

159
30. ¿Actualmente usa algún producto que contiene tabaco? (Esto incluye cigarros, cigarros
electrónicos, masticar tabaco o cigarro de vapor.) (Elija solo una).
Sí
No (Si su respuesta es No, salte a la pregunta numero 32)
31. En caso afirmativo, ¿a dónde iría en busca de ayuda si quisiera dejar de fumar? (Elija
solo una).
QUITLINE NC (ayuda por teléfono)
Doctor
Farmacia
Consejero / terapeuta privado
Departamento de salud
No lo sé
No aplica; No quiero renunciar
Otros (especificar)
32. Ahora le haremos preguntas sobre sus vacunas personales contra la gripe. Una vacuna
contra la influenza / gripe puede ser una "inyección contra la gripe" inyectada en su brazo
o también el espray "FluMist" que se rocía en su nariz. Durante los últimos 12 meses, ¿se
vacunó contra la gripe o se puso el espray “FluMist? (Elija solo una).
Sí, vacuna contra la gripe
Sí, FluMist

160
Si ambos
No
No sé / no estoy seguro

161
PARTE 5: Acceso a la atención / Salud familiar
33. ¿A dónde va más a menudo cuando está enfermo? (Elija solo uno)
Oficina del doctor
Departamento de salud
Hospital
Clínica Médica
Centro de cuidado urgente
Otros (especificar)
34. ¿Tiene alguno de los siguientes tipos de seguro de salud o cobertura de atención
médica? (Elija todos los que aplique)
Seguro de salud que mi empleador proporciona
Seguro de salud que proporciona el empleador de mi cónyuge
Seguro de salud que mi escuela proporciona
Seguro de salud que proporciona mi padre o el empleador de mis padres
Seguro de salud que compré
Seguro de salud a través del Mercado de Seguros Médicos (Obamacare)
Seguro Militar, Tricare o él VA
Seguro de enfermedad
Seguro médico del estado
Sin plan de salud de ningún tipo

162
35. En los últimos 12 meses, ¿tuvo problemas para obtener la atención médica que
necesitaba para usted o para un familiar de cualquier tipo de proveedor de atención
médica, dentista, farmacia u otro centro? (Elija solo uno)
Sí
No (Si su respuesta es No, salte a la pregunta numero 38)
No sé / no estoy seguro
36. Dado que usted dijo "sí", ¿Con cual tipo de proveedor o institución tuvo problemas
para obtener atención médica? Puede elegir tantos de estos como necesite.
Dentista
Médico general
Cuidado de los ojos /
optometrista / oftalmólogo
Farmacia / recetas
médicas
Pediatra
Ginecologo
Departamento
de salud
Hospital
Centro de atención
urgente
Clínica Médica
Especialista
Otros (especificar)
37. ¿Cuáles de estos problemas le impidieron a usted o a su familiar obtener la atención
médica necesaria? Puede elegir tantos de estos como necesite.
No tiene seguro medico
El seguro no cubría lo que necesitaba

163
El costo del deducible del seguro era demasiado alto
El doctor no aceptaba el seguro ni el Medicaid.
El hospital no aceptaba el seguro.
La farmacia no aceptaba el seguro ni el Medicaid.
El dentista no aceptaba el seguro ni el Medicaid.
No tengo ninguna manera de llegar allí.
No sabía a dónde ir.
No pude conseguir una cita.
La espera fue demasiado larga.
El proveedor me negó atención o me trató de manera discriminatoria debido a mi
estado de VIH, o porque soy lesbiana, gay, bisexual o trangenero.
38. ¿En qué condado se encuentra la mayoría de los proveedores médicos que visita? (Elija
solo uno)
Beaufort
Bertie
Bladen
Brunswick
Camden
Carteret
Chowan
Columbus
Craven
Cumberland
Currituck
Dare
Duplin
Edgecombe
Franklin
Gates
Granville
Greene
Halifax
Harnett
Hertford
Hoke
Hyde
Johnston
Jones
Lenoir
Martin
Moore
Nash
New Hanover
Northampton
Onslow
Pamlico
Pasquotank
Pender
Perquimans
Pitt

164
Richmond
Robeson
Sampson
Scotland
Tyrrell
Vance
Wake
Warren
Washingt
on
Wayne
Wilson
El Estado de
Virginia
Otros (especificar)
Mapa del condado de Carolina del Norte
39. En los últimos 12 meses, ¿alguna vez le preocupó saber si la comida de su familia se
agotaría antes de obtener dinero para comprar más? (Elija solo uno)
Sí
No
No sé / no estoy seguro

165
40. Si un amigo o miembro de la familia necesita asesoría para un problema de salud
mental o de abuso de drogas o alcohol, ¿quién es la primera persona con la que les diría
que hablen? (Elija solo uno)
Consejero o terapeuta privado
Grupo de apoyo
Consejero de la escuela
No sé
Doctor
Pastor o funcionario religioso
Otros (especificar)
PARTE 6: Preparación para emergencias
41. ¿Tiene en su hogar detectores de humo y monóxido de carbono en funcionamiento?
(Elija solo uno)
Sí, solo detectores de humo
Si ambos
No sé / no estoy seguro
Sí, sólo detectores de monóxido de carbono
No

166
42. ¿Su familia tiene un kit básico de suministros de emergencia? (Estos kits incluyen agua,
alimentos no perecederos, cualquier receta necesaria, suministros de primeros auxilios,
linterna y baterías, abrelatas no eléctrico, cobijas, etc.)
Sí
No
No sé / no estoy seguro
En caso que sí, ¿cuántos días tiene suministros? (Escriba el número de días)
43. ¿Cuál sería su forma principal de obtener información de las autoridades en un
desastre o emergencia a gran escala? (Marque solo uno)
Televisión
Radio
Internet
Línea de teléfono en casa
Teléfono celular
Medios impresos (periódico)
Sitio de red social
Vecinos
Familia
Mensaje de texto (sistema de alerta
de emergencia)
No sé / no estoy seguro
Otros (especificar)
44. Si las autoridades públicas anunciaran una evacuación obligatoria de su vecindario o
comunidad debido a un desastre a gran escala o una emergencia, ¿Ustedes evacuarían?
(Elija solo uno)
Sí (Si su respuesta es Sí, salte a la pregunta numero 46)

167
No
No sé / no estoy seguro
45. ¿Cuál sería la razón principal por la que no evacuaría si le pidieran que lo hiciera?
(Marque solo uno)
Falta de transporte
La falta de confianza en los
funcionarios públicos
Preocupación por dejar atrás la
propiedad
Preocupación por la seguridad
personal
Preocupación por la seguridad
familiar
Preocupación por dejar mascotas
Preocupación por los atascos de
tráfico y la imposibilidad de salir
Problemas de salud (no se
pudieron mover)
No sé / no estoy seguro
Otros (especificar)
PARTE 7: Preguntas demográficas
La siguiente serie de preguntas son preguntas generales sobre usted, que solo se informarán
como un resumen de todas las respuestas dadas por los participantes de la encuesta. Tus
respuestas permanecerán en el anonimato.
46. ¿Qué edad tiene? (Elija solo uno)
15-19
20-24
25-29
30-34
35-39
40-44
45-49
50-54
55-59
60-64
65-69
70-74

168
75-79 80-84 85 o más
47. ¿Cuál es tu género? (Elija solo uno)
Masculino
Femenino
Transgénero
Género no conforme
Otro
48. ¿Eres de origen hispano, latino o español? (Elija solo uno)
No soy de origen hispano, latino o español
Mexicano, mexicoamericano o chicano
Puertorriqueño
Cubano o cubano americano
Otro - hispano o latino (por favor especifique)
49. ¿Cuál es su raza? (Elija solo uno)
Blanco
Negro o Afroamericano
Indio Americano o nativo de Alaska
Indio Asiático
Otros- Asiáticos, incluidos Japonés, Chino, Coreano, Vietnamita y Filipino

169
Otros isleños del Pacífico, incluidos los nativos de Hawaii, Samoa, Guamanian /
Chamorro
Otra raza no incluida aquí (especifique)
50. ¿El inglés es el idioma principal que se habla en su hogar? (Elija solo uno)
Sí
No. En caso negativo, especifique el idioma principal que se habla en su hogar.
51. ¿Cuál es tu estado civil? (Elija solo uno)
Nunca casado / soltero
Casado
Pareja- soltera
Divorciado
Viudo
Separado
Otros (especificar)
52. Seleccione el nivel más alto de educación que ha alcanzado. (Elija solo uno)

170
Menos de 9no grado
9-12 grado, sin diploma
Graduado de secundaria (o GED / equivalente)
Grado Asociado o Formación Profesional
Un poco de universidad (sin título)
Licenciatura
Licenciado o título profesional
Otros (especificar)
53. ¿Cuál fue el ingreso total de su hogar el año pasado, antes de impuestos? (Elija solo
uno)
Menos de $10,000
$10,000 a $14,999
$15,000 a $24,999
$25,000 a $34,999
$35,000 a $49,999
$50,000 a $74,999
$75,000 a $99,999
$100,000 o más
54. Ingrese el número de personas en su hogar (incluyéndose a usted)
55. ¿Cuál es su estado laboral? (Seleccione todas las opciones que corresponden).
Empleado de
tiempo completo
Empleado a
tiempo parcial
Retirado
Fuerzas Armadas
Discapacitado
Estudiante

171
Ama de casa
Trabajadores por
cuenta propia
Desempleado 1
año o menos
Desempleado por más de 1
año
56. ¿Tiene acceso al internet es su casa (Esto incluye alta velocidad, wifi, acceso telefónico o datos
móviles)? (Elija solo uno)
Sí
No
No sé / no estoy seguro
57. (Opcional) ¿Hay algo más que le gustaría que sepamos sobre su comunidad? Por favor, siéntase libre
de decirnos a continuación.

172
¡Gracias por su tiempo y participación!
Si tiene preguntas sobre esta encuesta, envíenos un correo electrónico a wil[email protected].

173
Focus Group Questions
Participants’ Resident County(ies):
Focus Group Name / Number:
Date Conducted:
Location:
Start Time:
End Time:
Number of Participants:
Population Type (if applicable):
Moderator Name:
Moderator Email:
Note Taker Name:
Note Taker Email:
Core Questions
1. Introduce yourself and tell us what you think is the best thing about living in this community.
2. What do people in this community do to stay healthy?
Prompt: What do you do to stay healthy?
3. In your opinion, what are the serious health related problems in your community? What are some of the
causes of these problems?
4. What keeps people in your community from being healthy?
Prompt: What challenges do you face that keep you from being healthy? What barriers exist to being healthy?
5. What could be done to solve these problems?
Prompt: What could be done to make your community healthier? Additional services or changes to existing
services?
174
6. Is there any group not receiving enough health care? If so, what group? And why?
7. Is there anything else you would like us to know?
Additional Questions
1. How do people in this community get information about health? How do you get information about health?
2. Have you or someone close to you ever experienced any challenges in trying to get healthcare services? If
so, what happened?
3. What is the major environmental issue in the county?
4. Describe collaborative efforts in the community. How can we improve our level of collaboration?
5. What are the strengths related to health in your community?
Prompt: Specific strengths related to healthcare?
Prompt: Specific strengths to a healthy lifestyle?
6. If you had $100,000 to spend on a healthcare project in the county, how would you spend it?
175
Key Themes
Summarize the top 2-3 themes from this focus group discussion.
1.
2.
3.

176
Appendix D. Community Resources
Bladen County Resource Inventory & Assessment
Available Resources Related to Priority Areas
According to the 2018 CHNA, eight topic areas were identified as leading health concerns in the county:
Exercise, Nutrition, and Weight, Substance Abuse, Maternal, Fetal, and Infant Health, Diabetes, Stroke and
Heart Disease, Prevention and Safety, Access to Health Services, and Economy.
Priority #1: Exercise, Nutrition, and Weight
Ranked as the 14
th
most pressing health need in Bladen County. Indicators included: adults 20+ who are obese, access
to exercise opportunities, child food insecurity rate, and adults 20+ who are sedentary.
As Identified by Healthy People 2020, diet and exercise have an influential impact on the health status of
individuals. In addition many research studies have proven that maintaining a healthy diet and exercising daily
will drastically lower your risk for many chronic diseases. However, there are many social and physical
determinates that play a large role such as: attitudes and norms, culture, social supports, and environment
that create especially difficult barriers to address.
In order to come closer to closing the gaps for creating more exercise opportunities and access for healthier
food options additional resources are needed. The existing programs and services are offered in the county
and are outlined in further detail below.
Resources that address: Exercise, Nutrition, and Weight
4H SNAP-Ed Program/Senior and School Programs
NC State University’s SNAP-Ed Program is “Steps to Health.” The goal of this program is to assist those eligible
for food assistance to eat smart and move more. It is designed for preschoolers all the way up to 3
rd
grade
students, adults, Latino families, and older adults.
Contact: NC Cooperative Extension-Bladen County (910) 862-4591
Supplemental Nutrition Assistance Program (SNAP)
SNAP serves limited resource individuals and families across North Carolina. Amount of
benefits are determined by income, family size, and resource limits.
Contact: Bladen County Department of Social Services (DSS) (910) 862-6800

177
Women, Infant, and Children (WIC)
The WIC Program gives its participants access to a number of resources, including health screenings, nutrition
and breastfeeding counseling, immunization screening and referral, substance abuse referral, and more. WIC
is for children up to age 5, infants, pregnant women, breastfeeding women, and women who have had a baby
in the last 6 months. A person can qualify if they already receive SNAP benefits, are on Medicaid, or meet
income guidelines.
Contact: Bladen County Health Department-WIC (910) 872-6218
Bladen County Parks and Recreation
There are 7 parks in the county, one of which is owned and operated by the
County. A variety of recreation programs are offered all year round to both
youth and adults in the county. In addition, the parks and recreation
department assist the Bladen County 4-H summer programs and offers a
Special Olympics every year in April.
Contact: Bladen County Parks and Recreation Department (910) 862-6770
Health Works Fitness Center
Health Works offers a 24-Hour area that is open 24-hours, 7 days per week. Their main facility is open Monday
– Thursday from 5 a.m. – 8 p.m., Friday 5 a.m. – 6 p.m., Saturday from 8 a.m. – 12 p.m. and Sunday – closed.
The facility offers cardiovascular and weight training equipment, locker rooms, a walking track, group exercise
room, a multi-purpose room that is used for classes, training and hosting special events.
Contact: 910-862-6533
Brown’s Creek Bike Trail
Located in the heart of Elizabethtown, NC is a mountain bike/hiking
trail that stretches 6.4 miles long of scenic hardwood forest and
runs along the beautiful Brown’s Creek.
Contact: Bladen County Parks and Recreation Department (910) 862-6770
Physical Education in NC Schools
North Carolina mandates physical education in grades K-5 and healthful living
education (physical education and health education) in grades 6-12, but it does not
specify required days or minutes per week for elementary or middle schools. The
state also requires one unit of healthful living education for high school graduation
which includes one semester of physical education. Schools are expected to follow
the North Carolina Standard Course of Study for healthful living, which includes
teaching and learning of behaviors that contribute to a healthful lifestyle and
improved quality of life for all students.
Contact: Bladen County Board of Education (910) 862-4136

178
Health Education/Promotions Department
Bladen County Health and Human Services Health Educators are available to provide and
offer educational material, classes and seminars on health related issues. These services
are available to all people and organizations throughout the county. They also plan and
coordinate community events that promote health. In addition, they also promote
programs such as: Faithful Families, Eating Smart Moving More, Walking
Programs, Safe Kids, Healthy Bladen Collaborative, and Health Education Programming.
Contact: Bladen County Health Education Department (910) 862-6900 EXT 5
NC Healthy School CDC Pilot Study
NC Healthy Schools focuses on improving the health of students and staff by providing coordination and
resources within the context of the “Whole School, Whole Community, Whole Child” (WSCC) model. The goal
is to create students who are healthier, in school, in class, and ready to learn. Students who are healthier are
more alert, more focused on learning, and miss less school. They not only learn better in every class, but they
also learn lifelong healthy behaviors.
Contact: Bladen County Board of Education (910) 862-4136
Healthy Bladen Kids Summer Program
This is a program that partners with NC schools After School Feeding program to help give children ages 5-14 a
safe place to get some exercise, learn about age appropriate nutrition by our county Health Educators, and
have a summer camp experience. Site locations are determined based on availability around the County for
children to attend. This is a free program provided by the Parks and Recreation Department. After the
nutrition education is finished a snack is provided to the children.
Contact: Bladen County Parks and Recreation (910) 862-6770
Eat Smart, Move More, Weigh Less
Developed by professionals from North Carolina State University and the NC Division of Public Health this
curriculum is based on the theory of planned behavior. Eat Smart, Move More, Weigh Less is an online weight
management program that uses strategies proven to work for weight loss
and maintenance. Each lesson informs, empowers and motivates
participants to live mindfully as they make choices about eating and physical
activity. It is delivered in an interactive real-time format with a live
instructor. The program is offered to employers and health plans interested
in eating smart, moving more, and achieving a healthy weight.
Contact: Health Promotions Department-Bladen County Health Department
(910) 862-6900 EXT 5

179
Faithful Families: Eating Smart; Moving More
Faithful Families Thriving Communities (Faithful Families) works directly in communities of faith across the
country to promote health for individuals, families, and local communities. The practice-tested program is
open to all faith and religious traditions and engages faith communities in health education, environmental
changes to support health, and community-wide health initiatives.
Contact: Health Promotions Department-Bladen County Health Department
(910) 862-6900 EXT 5
Farmer’s Market
Our county has two farmer’s markets currently, Cape Fear farmer’s market and Bladenboro farmer’s market.
Each sell a variety of produce based on the season. Any and all local farmers can attend to provide their
products for the residents of the county.
Contact: Cape Fear Farmer’s Market (910) 862-2066 & Bladenboro Farmer’s Market (910) 862-3655
Assessment of Needed/Lacking Resources: Exercise, Nutrition, & Weight
Farmer’s markets in other food desert areas of the county
Nutrition education in schools (all ages)
Park or greenway in each community
Youth facilities or recreation centers
Workout facilities in other towns
County registered dietitian
Mandated daily physical activity in school

180
Priority #2: Substance Abuse
From the secondary data, substance abuse was ranked as the 22
nd
most pressing health concern in the
County. The top indicators being: adults who smoke and death rate due to drug poisoning. From the primary
data, substance abuse was ranked as a top concern affecting quality of life where respondents wanted to
learn more about substance abuse prevention.
As identified by Healthy People 2020, Substance abuse-involving drugs, alcohol or both can cause a wide range
of social problems. Because of this, it has been noted as one of the most complex public health issues to
resolve.
In order to come closer to addressing the social complexes that are derived from substance abuse disorders
additional resources are needed. The existing programs and services are offered in the county and are
outlined in further detail below.
Resources that address: Substance Abuse
Opioid Taskforce
This task force consists of collaboration between many different agencies within the community. It was
designed to reduce opioid and heroin addiction, prevent overdose deaths, and improve the quality of life in
our community.
Contact: Coordinator-Charles Ray Peterson (910) 648-4506
Cape Fear Valley Bladen County Hospital
Located in Elizabethtown, is the only hospital in Bladen County. This is a 58 bed facility with a 24 hour
emergency department. It is staffed on a full-time basis with specially trained physicians and nurses. Although
a smaller facility, it is has a 23 bed medical surgical unit and intensive care unit. There are three outpatient
clinics available to the community, Bladenboro, Dublin, and Elizabethtown. Bladen Medical Associates in
Bladenboro and Dublin, Bladen Kids’ Care in Elizabethtown, Women’s Health Specialists in Elizabethtown, and
Bladen Surgical Specialists are all branches and/or satellite locations around the county.
Contact: Cape Fear Valley Bladen County Hospital-General Information (910) 862-5100

181
Cape Fear Teen Challenge
This program is a 12-15 month residential facility for women overcoming life controlling issues such as drugs
and alcohol during which time is spent in Bible study and education. It is our goal to provide a fresh start for
women and enable them to become mentally sound, emotionally balanced, socially adjusted, physically well,
and spiritually alive. The program will provide an opportunity to get away from the negative environment of
the past and allow time to make quality decisions for the future.
Contact: Pastor Holly Loyer (910) 588-4115
Hope 4 NC
A temporary, grant funded agency, set in place to help residents that have been
affected by the recent Hurricanes Matthew and Florence. This agency offers crisis
assistance to disaster survivors in their homes, shelters, temporary living sites, or places of worship. The grant
funding services include: individual crisis counseling, basic supportive or education contact, community
networking and support, assessments, referrals, and resources, development and distribution of educational
materials, and media and public service announcements. Although this agency is used for disaster survivors its
services can also be for residents who are affected by the opioid epidemic.
Contact: RHA-Counselor-Meredith DuBose (910) 739-8849
Coastal Southeastern United Care (CSEUC)
CSEUC is a Critical Access Behavioral Health Agency and is nationally
accredited by the Commission on Accreditation of Rehabilitative Healthcare.
CSEUC offers a continuum of community-based behavioral health and
substance abuse services for adults, adolescents, and children with
significant identified symptoms interfering with their functioning role in
family, school, employment or community. The services they offer:
medication management, psychiatric evaluations, clinical assessment, individual, family, and group therapy,
intensive in-home, community support team, assertive community treatment team, suboxone, buprenorphine
and naloxone treatment, substance abuse comprehensive outpatient treatment (SACOT), and substance abuse
intensive outpatient program (SAIOP)
Contact: Bladen County-CSEUC (910) 862-4000 │Crisis #: (910) 874-6511

182
CommWell Health-Behavioral Health
Behavioral Health Services include: basic outpatient for adults, adolescent
and children over the age of 5, behavioral Health Screenings, psychiatric
care, crisis counseling, referral and consultation, walk‐in services, substance abuse intensive outpatient
program (SAIOP), substance abuse comprehensive outpatient treatment (SACOT), outpatient mental health
and substance abuse, crisis intervention services, 30 to 45 day substance abuse male residential program
(Harvest House) providing residential services to men over 18 for over 25 years, women’s substance abuse
transitional living (Angelic House), and priority admission to residential for IV drug users, women with
dependent children and at-risk persons for HIV.
Contact: CommWell │Tar Heel Location (910) 872-5700
LifeBridge Healthcare
Located in Elizabethtown, NC LifeBridge provides a quality-based treatment service to meet the mental,
physical, developmental, and substance abuse needs of individuals. It is their goal and the pledge of our highly
skilled and experienced staff to provide individualized care with compassion. They are licensed by Eastpointe
and Sandhills MCOs.
Contact: Main Number– (910) 738-7880
Coastal Southeastern Carolina Crossroads
Southeastern Carolina Crossroads is a church organization that provides room and board for rehabilitation
purposes in a group environment. Dedicated solely to men, they have a variety of programs to offer those
struggling with addiction(s). In their programs they teach drug awareness, prevention, and total abstinence
through Jesus Christ and the truths of the Bible.
Contact: (910) 549-8487 or (910) 588-4345
The Carter Clinic
This clinic is specific to mental health and substance abuse treatment. They provide that treatment through
outpatient therapy, individual therapy, medication management, and peer support.
Contact: Raleigh Office │ (919) 848-0132
183
Monarch-Tanglewood Arbor
Tanglewood Arbor is located out of the county in Lumberton, NC. It provides services to anybody needing to
substance abuse therapy. They offer detox, counseling, and in and outpatient services.
Contact: (910) 618-5606
Alcoholics Anonymous (AA) and Narcotics Anonymous (NA)
There are two support groups offered in the county. One is with Open Door Ministries and the second is with
Elizabethtown Presbyterian Church.
Contact:
Elizabethtown Presbyterian Church (910) 862-3736 OR Open Door Ministries (910) 862-1566
Community Care of the Lower Cape Fear, Bladen County Access III
Community Care of the Lower Cape Fear is a regional network of nearly 192 primary and OB care practices,
hospitals, health departments, departments of social services, and other agencies and organizations,
including Trillium and Eastpointe MCOs and South East AHEC ("SEAHEC"). These professionals work together
to provide cooperative, coordinated care through the Medical Home model. This approach matches each
patient with a primary care provider who leads a health care team to address the patient’s unique health
needs. CCLCF care managers provide services to high-risk patients to improve self-management of chronic
health conditions.
Contact: 1-800-953-0203 or (910) 763-0200

184
Eastpointe Mental Health
Eastpointe is a managed care organization (MCO) dedicated to working with individuals and families in eastern
North Carolina who struggle with substance abuse, mental health and intellectual and developmental
disabilities. In partnership with community agencies, licensed independent
practitioners and hospitals, we help the uninsured and those on Medicaid
get comprehensive, effective treatment that is essential for their well-
being.
Contact: 1-800-913-6109
Monarch
Monarch provides behavioral health services that cover mental health services and substance use disorders to
people who need it, when they need it. Some services they offer: crisis services, enhanced services, outpatient
services, residential options, stanly certified community behavioral health clinic, and service locations.
Contact: (866) 272-7826 or (910) 863-4137
Community Support Agency
Community Support Agency provides behavioral health services to children,
adolescents and adults with mental health, developmental disabilities and/or
substance abuse needs. Individuals have prompt access to services and resources
within their community to support them in achieving their identified (personal,
social, and health) goals.
Contact: Delco│ (910) 655-0698 or Whiteville│ (910) 207-6761
RHA Health Services
RHA offers a comprehensive range of services and supports for people of all ages with developmental
disabilities and/or behavioral health concerns. Some of the health services they
provide: community living services, community specialty programs, outpatient
based services, crisis services, and transitional services.
Contact: (910) 640-1400

185
Assessment of Needed/Lacking Resources: Substance Abuse
Support groups for non-medication assisted treatment patients
Support groups for medication assisted treatment patients
Counselors/therapists in the county
Detoxification and inpatient recovery facilities
New/Emerging Issue: Maternal, Fetal, and Infant Health
From the secondary data, maternal, fetal, and infant health was a top leading health concern for the county. Top
indicators included: babies with a very low or low birth weight, and babies born preterm.
According to Healthy People 2020, maternal, fetal and infant healths are all leading
concerns for the United States. Their well-being determines the health of the next
generation and can help predict future public health challenges for families,
communities, and the health care system. Like many other public health
topics/concerns, the health of mothers and their offspring is largely influenced by
socioeconomic factors and genetics. Nonetheless, many of these uncontrollable
influences can be reduced by increasing access to quality preconception, prenatal,
and interconception care. Further, having continuous care for mom and baby can
elicit early detection and treatment of developmental delays and disabilities can
prevent death/disability to enable children to reach their full potentials.
Resources that address: Maternal, Fetal, and Infant Health
Women’s Health Specialist-Bladen County
An extension of Cape Fear Valley Hospital, this clinic offers general and high-risk obstetric care and
gynecology. It is located in Elizabethtown, NC.
Contact: (910) 862- 6672 or
24-Hour Nurse Hotline: Toll Free- (888) 728-9355

186
Bladen County Health Department-Maternal Health
This clinic provides quality prenatal care, counseling, and education to expectant women
in the county.
Contact: Bladen County Health Department (910) 862-6900
Bladen County Health Department-Obstetrics Case Management (OBCM)
This program is for Medicaid-eligible pregnant women through a pregnancy risk screening done by your
medical provider. OBCM focuses on pregnant women who have a history of complicated pregnancies and/or
are affected by socioeconomic factors that influence pregnancy outcomes.
Contact: Bladen County Health Department (910) 862-6900
Bladen County Health Department-Family Planning Clinic
This clinic is for women of childbearing age who want to help in planning their
pregnancies and/or in limiting the number of pregnancies.
Contact: Bladen County Health Department (910) 862-6900
Bladen County Health Department-Child Health Clinic
This clinic provides well-child health screenings up to age 18. It also provides
physicals for pre-schoolers and kindergarteners
Contact: Bladen County Health Department (910) 862-6900
Cape Fear Valley-Bladen Kids’ Care
This clinic offers high quality medical care to children, from newborns through
adolescents.
Contact: (910) 862-8677
187
Assessment of Needed/Lacking Resources: Maternal, Fetal, and Infant Health
OB/GYN doctors in the county
Pediatricians in the county
Support groups for breastfeeding
Support groups postpartum depression sufferers
Counseling/therapist services for postpartum depression

188
Appendix E. Priority Setting Process
There were two priority setting meetings conducted in order to determine the selected priorities for Bladen County.
These priorities were derived from the list of the top 8 identified health concerns.
Both the consequences of not addressing, and the feasibility of us doing something about these areas of concern, were
discussed in detail. The feedback of our discussions is represented below.
Notes from the Priority Meetings by topic:
The following are the top 8 identified health concerns from the statistical data and the survey data from the citizens in
our current CHA/CHNA.
DIABETES
Consequences
Feasibility
Children
Diabetes Education
Heart disease
Support Groups
Stroke
Free A1C Testing $$$
Loss of Limbs
Pre-Diabetes Education
Vision
Increased Healthcare costs
Loss of Work Days
Death
*Diabetes was ranked as the #5 cause of death in Bladen (2014-2016, CDC). 15% of Community survey participants
reported being told by a medical professional that they have Diabetes. 50% have been told that they were overweight
and obese.
Chosen-Priority #1: Exercise, Nutrition, and Weight
EXERCISE, NUTRITION, AND WEIGHT
Consequences
Feasibility
Obesity
Lunch and Learns
Diabetes
Community Programs
Heart Disease/Stroke
4H SNAP/Senior and School Program
Joint Issues
Fruit and Vegetable Grant for School
Parks and Recreation
Fitness Center
Bike Trail
P.E. in Schools
Community Walk/Run Events
NC Healthy School CDC Pilot Study
Dr. Offices/Talk to Providers about what they
see.
*Ranked as the 14
th
most pressing health need in Bladen County. Indicators included: Adults 20+ who are obese, access
to exercise opportunities, child food insecurity rate, and Adults 20+ who are sedentary.

189
Chosen-Priority-New and Emerging Issue:
Maternal, Fetal, and Infant Health
MATERNAL, FETAL, AND INFANT HEALTH
Consequences
Feasibility
Baby’s Health
Death
Mother’s Health
Depression/Mental Health
Financial
Substance Abuse
Learning Disabilities
Behavioral Component for Children
No place to Deliver in the County
March of Dimes Program
Family Planning
Mental Health/Substance Abuse Services
CC4C-Care Coordination for Children
OBCM-OB Case Management
Pediatricians
*12.9% of babies are born preterm in Bladen County, which does not meet the Healthy People 2020 goal. Babies born
with low birth weight are on the rise with a rate of 10.2.
HEART DISEASE AND STROKE
Consequences
Feasibility
Obesity
Diabetes
Children
Heart disease
Stroke
Increased Healthcare costs
Loss of Work Days
Death
Prevention Education
Screenings (Free)
Incentives to do healthy activities
$ Money
*Heart Disease is the #1 leading cause of death in Bladen County as of (2014-2016, CDC source).

190
PREVENTION AND SAFETY
Consequences
Feasibility
Increased deaths due to:
-firearms
-poisonings (unintentional)
-drug poisonings
Increased Hospital Visits
Safe Kids Program
Housing Authority (tobacco cessation)
Gun Safety Education:
-gun locks
-wildlife/hunter safety
OMD/DEA Medication Takeback events
Medication Lock Boxes/Pill Disposal
Educational Programs:
-diet/exercise
Cape Fear Valley Tobacco Free Campus
(1/2019)
*The death rate due to unintential poisoning does not meet the Healthy NC 2020 goal of 9.9 deaths per 100,000
population. Bladen County has a rate of 20.9 according to the 2013-2015 data, against the NC rate of 12.9.
ECONOMY
Consequences
Feasibility
Population Decrease
Older/elderly county (no jobs)
No growth
Unwillingness to be open minded
Facilities suffer:
-lack of new parks/YMCA
No $ for incentives for providers to move to
this area
Income affects growth
Increase minimum wage
(state level policy driven)
Work with colleges on Economic Dev.
High School/Early College
NC Works Career Coach
Add parks in other areas of county
Career/College Day (high schools)
Provide incentives for college
Interns/Job Shadowing
Town/Municipality Grants
Addressing Severe Housing Problems
(providing/building shelters)
* From the secondary data scoring results, Economy was the 9th most pressing health need in Bladen County
with a score of 1.94. According to the data, both poverty and the economy were the top issues in Bladen County
that negatively impact quality of life.

191
ACCESS TO HEALTH SERVICES
Consequences
Feasibility
Unnecessary hospital visits
Lack of primary care providers
Lack of folks insured
Sicker population
Decrease in preventive visits
Children over 5 Years of age lack:
-check-ups (can catch preventive health
problems)
Urgent care costs more than ER
Can’t afford deductibles/insurance costs
Fear of denial of medical treatment
Increase provider/population ratio
(medicare population-hospital visits)
Providing transportation
Routes/public transits
Mobile health clinics/satellite locations
Dental clinics (mobile) free services
Comwell health offers free dental clinic
Special needs
*Preventable hospital stays are a concern for the Medicare population in Bladen County with a value of 80.5 discharges
per 1,000 Medicare enrollees.
Chosen-Priority #2: Substance Abuse
SUBSTANCE ABUSE
Consequences
Feasibility
loss of jobs
loss if family/friends
weight/dental health
financial reduction
death
dependence
EMS-Answering overdoses
Increased jail time/crime associated
Child neglect/poisoning
Pregnancy/infant mortality
Disabilities
Narcan being used along with drugs
Increase Treatment Facilities
Getting people to get treatment
Creating more support groups:
-lack of therapists/counselors
Educating Community
Pharmacy Naloxone Distribution
Community Involvement:
-providers & pharmacists
Lock boxes and Pill Dispensing
Pain Management Education
Increase Drug Screenings
Student Forums
Syringe Exchange
Offer medication disposal bags w/ Rx.
* From the secondary data scoring results, Substance Abuse was the 22
nd
most pressing health need in Bladen
County. Community survey participants ranked substance abuse (25.7%) as a top issue affecting quality of life in
Bladen County.

192
Appendix F. Bladen County Industry List
Aramark Uniform Services
Uniform Distribution
9 employees - Opened 2003
370 Suite A Ben Greene Industrial Park Road
Elizabethtown, NC 28337
Phone: 910-862-3471
Birdsong Peanut Corporation
Peanuts
4 Fulltime, 20 seasonal employees- Open September 2007
P O Box 640/ 876 J.R. Britt Road
Bladenboro, NC 28320
Phone: 910-648-5571
Cape Fear Vineyard and Winery, LLC
195 Vineyard Drive
Elizabethtown, NC 28337
Phone: 910-645-4291
Cape Fear Chemicals, Inc.
Lawn, Garden, and Home Chemical Products
12 employees - Opened 1949
P.O. Box 695/ 4271 US Hwy 701 S.
Elizabethtown, NC 28337
Phone: 910-862-3139
Carolina Blueberry Association
Packing and Shipping Blueberries
5 Fulltime, 55 Seasonal employees - 1941
P.O. Box 368/ 11421 Hwy 701 N
Garland, NC 28441
Phone: 910-588-4220
Carolina Retread, LLC
Tire Retreading Services
16 employees- Opened 2009
213 W. Green St.
Clarkton, NC 28433
Phone: 910-647-0174
Carrol Poultry, LLC
Poultry Processing
73 employees- Opened November 2017
414 Industrial Drive
Bladenboro, NC 28320
Chemours
Performance Chemical Company
290 employees- Opened 2015 ( formed from Dupont)
22828 NC 87 Hwy W
Fayetteville, NC 28306
Phone: 910-483-4681

193
Clarkton Cotton Company
Cotton Ginning
5 employees - Opened 1991 (4 FT, 1 PT)
P.O. Box 36
Clarkton, NC 28433
Phone: 910-647-5521
C.R. England Transportation
Truck Leasing
25 employees - Opened 1992
16491 NC Hwy 87 W
Tar Heel, NC 28392
Phone: 910-862-6000

194
Appendix G. Educational System Resources
PUBLIC SCHOOLS:
Bladen Early College High School
Grades 9 - 12
910-876-6654
7418 NC Highway 41 West, Parker Building
Dublin, NC 28332
https://www.bladen.k12.nc.us/bechs
Bladen Lakes Primary School
Grades PreK - 4
910-247-4608
9554 Johnsontown Road
Elizabethtown, NC 28337
https://sites.google.com/a/bladen.k12.nc.us/bladen-lakes-primary/
Bladenboro Middle School
Grades 5 - 8
910-863-3232
910 South Main Street
Bladenboro, NC 28320
https://sites.google.com/a/bladen.k12.nc.us/bladenboro-middle-school/
Bladenboro Primary School
Grades PreK - 4
910-863-3387
312 Old Whiteville Road / P.O. Box 820
Bladenboro, NC 28320
https://sites.google.com/a/bladen.k12.nc.us/bladenboro-primary-school/
Clarkton School of Discovery
Grades 5 - 8
910-647-6531
10000 North College Street
Clarkton, NC 28433
https://sites.google.com/a/bladen.k12.nc.us/clarkton-school-of-discovery/

195
Dublin Primary School
Grades PreK - 4
910-862-2202
7048 Albert Street / P.O. Box 307
Dublin, NC 28332
https://sites.google.com/a/bladen.k12.nc.us/dublin-primary-school/
East Arcadia School
Grades PreK - 4
910-247-4609
21451 NC Highway 87 East
Riegelwood, NC 28456
https://sites.google.com/a/bladen.k12.nc.us/east-arcadia-school/
East Bladen High School
Grades 9 - 12
910-247-4610
5600 NC Highway 87 East / P.O. Box 578
Elizabethtown, NC 28337
https://sites.google.com/a/bladen.k12.nc.us/east-bladen-high/
Elizabethtown Middle School
Grades 5 - 8
910-862-4071
1496 Highway 701 South / P.O. Box 639
Elizabethtown, NC 28337
https://sites.google.com/a/bladen.k12.nc.us/elizabethtown-middle-school/
Elizabethtown Primary School
Grades PreK - 4
910-862-3380
301 Mercer Brown Road / P.O. Box 2649
Elizabethtown, NC 28337
https://sites.google.com/a/bladen.k12.nc.us/elizabethtown-primary-school/
Plain View Primary School
Grades PreK - 4
910-862-2371
1963 Chicken Foot Road
Tar Heel, NC 28392
https://sites.google.com/a/bladen.k12.nc.us/plain-view-primary/

196
Tar Heel Middle School
Grades 5 - 8
910-862-2475
14888 NC Highway 87 West / P.O. Box 128
Tar Heel, NC 28392
https://sites.google.com/a/bladen.k12.nc.us/tar-heel-middle-school/
West Bladen High School
Grades 9 - 12
910-862-2130
1600 NC Highway 410
Bladenboro, NC 28320
https://sites.google.com/a/bladen.k12.nc.us/west-bladen-high-school/
CHARTER SCHOOLS:
Emereau Bladen Charter School
Grades K-8
910-247-6595
995 Airport Rd
Elizabethtown, NC 28337
https://www.emereau.org/
Paul R. Brown Leadership Academy
Grades 6-12
910-862-2965
1360 M.L.K. Drive
Elizabethtown, NC 28337
http://www.paulrbrownleadership.com/
PRIVATE SCHOOLS:
Elizabethtown Christian Academy
Pre K-10
910-862-3427
1800 West Broad Street
Elizabethtown, NC 28337
https://www.elizabethtownchristianacademy.org/

197
Community Baptist Academy
Pre K-12
910-863-4320
3107 NC 410 Hwy
Bladenboro, North Carolina 28320
COLLEGES:
Bladen Community College (Main Campus)
910-879-5500
7418 NC Hwy 41W | P.O. Box 266
Dublin, NC 28332
http://www.bladencc.edu/
Bladen Community College (East Arcadia Center)
910-655-5770
1472 East Arcadia Road
Riegelwood, NC 28456
http://www.bladencc.edu/campus-resources/east-arcadia-campus/

198
Thank you for viewing our
2018
Bladen County
Community Health Needs Assessment
2018
___________________________________
Bladen County
Community
Health Needs
Assessment
