
K.7
Monetary Policy Uncertainty
Husted, Lucas, John Rogers, and Bo Sun
International Finance Discussion Papers
Board of Governors of the Federal Reserve System
Number 1215
October 2017
Please cite paper as:
Husted, Lucas, John Rogers, and Bo Sun (2017). Monetary
Policy Uncertainty. International Finance Discussion Papers
1215.
https://doi.org/10.17016/IFDP.2017.1215

Board of Governors of the Federal Reserve System
International Finance Discussion Papers
Number 1215
October 2017
Monetary Policy Uncertainty
Lucas Husted, John Rogers, and Bo Sun
NOTE: International Finance Discussion Papers are preliminary materials circulated to
stimulate discussion and critical comment. References in publications to International
Finance Discussion Papers (other than an acknowledgment that the writer has had access
to unpublished material) should be cleared with the author or authors. Recent IFDPs are
available on the Web at https://www.federalreserve.gov/econres/ifdp/. This paper can be
downloaded without charge from Social Science Research Network electronic library at
http://www.sssrn.com.

Monetary Policy Uncertainty
∗
Lucas Husted
Columbia University
John Rogers
Federal Reserve Board
Bo Sun
Federal Reserve Board
∗
We thank workshop participants at the Bank of England, Central Bank of Ireland, Federal Reserve Board,
Georgetown University, Hong Kong Monetary Authority, International Monetary Fund, Notre Dame, UNC-
Chapel Hill, Oxford-FRBNY conference on Monetary Economics, and FRB-Chicago System Committee Meeting
on Macroeconomics. We thank Scott Baker, Nick Bloom, and Steve Davis for hosting our index on their Economic
Policy Uncertainty website. The views expressed here are solely our own and should not be interpreted as reflecting
the vie w s of the Board of Governors of the Federal Reserve System or of any other person associated with the
Federal Reserve System.
Monetary Policy Uncertainty
Abstract
We construct new measures of uncertainty about Federal Reserve policy actions and their con-
sequences — monetary policy uncertainty (MPU) indexes. We show that, under a variety of
VAR identification schemes, positive shocks to uncertainty about monetary policy robustly raise
credit spreads and r educe output. The effects are of comparable magnitude to those of conven-
tional monetary policy shocks. We evaluate the usefulness of our MPU indexes, and examine
the influence of Fed communicatio n. Our analysis suggests that policy rate normalization that
is accompanied by reduced uncertainty can help neutralize the contractionary effects of the rate
increases themselves.
Keywords: Monetary policy uncertainty, VAR identification, FOMC communication
JEL Cl assifications: E40, E50 .

1 Introduction
As the Federal Reserve poised itself in 2015 to lift off from the zero interest rate policy in
place since 2008, the intentions of monetary policymakers and t he effects of their a ctio ns once
again faced increased scrutiny. Reflecting this monetary policy mise-en-scene, the Financial
Times proclaimed on the day after the Octo ber 2015 Federal Open Market Committee (FOMC)
meeting, “Fed Speaks Plainer English on Rates: A clearer marker has been laid down fo r a
December increase, though divisions remain.” In December 2015, the Federal Reserve lifted the
policy r ate o ff its effective lower bound in a 25 basis point hike that has been repeated four
times since. Although the December 2015 Fed liftoff removed the prevailing uncertainty about
when the Fed would finally raise rates, it is less clear more generally what effect liftoff had on
uncertainty a bout monetary policy, including its transmission (Brainard (2017)). Estimating the
transmission of shocks to monetary policy uncertainty is the focus of this paper.
Recently, there has been a surge of interest in economic policy uncertainty.
1
Baker, Bloo m,
and Davis (2016) develop an index of overall economic policy uncertainty (EPU), including fiscal,
monetary, trade, healthcare, national security, and regulatory p olicies, based on the occurrence of
certain keywords in newspaper coverage. The existing literature on monetary policy uncertainty
per se predominantly utilizes market-based proxies such as implied volatility computed from
interest rate option prices and realized volatility computed from intraday prices of interest rate
futures (Neely (2005) , Swanson (2006), Ba uer (2012), and Chang and Feunou (20 13)).
2
As made
evident below, our measure is complementary to these derivative-based measures but differs in
three important dimensions, because the market-based measures: (1 ) reflect the perception of
only the households participating in the o pt ions market, (2) may have a compo nent driven by
time-varying risk aversion and/or state-dependent marginal utility rather than uncertainty and
(3) are essentia lly all ab out (policy) interest rate uncertainty. Our ana lysis suggests that there
exists a significant degree of uncertainty abo ut monetary policy beyond interest rate fluctuations.
3
1
See references at http://www.policyuncertainty.com/research.htm, as well a s Fischer (2017).
2
Carlson, Craig and Melick (2005) and Emmons, Lakdawala and Neely (2006) go beyond implied volatility
and extract the option-implied probability distribution of future policy rates using federal funds futures options.
3
A related set of papers develops various aspects of uncertainty concerning government policy: Justiniano and
Primiceri (20 08), Bloom (2009 ), Rubio-Ramirez, and Uribe (2 011), Stock and Watson (2012), Bachmann, Elstner,
and Sims (2013), Born, Peter, and Pfeifer (2013), Fernandez-Villave rde, Guerron-Quintana, Kue ster, and Rubio-
Ramirez (20 13), Fernandez-Villaverde, Guerron- Quintana, Nakamura, Sergeyev, and Steinsson (2014), Orlik and
Veldkamp (2014), Creal and Wu (2016), Shoa g and Veuger (201 5), Jurado, Ludvigson, and Ng (2015), and Enge n,
Laubach, and Reifschneider (2015).
1

Our paper is also related to a rapidly g r owing literature using textual analysis to measure
economic variables. The news-based search has been recently adopted to construct new measures
for a br oad economic policy index (Baker, Bloom, and Davis ( 2016)), partisan conflict (Azzi-
monti (2017)), geopolitical risk (Caldara and Iacoviello ( 2017)), and corporate news.
4
A number
of papers use var iables generated from publicly released FOMC document s to study FOMC com-
munication, including Boukus and Rosenberg (2006), Ehrmann and Fratzscher (2007), Meade
and Stasavage (2008), Schonha r dt-Bailey (2013), Acosta and Meade (2014), and Acosta (2015).
We update some of these measures. Our paper suggests that text searches can deliver useful
proxies of uncertainty tracing back decades.
Specifically, we do three things in this paper. First, we construct a news-based index of
monetary policy uncertainty to capture the degree of uncertainty that the public perceives about
central bank policy actions and their consequences. We follow the approach in Baker, Bloom,
and Davis (2016), and highlight some important advantages of ours. We also detail our “human
audit” that assesses the accuracy of our construction approa ch. We focus on the Fed starting in
1985.
5
As documented below, large spikes occurred around the September 11 attacks, the March
2003 invasion of Iraq, prior to the October 2015 FOMC meeting when “liftoff uncertainty” seemed
to have peaked, Br exit, and the November 2016 elections.
Second, we evaluate the role of MPU in the monetar y policy transmission mechanism, esti-
mating the effect of shocks to monetary policy uncertainty in VARs utilizing several different
approaches to identification. We examine cases in which the identified MPU shock is by construc-
tion orthogonal to monetary policy shocks. We find that positive shocks to MPU raise credit
spreads and lower output with about the same dynamic pattern as contractionary monetary
policy shocks found in, e.g., Gertler and Karadi (2015).
Last, we provide further discussion that facilitates a better understanding of what our MPU
index captures. We examine co-movements of our index with several alternative proxies. Ours
fluctuates substantially during the period when policy rates were at the effective lower bound,
unlike most competing measures. We investigate whether our MPU index is influenced by insti-
tutional measures of central bank po licy actions such as voting behavior and newly-constructed
4
For example, Davis, Piger, and Sedor (2006), Tetlock (2007), Engelberg (2008), Tetlock, Saar-Tsechansky
and Macskassy (2008), Demer s and Vega (2010), Hoberg and Phillips (2010), Feldman, Govindaraj, Livnat and
Segal (2010), and Loughran and McDonald (2011).
5
In Husted, Rogers, and Sun (2016b), we construct these indexes for the EC B and central banks of Canada,
England, and Japan.
2

measures of FOMC communication. We wrap up by linking the discussion to the related theo-
retical literature.
2 Measuring Monetary Policy Uncertainty
2.1 Construction
Our a pproach to constructing the MPU index is to track the frequency of newspaper articles
related to monetary policy uncertainty. Using the ProQuest Newsstand and historical archives,
we construct the index by searching for keywords related to monetary policy uncertainty in maj or
newspapers. We search for articles containing the triple of (i) “uncertainty” or “uncertain,” (ii)
“monetary policy(ies)” or “interest rate(s)” or “Federal fund(s) rate” or “Fed fund(s) rate,” and
(iii) “Federal Reserve” or “the Fed” or “Federal Open Market Committee” or “FOMC”. We do
this for every day’s issue of the Washington Post, Wall Street Journal, and New York Times.
Importantly, we control for the changing volume of total news a rticles over time and the
possibility that some newspapers naturally cover mo netary policy more than others by first
dividing the raw count of identified articles by the total number of news articles mentioning
“Federal Reserve”, or more pr ecisely, any of the words in category (iii), for each newspaper in
a given period. This scaling choice also helps address issues related to time-varying popula rity
and increased coverage of the Fed due t o improved tr ansparency in its communication strategy.
The share of articles is subsequently normalized to have a unit standard deviation for each
newspaper over the sample period. Each of our monetary policy uncertainty indexes is aggregated
by summing the resulting series and scaling them to have a mean of 100 over the sample. We
construct the index at both a monthly frequency a nd a meeting-interval frequency.
We display o ur baseline MPU index in Figure 1. The sample is January 1985 to May 2017.
The index spikes not ably toward the end, especially ar ound the Brexit vote, as well as at the time
of Black Monday, t he September 11 attacks, the March 2003 invasion of Iraq, the lead-up to the
global financial crisis, the Ta per Tantrum, and prio r to the October 2015 FOMC meeting (when
“liftoff uncertainty” seemed to have peaked). Our index thus fluctuates substantially during the
period the Federal Funds ra t e was at the zero lower bound.
6
6
Consistent with the larg e spike in March 2003, Bernanke (2015) recalls, “U.S. forc es had invade d Iraq a few
days before the (March 2003) meeting. Businesses and hous eholds were reluctant to invest or borrow until they
saw how the invasion would play out. My c olleagues and I were also uncertain about the economic consequences of
the war, especially its effect o n energy prices. At Greenspan’s urging, we decided to wait before considering further
3

We examine the sensitivity of our baseline index by considering several adjustments t o its
construction. In one refinement, we na r row our search to articles in which the word uncer-
tainty/uncertainties is in close proximity to Federal Reserve or monetary policy. Specifically,
we restrict “uncertainty” or “uncertaint ies” to be within either 5, 10, or 20 words of the phrase
“Federal Reserve” or “The Fed” or “monetary policy.” In order to better understand the trade-
offs associated with using the proximity refinement and as part of a more general auditing o f our
automated search, we extracted and read a randomly selected sample of the search results (see
Appendix A). The proximity search does appropriately filter out articles that mention all the
keywords but do not really discuss monetary policy uncertainty per se.
7
The t rade-off, however,
is that the proximity search misses articles that discuss issues related to monetary policy uncer-
tainty but have a somewhat large gap between keywords.
8
We conclude from these readings that
the proximity search has smaller type II error but greater type I error relative to the baseline
strategy, as it filters out more of both “false” articles a nd “correct” articles. The correlat ion
between the baseline index and that constructed using the 10-word proximity search is 0.83 ( see
Husted, Rogers, and Sun (2016a)).
2.2 Human auditing
To address concerns about automated news-based computer search, we conduct an audit based on
human readings. We begin by reading and coding rando mly-selected 6000 articles and construct a
human index based on the share of articles discussing high or rising monetary policy uncertainty.
To concentrate on a r ticles that are likely relevant, the r andom samples we draw a r e from the
set of articles that meet our criterion (iii), that is, containing “Federal Reserve” o r “t he Fed”
or “Federal Open Market Committee” or “FOMC”. We compare the evolution of t he human
index with the computer-automated index, including calculating the Type II error rate. We also
cha r acterize t he nature of monetary policy uncertainty, quantifying the number of articles on
action. In our post-meeting sta tement, we said uncertainty was so high that we couldn’t usefully characterize
the near-term course of the econo my or monetary policy. That unprecedented assertion probably added to the
public’s angst about the economy.”
7
For example, in articles tha t mention monetar y p olicy or interest rate, “uncertainty” shows up in sentences
like the following: “Concerns over Europe have also intensified, as political upheaval has bred uncertainty over
whether the euro zone will be able to implement controver sial austerity measures.”
8
With our 10-word search, for example, an article with the following sentence was not counted: “That the
Fed can, if it chooses, intervene witho ut limit in any credit market — not only mortgage-ba cked securities but
also securities backed by automobile loans or student loans — creates more uncertainty and raises questions
about w hy an independent agency of government should have such power.”
4

uncertainty concerning Fed actions versus uncertainty about the consequences of those actions.
We then read an additional 1500 randomly-selected articles contained in our computer-automated
MPU index in order to estimate the Type I error rate associated with our baseline MPU index.
Our MPU index shows a remarkably high correlation with the index constructed by human
intelligence, and its Type I and Type II error rates are reasonably small and do no t exhibit large
time-series variation.
2.2.1 A human index
Each mont h the newspapers used to construct our MPU index contain 30,000 articles. O f these,
0.17% meet our computer-automated criteria to be included in the MPU index. We la bel this
set (M). In constructing our human index, we restrict our reading to articles containing one of
the category (iii) words: “Federal Reserve” or “the Fed” or “Federal Open Market Committee”
or “FOMC”. This set, labelled (E), accounts for about 2% of the universe of newspaper articles.
We choose this set (E) to draw articles from because (i) a pilot audit (human reading of 300
articles) suggests that the ment ion of Fed is at the heart of relevant discussions, significantly
more so than the mention of monetary policy, for example; and (ii) the human index can also be
normalized in a way consistent with the computer-generated index, i.e., scaled by the number of
articles in set E, which could help minimize the effect of sampling uncertainty.
We randomly select about 5% of the newspaper ar ticles in set E and read the full text of each
of these 6000 articles.
9
Following a detailed a uditing guideline, we use t ext analytic techniques to
identify phrases that likely indicate true positives as well as those that are likely associated with
false positives. We repeat this process and refine the search words until additional adjustments
bring only minor improvements in the error rates (detailed below). For example, although in
some instances articles use words such as “anxiety” and “fear” to discuss uncertainty related to
monetary policy, including these additional words in the search also generates additional fa lse
positives, which o n balance does not improve our index.
10
9
For details of our sampling technique, please see our audit guide available at:
https://sites.google.com/site/bosun09/monetary-policy-uncertainty-index.
10
In our pilot human audit, we notice d fo r instance that articles in the 1980s and early 1990s use “discount
rate” to refer to the monetary policy instrument, while such reference diminished completely in recent years. In
addition, we see some articles using words such as “anxiety” and “fear” to discuss uncertainty related to monetary
policy. With this in mind, we produced an “MPU 2.0” adding the following words in categ ory (i) of our search:
concern(s), or concerned or fear(s) or nervous or worry (worries) or spec ulate(s) or sca re(s) or scared. We also
added a proximity co nstraint that word(s) in category (i) must be within 10 words of those in category (ii) or
(iii). MPU 2.0 shows a significantly lower correlation with the human index than does o ur baseline index.
5

An article is coded as 1 if it contains references to hig h or rising uncertainty in monetary
policy actions and/or their consequences. Articles are coded as -1 if they contain references to low
or declines in such uncertainty, and 0 if the article contains no references to relevant uncertainty.
About 26 percent of the articles in set E are coded as 1 from our reading.
11
Figure 2 displays
the human index against the computer-generated MPU index. The correlation is high, at 0.84.
2.2.2 The nature of monetary policy uncertainty
In the second stage of our audit, we randomly select 1500 articles from those contained in our
MPU index. This accounts for over 10% of set M. Among those articles that are coded as 1,
we code an article as “A” if the discussion p ertaining to monetary policy uncertainty is on the
Fed’s actions a nd as “B” if on the consequences of the Fed’s actions. When an article discusses
both, it is coded as “A a nd B”. We find that our index mainly captures uncertainty about
the Fed’s actions: among the true p ositives, only 10.6% are about consequences of Fed actions
(including the ones on both actions and consequences). The remainder are about uncertainty
concerning Fed actions themselves. During the earlier part of the Zero Lower Bound period
(ZLB), newspaper ar ticles were mostly discussing uncertainty about economic implications of
ZLB, while uncertainty about Fed actions took center stag e in the 2013 Taper Tantrum and in
the second half o f 201 5.
2.2.3 Typ e I vs Type II error
To furt her evaluate the statistical properties of our MPU index, we analyze the rate of Type I
(false po sitives) and Type II (false negatives) errors. From our sample reading of (1500) articles
belonging to the benchmark, computer-generated MPU index, about 85 percent a r e classified as
mentioning high or rising uncertainty related to monetary policy, judged by human intelligence.
The month-to-month variation of this fraction of false positives is minimal, alleviating concerns
about time-varying bia ses. One might be particularly concerned about articles on low o r declining
monetary policy uncertainty getting included in the MPU index. In our sample, only 3.7% of
the articles in set M (those included in t he computer-generated MPU index) discuss falling
uncertainty. Figure 3 shows the time-series variation in the Type I error rate. The error rate
is quite flat, and clearly uncorrelated with our MPU index itself or with other macroeconomic
11
Human reading is done either by one of the authors or a Fed research assistant.
6

variables.
Given the time-varying writing styles in newspapers, we are mindful that the ratio of false
negatives could also vary systematically over t ime. We thus calculate the Type II error every
month as follows. We first identify the articles in our sample o f set E tha t would be included in
the computer-automated index (set M, which is a strict subset of E) , i.e., containing the triple of
key words we search for. In the remaining sample (set E − M), we count the number of articles
that contain r eferences to high or rising monetary policy uncertainty, which gives us the Type
II error rate. Our Type II error rate is on average 0.24 per year, with a standard deviation of
0.05. This indicates that false negatives are also not a major concern for our index. Figure 4
plots the Type II error rate, which is also very flat and uncorrelated with our MPU index and
other macroeconomic indicators.
3 Response of MPU t o Mo netary Policy Shocks
To set the stage for studying the transmission of monetary policy uncertainty shocks, we begin
by estimating the effects of monetary policy shocks. This provides a benchmark f or gauging the
importance of MPU shocks. Our strategy is t o take a VAR model t hat is considered conventional
in the literature and add MPU to it (see Ramey (2015) for a recent review). Since o ur sample
period includes the ZLB, our disturbances of interest also include shocks to forward guidance.
Thus, we choose as benchmark Gertler and Karadi (2015) (hereafter GK) and fo llow them in
undertaking a high frequency identification of the policy shocks.
12
.
Let Y
t
be a vector o f economic and financial var iables, A and C
j
∀j ≥ 1 conformable coeffi-
cient matrices, and ǫ
t
a vector of structural shocks. The general structural form of the VAR we
consider is given by
AY
t
=
X
j
C
j
Y
t−j
+ ǫ
t
(1)
Multiplying each side by A
−1
yields the reduced form VAR
12
In their abstract, GK note of their findings, “Shocks produce responses in output and inflation that are typical
in monetary VAR analysis”. See also Stock and Watson (2012) and Rogers, Scotti, and Wright (2016) (RSW).
7
Y
t
=
X
j
B
j
Y
t−j
+ u
t
, (2)
where u
t
= Sǫ
t
is the reduced f orm shock, with B
j
= A
−1
C
j
, S = A
−1
.
Let s denote the column in matrix S corresponding to the impact on each element of t he
vector of reduced form residuals u
t
of the structural shock ǫ
t
. To compute the impulse responses
to a structural shock, we estimate
Y
t
=
X
j
B
j
Y
t−j
+ sǫ
t
(3)
As is well-known, the necessary timing restriction t hat all the elements of s are zero except
the one that corresponds to the policy indicator of interest is in general problematic, especially
when financial variables are included in the VAR such as in our application and GK’s. The
external instrument approach is well- suited to address this problem. Denoting Z
t
as a vector
of instrumental variables and ǫ
q
t
a vector structural shocks other than the p olicy shock, the
identificatio n approach requires tha t :
E [Z
t
ǫ
′
] = ψ, E
h
Z
t
ǫ
q
′
i
= 0 (4)
That is, Z
t
must be correlated with ǫ
t
, the structural shock o f interest, but ort hogonal to all
of the other sho cks.
To estimate the elements in s, we follow GK and proceed as f ollows. First, estimate u
t
from
the ordinary least squares regression of the r educed fo r m VAR (2). Second, let u
t
be t he reduced
form residual from the equation for the policy indicator of interest and let u
q
t
be the reduced
form r esidual from the equation for variables q other than the policy indicator. Let s
q
∈ s be
the response of u
q
t
to a unit increase in the policy shock ǫ
t
. Then obtain an estimate of the ratio
s
q
/s from the two stage least squares regression of u
q
t
on u
t
, using the instrument set Z
t
.
We follow GK in employing high frequency measures of policy surprises as external instru-
ments, in order to identify the structural monetary policy shocks, now in the presence of monetary
policy uncertainty. To isolate the impact o f news about monetar y policy, the surprises in fu-
tures rates are measured within a tight window a round the FOMC decision. The key identifying
assumption is that news about the rest of the economy within that window on FOMC day is
8

orthogonal to t he policy surprise. That is, surprises in Fed Funds futures o n FOMC dates are
orthogonal to within-window movements in other shocks affecting economic and financial vari-
ables. One additional benefit o f this approa ch, as illustrated in GK and RSW among others, is
that the policy surprise measure can include shocks to forward guidance.
13
This is accomplished
by incorporating in the instrument set surprises in fed funds futures for contracts that expire at
a subsequent date in the future. These surprises in principle reflect revisions in beliefs on FOMC
dates about the future path of short-term rat es. Following GK, we exploit the HFI approach to
identify exogenous monetary policy surprises and then use a f ull VAR to trace out the dynamic
responses of real and financial variables.
We analyze monthly data over the period 1985:01 to 2015:12. The end point is chosen to
coincide with the precise ending of the ZLB period. The instrument is the surprise in the three
month ahead monthly fed funds f utur es within a 30 minute window of the FOMC announcement,
taken from GK.
14
As a rgued by RSW, among others, during the ZLB period monetary policy was
aimed at rates of longer maturity (through forward guidance and quantitative easing). Thus, to
construct our instrument for updating GK’s results, we splice the interest rate futur es surprises
used in RSW onto those of GK. That is, we use the GK instruments f or 1991 :01–2008:08 and the
RSW instruments for the period 2008:09–2015:12. RSW identify U.S. monetary policy shocks
during the ZLB period using the change in five-year Treasury futures from 15 minutes before
the time of FOMC announcements to 1 hour 45 minutes afterwards on the days of FOMC
announcements (the longer window reflecting the Chair’s press conference, begun in 2011).
As no ted above, our starting point is the baseline model of GK: a VAR that includes the
log industrial production, the log consumer price index, the one-year government bond rate,
and a credit spread, specifically, the Gilchrist and Zakrajsek (GZ) excess bond premium. In
addition, we add monetary policy uncertainty. We follow GK in taking the one-year g overnment
bond rate, rather than the commonly-used Federal Funds rate, as the relevant monetary policy
indicator. As GK argue, using a safe interest rate with a longer maturity than the Fed Funds
rate allows one to consider shocks to forward guidance in the overall measure of monetary policy
shocks: a component of the reduced form VAR residual for the one-year government bond rate
13
Campbell, Evans, Fisher, and Justiniano (2012 ) and Campbell, Fisher, Justiniano, and Melosi (2016) discuss
the c omplications associated with interpreting such s urprises as pure monetary policy shocks. Their focus is on
distinguishing be tween “Delphic” and “Odyssean” forward guidance.
14
GK establish this as a valid e xternal instrument for the one-year government bond rate with the conventional
F-test statistic well above 10.
9

is a monetary policy shock that includes exogenous surprises not only to the current Fed Funds
rate but also exogenous surprises in the forward guidance about the path of future rates.
The GZ excess bond premium is the component of the remaining spread between an index of
rates of return on corporate securities and the rate on a government bond of a similar maturity
after the default risk component is removed. GZ a nd GK show that the excess b ond premium
has stro ng forecasting ability f or economic activity, outperforming every other financial indicator
and thus providing a convenient summary of much of the information from varia bles left out of
the VAR t hat may be relevant to economic activity.
Figure 5 displays t he impulse responses to an identified monetary policy shock in the five-
variable VAR estimated over the period 1985:1-2015:12.
15
In each case, the panels report the
estimated impulse responses along with 68 percent confidence bands, computed using bootstrap-
ping methods.
The impulse responses are almost identical t o those reported by GK : a surprise monetary
tightening induces a roughly 25 basis point increase in the one-year government bond rate. There
is a significant decline in industrial production that reaches a trough roughly two years after the
shock. Also consistent with standard theory, there is a very small decline in t he consumer price
index though it is not statistically significant. The excess bond premium increases by 25 basis
points on impact and returns to trend after roughly a year. This increase in the excess bo nd
premium following the monetary policy tightening is consistent with a credit channel effect on
borrowing costs.
Finally, we find no significant response of MPU, suggesting that MPU is largely unaffected
by conventional monetary policy shocks. This result is interesting in its own right and is also
somewhat reassuring: conceptually, our MPU is a “second-moment” variable that should be
mostly orthogonal to t he first-moment movement in monetary policy. Our no-response result,
at a minimum, indicates that our measure of monetary policy uncertainty captures information
that is distinct from what is contained in contemporaneous monetary policy shocks.
4 MPU and Aggregate Economic Activity
We now turn to the central question: how do economic and financial variables respond to exoge-
nous shocks to monetar y policy uncertainty? We do so using several commonly-used identification
15
We replicate GK for their sample period prior to beginning our exercises.
10

methods: Cholesky decompositions, sign restrictions, and external instruments. Our estimates
consistently indicate that monetary policy uncertainty shocks lead to weaker economic perfor-
mance and t ightened credit costs. Furthermore, comparison with the results above indicates that
the estimated cont ractionary effects of positive MPU shocks are as large as those of monetary
policy tightening shocks.
16
4.1 Cholesky decomposition
We start with the most commonly used identification method, a standard Cholesky decomposi-
tion (Sims (1980)).
17
We assume the f ollowing recursive structure of the VAR:
Y
t
= [ip
t
, cpi
t
, mpu
t
, i
t
, ebp
t
] (5)
Under the assumed ordering, monetary policy uncertainty can have an immediate impact
on the monetary po licy indicator and excess bond pr emium. Innovations in the interest rate
and excess b ond premium do not affect MPU contemporaneously, which is consistent with our
findings in Section 3. Here, we are interested in identifying shocks to MPU and t heir transmission
effects, and we therefore impose as few restrictions as possible: the current specification allows
the policy rate and the excess bond premium to respond simultaneously to MPU, which we
consider plausible given how fina ncial markets work.
18
The left panels of Figure 6 show the impulse responses following a one standard deviation
surprise increase in MPU. The sample period is again 1985:01–2015:12. There is a drop in the
one-year government bond rate, perhaps induced by the central bank responding to the increased
uncertainty by lowering the policy r ate. The excess bond premium rises o n impact, suggestive of
increased borrowing costs in response to positive shocks to monetary policy uncertainty. Finally,
despite the loosening of interest rates, industrial output and inflation fall on impact and reach a
trough roughly in month 1 7.
16
In Table 1, we summarize the ma gnitude o f effects from the various VAR identification schemes. Related to
our analysis of this sectio n, and with similar conclusions, Creal and Wu (2016) also exa mine the transmission of
monetary policy uncertainty shocks, using very different uncertainty measures and estimation framework.
17
GK also utilize results from Cholesky decompositions as a comparator. Baker, Bloom, and Davis (2016) rely
exclusively on this identification scheme.
18
We find similar results in Cholesky identifications with MPU o rdered first.
11

4.2 Sign restrictions
The results from the Cholesky decomposition are useful, serving as an easily-replicated com-
parison case, but as is well understood it is necessary to examine robustness to alternative
identificatio n schemes. Faust (1998) and Uhlig (1997, 2005) developed a metho d to incorporate
“reasonableness” of responses to monetar y policy shocks without undercutting scientific inquiry
by imposing sign restrictions on the responses of variables other than the ones whose responses
are the subject of that inquiry.
We follow suit, estimating the five-variable VAR imposing that the one-year rate and excess
bond premium must rise on impact following a one standard deviation surprise increase in MPU.
Thus, we assess the transmission of MPU shocks to output and inflation when the policy indicator
is not allowed to fall (motivated by the ZLB period).
We display impulse responses f or the sign restrictions case in the far right column of Figure
6 and for ease of comparison display the Cholesky and sign restriction cases together in the
middle column. The excess bond premium increases on impact by roughly 20 basis p oints, an
amount that is stat istically significant . The spread remains elevated above 5 basis points for
roughly another year. Compared to the standard Cholesky identification, the declines in indus-
trial production and consumer price index are greater and more persistent under sign restrictions,
although not statistically significant in the case of CPI. This follows conventional reasoning, given
that the interest rate cannot fall.
We note that the relationship between monetary policy uncertainty and interest rate is am-
biguous conceptually. Consider the one-year bond rate to be the expectation o f future (overnight)
policy rates plus a term premium. During the Z L B period, it is likely tha t higher MPU raises
term premiums without affecting expectations of f utur e policy rates and hence raises the one-
year bond rate. Away fr om the ZLB, however, higher MPU could lead to lower interest rates as
exp ected future policy rates fall. We take note of this in discussing the remainder of our results.
19
4.3 External Instruments
We tur n t o estimating the transmission of MPU shocks using the external instruments approach,
described in section 3 for the case of identifying monetary policy shocks. Here, we will use as
19
When we estimate using external instrument over 1994-2015, thereby with a larger fraction of the sample
being ZLB years, the interest rate response to MPU is indeed more positive (compared to the full-sample case
also using external instrument), displayed in Figure F.7 in Appendix F.
12

our instrument the “monetary policy uncertainty surprise”. This is constructed as the change
in uncertainty around FOMC meeting days, orthogonalized with respect to the monetary poli c y
surprise described in section 3. Denote the daily implied volatility on the eighth eurodollar
futures contract σ(ED8)
t
. This is a measure of uncertainty about future monetary policy. We
regress the change in implied volatility from the day before the FOMC meeting to the day of the
meeting on the “spliced monetary policy instrument” of GK/RSW on FOMC meeting days,
20
∆σ(ED8 )
t
= γpolicy surprises
t
+ η
t
.
The r esidual from this regression, η
t
, is the monetary policy uncertainty surprise.
21
This instru-
ment series is monthly. It takes on a value equal to t he uncertainty surprise in months when there
is an FOMC meeting and zero when there is not. The orthog onalization is important because at
the ZLB, a downward shift in the expected path of policy will mechanically lower interest rate
uncertainty. Our approach thus provides valid instruments by using high-frequency data, with
the key identifying assumption that shocks to the economy and monetary policy (within narrow
windows around FOMC announcements) are uncorrelated with the residual.
Figure 7 displays the impulse resp onses estimated using external instruments. Once again,
we observe that positive shocks t o MPU are cont ractionary: there is a fairly rapid decline in IP
which reaches a trough in about 18 months; the EBP remains elevated for over a year befo r e
reverting to trend; the CPI response is insignificant, as in the GK replication analysis, while the
interest rate response eventually becomes negative in order to offset the contractionary effects
on IP and EBP.
Finally, we estimate the external instrument s VAR with the human index replacing the base-
line index. We find very similar results, as noted in the next section.
4.4 Comparison across identification schemes
The VAR analysis suggests that monetary policy uncertainty shocks lead to weaker macroeco-
nomic performance and tightened credit costs. In Table 1, we compare the size of the impulse
20
Note that this amounts to a timing as sumption about MPU and MP shocks, where by the fo rmer are contem-
poraneously uncorrelated with the latter. This seems reasonable on a priori gro unds , and is also buttressed by
our IRFs showing the ins ignificant respons e of MPU to GK monetary policy shocks.
21
This is in the s pirit of Akkaya, Gurkaynak, Kisacikoglu, and Wright (2015). We have tried several mea sures
of high-frequency monetary policy surprises on the right hand side. The se included surprises on instruments at
various horizons from 1-q uarter ahead to 8. All produced essentially the same results. We choose the spliced
GK/RSW instrument for co mparability with the results in the previous section (GK replication).
13
responses to MPU shocks under the various VAR identification schemes we consider. Further-
more, we compare these to the magnitude of the responses to monetary policy shocks in GK and
in our replication and updating of their results. We report responses of MPU, interest rate, IP,
and CPI on impact, at horizon 12, and at its maximum.
4.4.1 Monetary Policy Shocks (magnitude)
The first two columns display results for monetary policy shocks under the external instru-
ments identification for Gertler and Karadi’s VAR in two different sample periods: GK’s original
1979:07–2012:06 and our sample period for estimating MPU shocks 1985 :01–2015:12. In these
cases, MPU is not in the VAR. As seen in row 2, interest rates rise on impact by about 20 basis
points. The CPI does not change much on impact but eventually falls. IP declines following the
contractionary monetary policy shock, with a peak effect occurring around the two-year mark.
Notice t hat the magnitude of t he decline in IP is considerably larger in the updated sample
compared to GK’s initial results. In column 3, we add MPU to the VAR, corresponding to the
case reported in Figure 5. The results are nearly identical to those o f column 2: adding MPU to
the GK VAR has essentially no effect on the transmission of monetary policy shocks.
4.4.2 MPU Shocks (magnitude)
The remaining columns of Table 1 report the effects of MPU shocks. In each case, the shock
is normalized to a rise in MPU of around 36 p oints, approximately one standard deviation.
Comparing columns 4 and 5, the Cholesky and sign restrictions cases depicted in Figure 6, we
see declines in IP and CPI that are equal to or gr eat er than the declines observed in response to
monetary po licy shocks. For example, in the case of sign restrictions, the rise in MPU leads t o
a maximum drop in IP of 1.1 2 percent compared to 1 .11 fo r monetary policy shocks in the five-
variable GK case. Both of these maximum declines occur at around the two year horizon. Notice
from the results at month 12 that the responses to monetary po licy shocks unfold more rapidly
and are shorter-lived than the responses to MPU shocks under Cholesky or sign restrictions.
Turning to the external instruments cases (column 6-8), we see very large contractionary
transmission effects of MPU shocks, estimating either with the baseline MPU index, the human
index, or with baseline MPU index over the sub-sample 1994-2015. The rise in MPU (normalized)
produces a decline in IP that is comparable to the drop observed in response to monetary policy
shocks.
14
5 Further Discussions of MPU
In order to provide a deeper understanding of what our MPU index captures, in this section we
compare our MPU index to alternative measures of monetary policy uncertainty, and examine the
evolutio n o f our index both during FOMC meeting cycles and over the full sample. In addition,
to provide a theoretical underpinning for our VAR results, we illustrate a pot ential transmission
mechanism of monetar y policy uncertainty in an extended version of McKay, Nakamura, and
Steinsson (2016).
5.1 Alternative measures of monetary policy uncertainty
We compare our baseline MPU index to a number of alternative measures that have been used
as proxies for monetary policy uncertainty. The first is from the Federal Reserve Bank of New
York’s Survey of Primary Dealers, which is conducted one week before each FOMC meeting.
The Survey is available beginning in 200 4, and has the appealing feature of a sking resp ondents
to directly report both their forecasted policy rates and their forecast uncertainty. We use the
dealers’ responses to the following question, over the time period for which this question was
relevant and hence asked (i.e., through late 2 012): “Of the possible out comes below (that is, −50
bps, −25 bps, +0 bps, +25 bps, +50 bps), please indicate the percent chance yo u attach to the
indicated policy move at each of the next three FOMC meetings”. To gauge the respondents’
perceived uncertainty regarding monetary policy, we calculate the avera ge within-respondent
standard deviation of forecasted policy rates.
Our baseline MPU index tracks the survey-based uncertainty measure closely prior to 2008
when the effective zero bound was reached, with a correlation of 0.75 for the one-meeting ahead
forecast and progressively slightly less for each of the next two meeting-ahead forecasts (Figure
8). This suggests that news-based search results capture the intensity of concerns over both
near-term and longer-term horizons, with a relatively stronger focus on the near-term.
In the months preceding the actual liftoff in December 2015, it was apparent that a major
component of monetary policy uncertainty centered on the timing o f lift off. We thus also con-
struct from the Primary Dealers Survey a measure of liftoff uncertainty in a manner similar to
the interest rate uncertainty above. The Survey began asking respondents to judg e the likelihood
of liftoff over a pre-defined horizon consisting of 6 - 11 time periods, starting in April 201 0. Our
MPU index moves quite closely with Primary D ealers’ liftoff uncertainty during 2015 (Figure
15

9), consistent with the notion t hat in that year monetary policy uncertainty more generally was
primarily about expectations concerning the timing of liftoff.
Second, we compare our MPU index to two market-based indicators of monetary policy
uncertainty. In Figure 1 0 we display our measure against t he implied volatility of options on
one-year swa p rates (swaptions), taken from Carlston and Ochoa (2016). Note that as the short-
term policy rate approached zero, the market-based indicator fell quickly and remained extremely
low during the ZLB period. This suggests that the market-based measures do not fully capture
monetary policy uncertainty in a broad sense. Episodes such as the Taper Tantrum in 2013
and financial market turmoil prior to the October 2015 FOMC meeting suggest that uncertainty
regarding the timing and pace of policy rate normalization was far from zero. Our MPU measure
is more strongly correlated with one-year swaption volatility, shown above, t han the t en- year (not
shown), reinforcing the notion that our measure captures more o f the near-term course of policy.
In a ddition, we compare our index to the VIX, the stock market options-based implied volatility
measure that has been widely used as a proxy for uncertainty (Bloom, 2009). Our measure of
monetary policy uncertainty is positively correlated with the VIX, but only weakly so.
22
Compared to these measures based on survey data and market volatility, our measure there-
fore has the advantage of (1) being available in countries and during time periods when market or
survey da ta are not available and (2) better capturing uncertainty in periods with unconventional
monetary policy when the policy ra t e is at or near the lower bound.
We also compare our baseline MPU with the Baker, Bloom, and Davis’ (2016) Monetary
Po licy sub-index o f EPU, which is only correlated with our MPU index at 0.46. Our index
construction differs from theirs along three dimensions (indexes are displayed in Figure 1 1).
First, they use the Access World News database of over 2,000 newspapers while we focus on
three leading newspapers t hat are tailo r ed to national economic and financial news. Second,
our keyword search features a more refined focus on monetary policy in the U.S., while Baker,
Bloom, and Davis (2016) include a considerably broader set of words in a string of “or”s that
potentially include discussions of other central banks or Fed chairman, for example, “Bernanke”,
“Volker”, “Greenspan”, “central bank”, “Fed chairman”, “Fed chair”, “European Central Bank”,
“ECB”, “Bank of England” , “Bank of Japan”, “BO J” , “Bank of China”, “Bundesbank”, “Bank
of France”, “Bank of Italy”. Third, they scale the total number of identified articles by the
22
See Husted, Rogers, and Sun (2016a).
16

total number of articles rather than the number mentioning “Federal Reserve” (broadly). In
order to understand the importance of these different index construction strategies, we conduct
a “reconciliation analysis” in Appendix D. We conclude from our reconciliation analysis that in
order of importance, the factors explaining the weak correlation between MPU-HRS and MPU-
BBD can be ranked: (1) Newspapers, (2) Keywords, and (3) Scaling. Given their significantly
larger set of search terms and newspapers, it is likely that theirs captures a relatively larger
global factor while ours is more U.S. centric.
23
5.2 Movements in MPU around central bank meeting days
To further understanding of our MPU index, we examine how it evolves on the days before and
after po licy meeting days. It is natural to expect that monetary policy uncertainty would decline
after t he FOMC meets, assuming that policy (in)actions and the associated explanations help
mitigate near-term uncertainty about monetary policy. Furt hermore, it is logical that enhanced
FOMC communication policies will affect uncertainty. These considerations lead us to examine
the level of monetar y policy uncertainty a round FOMC meetings in two sub-periods: February
1994-November 2008 and December 2008 -January 2016.
24
The results are depicted in Figure 12. In both sub-periods, there is a rise in MPU in the days
prior to FOMC meetings. In the earlier sub-period, MPU peaks on the day after the FOMC
meeting, the first day of newspaper coverage. Comparing the two lines, we see that in the
latter sub-period, when the FOMC bega n to rely increasingly on f orward guidance, this rise in
MPU is greatly muted and uncertainty peaks one day sooner.
25
Checking articles’ time-stamping
indicates t hat this finding is not a mechanical result of earlier on-line availability of news in the
latter sub-period. The evidence is thus consistent with the notion that enhanced communications
policies helped ease uncertainty regarding monetary policy by building in expectations of both
the near-term and lo nger-term course of mo netar y policy.
23
We also repeat the VAR analysis for these alter native measures of monetary policy uncertainty and repor t
similar results in Appe ndix F.
24
It is natural to believe that newspaper coverage of moneta ry policy also rises in the days proceeding FOMC
meetings and declines afterward. Hence the importance of our dividing the raw count of identified articles by the
number mentioning “Federal Reserve”.
25
Our MPU index rises on the day after the FOMC meetings in the Fe bruary 1994- November 2008 sample:
Fro m human reading of these article s, we note that news articles on the day after the meetings often discus s (1)
uncertainties in economic consequences of the Fed decision and/or (2) uncertainties in near-term/future monetary
policy actions although curr ent uncertainty seems to have abated.
17

5.3 Does FOMC Communication Influ enc e MPU?
Commentato r s on central banking have long emphasized factors such as transparency and cred-
ibility. Concerning the current communication regime at the Fed, Bernanke (2015) recently
opined: “I hope that t he Fed’s increased tra nsparency will help it maintain its independence,
even as it remains democrat ically accountable. The chair’s press conferences, the expanded eco-
nomic and interest rate projections by FOMC participants, and the lively debate evident in Fed
policymakers’ speeches continue to provide the Congress, the public, and the markets with con-
siderable infor ma t ion about the Fed’s strategy and its rationale. The days of secretive central
banking are long gone. The Federal Reserve is not o nly one of the world’s most transparent
central banks, it is also one of the most transparent government agencies in Washington.”
Indeed, it wasn’t always this way. Goodfriend (1986) notes that the Federal Reserve for-
merly held a strong penchant for secrecy. In an influential theoretical paper, Cukierman and
Meltzer (1986) examine the implications of a central bank’s informational advantage for policy-
maker credibility and inflation. They establish conditio ns under which ambiguity and imp erfect
credibility are preferable from the po int of view of the po licymaker to explicit fo rmulation of
objectives and perfect credibility. In an extension, Faust and Svensson (1999, 2001) study cen-
tral bank transparency, credibility, and reputation. They derive the endogenously determined
degree of tr ansparency, show that a n equilibrium with low transparency is a likely outcome of
the model, and assert that it is (wa s) appropriate to char acterize the Federal Reserve and Bun-
desbank in that way. However, the 1990s elicited fresh analysis from central banking theory, and
wa s accompanied by a sea change of monetary policy making across the globe (Inflation Reports,
inflation targ eting) . Woodf ord (2013) and Bianchi and Melosi (2017) both find advantages for a
central bank that communicates explicitly about its future policy.
26
In Table 2 , we characterize the relationship between our index of monetary policy uncertainty
and variables that proxy for the considerations noted above. These variables ar e discussed in
detail in Appendix E. We focus on institutional or procedural features, including dissenting
vo t es, member turnover, and newly-constructed measures of “FOMC statement persistence” and
26
Milton Friedman (1990) is perhaps most blunt about the FOMC and the long gone days referred to by
Bernanke: “From revealed preference, I suspect that by far and away the two most important var iables in their
loss functions are avoiding accountability on the one hand and achieving public pr e stige on the other”. More
recently, in “The Fed’s Communication Breakdown,” Project Syndicate, November 13, 2015, Ken Rogoff echoe s
Faust-Svensson’s theoretical finding, remarking, “however good its intentions, the net effect of too much Fed
speak has been vagueness and uncertainty.”
18

“FOMC-revealed uncertainty” ( displayed in Appendix E). We also include a dummy va riable
for the crisis period of 2008H2 , as well as separate dummies for the t erms of different FOMC
Chairs. To allay concerns about endogeneity, we also control for U.S. macroeconomic uncertainty
(Jurado, Ludvigson, and Ng (2015)), financial uncertainty (Ludvigson, Ma, and Ng (2016), and
global geopolitical risk (Caldara and Iacoviello (2017)).
We estimate regressions of the form
MP U
t
= α + βX
t−1
+ γZ
t
+ u
t
,
where X
t−1
includes the prior-meeting values of the institutional variables noted above: dissenting
vo t es, statement persistence, member turnover, and FOMC-revealed uncertainty. Similarly, Z
t
represents current-period values of the contro l variables: macroeconomic uncertainty, financial
uncertainty, and geopolitical risk. We also include separate dummies for each Fed chairperson.
We pay close attention to the timing, e.g., associating dissenting votes at the current meeting
with MPU over the following inter-meeting period.
27
As seen in Table 2, the regression coefficients are mostly of the anticipated sign. Sta t ement
Persistence is negative and significant: greater similarity in the language used by the FOMC
in its St atement from meeting t o meeting is followed by lower MPU. We also find that greater
financial uncertainty and geopolitical risk are robustly followed by higher MPU.
This analysis indicates that there is some significant effect of FOMC communications on
MPU. However, at a deeper level the conceptual underpinning of our MPU index is potentially
quite encompassing. Consider the increased importance of forward guidance, especially as interest
rates hit the effective lower bound. Gurkaynak, Sack, and Swanson (2 005) show that much of the
surprise news about monetary policy at the time of FOMC announcements arises from signals
about the central bank’s intentions about future monetary policy. Far future forward guidance
has also been shown to be extremely powerful ( e.g. Eggertsson and Woodford (20 03), Carlstrom,
Fuerst, and Paustian (2012) , D el Negro, Giannoni, and Patterson (2013)): promises abo ut far
future interest rates have huge effects on current economic outcomes, and these effects gr ow with
the ho rizon of the f orward g uida nce. However, uncertainty also grows with the horizon of central
bank promises, given limited cent ral bank credibility and imperfect communication strategies.
Episodes of financial turmoil, for example, around the Taper Tantrum of 2013 and prior to the
27
We also tried several other controls, e.g., natural dis aster and Ramey fisca l policy shocks, but found them to
be insignificant. Appendix E describes all of the va riables used in this analysis.
19
October 2015 FOMC meeting, make apparent that a great deal o f uncertainty exists regarding
the timing of liftoff, which has a strong economic effect. Our MPU index is able to capture this
important element of uncertainty regarding monetary policy, namely, t he timing and path of
future interest rates. As we saw above, MPU shocks have strong contractionary effects on real
and financial variables in the aggregate.
There is a lso a theoretical literature examining the effects of uncertainty o n central bank
communication and policy rules. An earlier part of the literature modeled uncertainty about the
interest rate rule. Rudebusch (2001, 2002) considers uncertainty about the parameters in the
central bank’s policy rule, as well as real-time data uncertainty. Ehrmann-Smets (2003) examine
implications of optimal monetary p olicy when the central bank follows a Taylor Rule but there
is uncertainty about potential output. One result that emerges is that it is optimal to appoint a
more “hawkish” central bank. Levin-Wieland-Williams (2003) consider optimal monetary policy
when the central bank has model uncertainty, i.e., it does not know the “true” model of the
economy a nd so considers several alternat ives. They identify the key characteristics of policy rules
that are robust to such uncertainty. In Eusepi-Preston ( 2010), agents have uncertainty about
the interest rate path that the central bank will follow, while the centr al bank has uncertainty
about the economic state. They show that, absent communication, t he Taylor principle is not
sufficient for macroeconomic stability, and analyze several different communication strategies for
the central bank to follow. More recently, Bianchi-Melosi (2016, 20 17) model monetary policy
under the assumption that agents have uncertainty about whether the central bank is fo llowing
“passive” or “active” inflation stabilization.
5.4 Power of Forward Guidance under Uncertainty
Taking a cue from the literature above, in this section we provide a concrete example of what,
conceptually, our MPU captures and its pot ential effects on the real economy. We extend McKay,
Nakamura, and Steinsson (2016) (hereafter, MNS) to allow for uncertainty in forward guidance.
These authors use a model with uninsurable idiosyncratic shocks to household productivity,
borrowing constraints, and nominal rigidities, to analyze the economic effects of forward guidance.
We incorporate into their framework uncertainty about whether the Fed would change the rate
as promised.
Standard monetary models imply that far future forward guidance has large effects on current
20

outcomes, and that these effects grow with the horizon of the forward guidance. MNS show that
in a model with incomplete ma r kets, forward guidance has substantially less power to stimula te
the economy, because a precautionary savings effect tempers households’ responses to changes
in future int erest rates. In their model, there is some probability that one will face a borrowing
constraint before the pr omised future interest rate reduction, effectively shortening one’s planning
horizon. Also, ho useholds that are subject to uninsurable idiosyncratic income risk and borrowing
constraints will be reluctant to run down their wealth since this will reduce their ability to smooth
consumption in the face of future income shocks.
The MNS economy is populated by a unit continuum of ex ant e identical households with
preferences given by
E
0
∞
X
t=0
β
t
C
1−γ
ht
1 − γ
−
l
1+ψ
ht
1 + ψ
,
where C
h,t
is consumption of household h at time t and l
h,t
is la bor supply of household h at time
t. Households are endowed with stochastic idiosyncratic productivity z
h,t
that generates pretax
labor income W
t
z
h,t
l
h,t
, where W
t
is the aggr egate real wage. Each household’s productivity z
h,t
follows a Markov chain with tra nsition probabilities P r(z
h,t+1
|z
h,t
). The initial cross-sectional
distribution of idiosyncratic productivities is equal to the ergodic distribution of this Markov
cha in, denoted by τ(Z
it
).
A final good is produced from intermediate inputs according to Y
t
=
R
1
0
y
t
(j)
1/µ
dj
µ
, where
Y
t
denotes t he quantity of the final good produced at time t and y
j,t
denotes the quantity of the
intermediate good pro duced by fir m j in period t. The intermediate goods are produced using
labor as an input according to the production function y
t
(j) = n
t
(j), where n
j,t
denotes the
amount of labor hired by firm j in period t.
While the final good is produced by a representative competitive firm, the intermediate goods
are produced by monopolistically competitive firms. The intermediate g oods firms face frictions
in adjusting their prices and can only update their prices with probability θ per period. These
firms are controlled by a risk-neutral manager who discounts future profit s at rate β. Whatever
profits a re produced are paid out immediately to the households with each household receiving
an equal share D
t
. Households cannot trade their stakes in the firms.
Households trade a risk-free real bond with real interest rate r
t
between periods t and t + 1.
Borrowing constraints prevent these households from taking negative bond positions. There
is a stock o f g overnment debt outstanding with real face value B. The government raises tax
21

revenue to finance interest payments on this debt. These taxes ar e collected by taxing households
according t o their labor productivity z
h,t
. The tax paid by a household h in period t is τ
t
¯τ(Z
it
).
The government r uns a balanced budget so as to maintain a stable level of debt in each period.
MNS analyze an experiment in which the monetary authority announces that the real interest
rate will be lowered by 1 percent for a single quarter five years in the future. The real rate is
maintained in all other quarters. Using the MNS calibration, we run a thought experiment to
analyze the effects of uncertainty households may perceive a bout forward guidance: we assume
that households believe that there is a 50% chance that the central bank will follow through on
the rate decrease five years in the future and a 50% chance that there is no rate change in five
years.
Figure 13 plots the response of output to this shock in our extended MNS model, as well as in
the complete and incomplete mar kets versions of the MNS model. The response of output under
complete markets is a step function: Output immediately jumps up and remains at that elevated
level for 20 quarters before returning to steady state. Consistent with MNS, output has a smaller
initial response and is substantially smaller in the incomplete markets model than under complete
markets, even in the period right before the interest rate decrease. This is because households
trade off the cost of a lower buffer stock (more exposure to future income shocks) with the gains
from intertemporal substitution, since they are no longer fully insured against all shocks as they
wo uld be with complete markets. In our experiment, when there is uncertainty about whether
the rate decline promised under forward guidance will actually materialize, households discount
the promise. This results in a muted effect of forward guidance, both at the outset and for the
response in the period before quarter 2 0. In addition, ho useholds’ risk aversion implies that ,
by Jensen’s inequality, uncertainty abo ut future interest ra t es further depresses the stimulating
effects of the a nno uncement.
28
Thus, consistent with our empirical findings, a theoretical argument can be made that forward
guidance has less power to stimulate the economy when households perceive some uncertainty
about whether the promised rate cut will mat erialize.
28
This effect is quantitatively small under the MNS calibration. This second-order Jense n’s inequality effect
(that further reduces o utput) is counteracted by a smaller redistribution effect: the interest rate shock leads to a
redistribution of wealth away from hous eholds with high marginal propensities to consume and toward households
with low margina l propensities to consume, which lowers aggregate demand and output; this effect is s ignificantly
smaller with our assumption in our ex periment.
22

6 Conclusion
We develop new measures of monetary policy uncertainty: uncertainty tha t the public perceives
about Federal Reserve policy actions and their consequences. We compare t hese new measures to
existing proxies and argue tha t there are good reasons to prefer ours, especially over medium term
horizons such as FOMC meeting intervals. Empirically, we note for example that market-based
measures were well subdued–close to zero–during the ZLB while ours were elevated and fluctu-
ating. Conceptually, differences exist between our measure and the market-based indicators. In
theory, the latter reflect the average perception of individuals participating in options markets.
Our news-based index reflects the average opinion of people reading newspapers (assuming that
newspapers reflect the readership). Since relatively few households participate in the optio ns
markets, the prices in these markets may not be particularly representative. In a ddition, in
market-based indicators the perceived degree of uncertainty is contaminated with time-varying
risk aversion and state-dependent marginal utility.
29
Although we acknowledge (and try to con-
trol for) the potential state-dependency in newspaper coverage of centra l bank actions, we believe
that our index is a preferable measure of monetary policy uncertainty, at least over the sample
period and for the frequency we study.
We examine transmission of monetary policy uncertainty, showing that greater uncertainty
has contractionary effects. Positive shocks to monetary policy uncertainty raise credit costs and
lower output with about the same dynamic pattern as do identified contractionary monetary
policy shocks such as GK’s that are regarded as standard in the literature. The mag nit ude
of estimated effects is at least as large as, if not larger than, those of monetary policy shocks.
These results are robust to alternative measures of monetary policy uncertainty (Appendix F).
Consistent with this, we make a simple theoretical argument why forward guidance could be less
stimulative when households perceive some uncertainty about whether promised rate cuts will
materialize.
Our findings are in line with others in the literature that illustrate nega t ive economic ef-
fects of uncertainty shocks. Our analysis suggests that if p olicy rate normalization is successful
in alleviating the public’s uncertainty regarding monetary policy, that can help neutralize the
29
The market-based measure s are presumed to reflect the price individuals are willing to pay for insurance
against future policy rate fluctuations. Willingness to substitute resources from one possible future to another
depe nds on the rela tive scarcity of resources in those futures. Therefore, a household may be willing to pay a lot
to insure against the possibility of a rate increase even if the household sees the outcome as highly unlikely.
23

contractionary effects of the rat e increases themselves.
References
[1] Acosta, Miguel 2015. “FOMC Responses t o Calls for Transparency,” Finance and Economics
Discussion Series 2015-060, Boa rd of G overnors of the Federal Reserve System.
[2] Akkaya, Yildiz, Refet S. Gurkaynak, Burcin Kisacikoglu, and Jonathan H. Wright 2015.
“Forward Guidance and Asset Prices,” working paper, Johns Hopkins University.
[3] Angrist, Joshua D., and Alan B. Krueger. 2001. “Instrumental Varia bles and the Search f or
Identification: From Supply and Demand to Natural Experiments.” Journal of Economic
Perspectives, 15(4): 69-85.
[4] Azzimonti, M. 2017. “Partisan Confict and Private Investment,” Jo urnal of Monetary Eco-
nomics, Forthcoming.
[5] Ba chmann, R., S. Elstner, and E. Sims 2013. “Uncertainty and Economic Activity: Evidence
from Business Survey Data,” American Economic Journal: Macroeconomics, 5(2), 217-249.
[6] Ba chmann, R., and G. Moscarini 2012. “Business Cycles and Endogenous Uncertainty,” Yale
University working paper.
[7] Ba ker, Scott, Nicholas Bloom, a nd Steven J. Davis, 2016. “Measuring Economic Policy Un-
certainty,” The Quarterly Journal of Economics 131, 1593-1636.
[8] Ba uer, M. D., 20 12. “Monetary Policy and Interest Ra t e Uncertainty,” Federal Reserve Board
San Francisco Economic Letter 2012-38.
[9] Bernanke, Ben S, 201 5. The Courage to Act: A Memoir of a Crisis and its Aftermath. W.W.
Norton and Company, New York.
[10] Bianchi, F., Melosi, L. 2016. “Modeling the Evolution of Expectations and Uncertainty in
General Equilibrium,” International Economic Review, 57(2), 717-756.
[11] Bianchi, Francesco, and Leonardo Melosi, 2017. “Constrained Discretion and Central Bank
Tr ansparency,” Review of Economics and Statistics, forthcoming.
[12] Bloom, N. 2009 . “The Impact of Uncertainty Shocks,” Econometrica, 77(3), 623-685.
[13] Boukus, Ellyn, and Rosenberg, Joshua. 2006. “The inf ormation content of FOMC minutes,”
Federal Reserve Ba nk of New York.
[14] Brainard, Lael, 2017. “Monetary Policy in a Time of Uncertainty,” Brookings Institution,
Washington, D.C. January 17, 2017.
[15] Caldara, Dario, and Matteo Iacoviello (2017), “Measuring Geopolitical Risk,” unpublished
paper, Board of the Governor s of the Federal Reserve Board, September 2016, available at
https://www2.bc.edu/matteoiacoviello/gpr
files/GPR PAPER.pdf
[16] Campbell, J.R., C.L. Evans, J.D. Fisher, and A. Justiniano, 2012. “Macroeconomic Effects
of Federal Reserve Fo r ward Guidance,” Brookings Papers on Economic Activity, Spring, pp.
1-54.
24
[17] Campbell, J.R., J.D. Fisher, A. Justiniano, and L. Melosi, 2016. “Forward Guidance and
Macroeconomic Outcomes since the Financial Crisis,” Federal Reserve Bank of Chicago, WP
2016-07.
[18] Carlson, J. B., Craig, B. R., and Melick, W. R., 2005. “Recovering Market Expectations of
FOMC Rate Changes with O ptions o n Federal Funds Futures,” Journal of Futures Markets,
25, 1203-1242.
[19] Carlston, Benjamin, and Marcelo Ochoa, 2016. “Macroeconomic Announcements and In-
vestors Beliefs at the Zero Lower Bound,” working paper, Federal Reserve Board.
[20] Creal, Drew D., and Jing C. Wu, 2016. “Monetary Policy Uncertainty and Economic Fluc-
tuations,” International Economic Review, forthcoming.
[21] Cukierman, Alex, and Allan H. Meltzer. 1986. “A Theory of Ambiguity, Credibility, and
Inflation under Discretion and Asymmetric Information,” Econometrica 54, 1099-11 28.
[22] Davis, A. K., J. Piger, and L. M. Sedor. 2012. “Beyond The Numbers: An Analysis Of
Optimistic And Pessimistic Language In Ear nings Press Releases,” Contemp orary Accounting
Research, 29, 845 868.
[23] Demers, E., and C. Vega , 20 10. “Soft Informa t ion In Earnings Announcements: News Or
Noise?” Working Paper, INSEAD.
[24] Ehrmann, M., Smets, F. 2003. “Uncertain Potentia l Output: Implications for Monetary
Po licy,” Journa l of Economic Dynamics and Control, 27 ( 9), 16 11-1638.
[25] Ehrmann, Michael, and Fratzscher, Marcel. 2007. “Communication by central bank commit-
tee members: different strategies, same effectiveness?” Jour nal of Money, Credit and Banking,
39(2-3), 509541.
[26] Emmons, W. R., Lakdawala, A. K., and Neely, C. J., 2006. “What Are the Odds? Option-
Based Forecasts of FOMC Target Changes,” Federal Reserve Bank of St. Louis Review,
November/December 2006, 88, 543-61.
[27] Engen, Eric M., Thomas T. Laubach, and David Reifschneider. 2015. “The Macroeconomic
Effects of the Federal Reserve’s Unconventional Monetary Policies,” Finance and Economic
Discussion Series 2015-005. Boa rd of G overnors of the Federal Reserve System.
[28] Engelberg, J. E. , 2008. “Costly Information Processing: Evidence From Earnings An-
nouncements,” Working Paper, University of North Carolina.
[29] Eusepi, S., Preston, B. 2010 . “Central Bank Communication and Expectations Stabiliza-
tion,” American Economic Journal: Macroeconomics, 2 ( 3), 23 5-271.
[30] Faust, J., and L. E. O. Svensson. 1999. “The Equilibrium Degree of Transparency and
Cont r ol in Monetary Policy,” Journa l of Money, Credit, and Ba nking.
[31] Faust, J., and L. E. O. Svensson. 2001. “Transparency and Credibility: Monetary Policy
with Unobservable Goals,” International Economic Review, 42(2).
[32] Feldman, R., S. Govindaraj, J. Livnat, and B. Segal, 20 10. “Managements Tone Change,
Po st Earnings Announcement Drift And Accruals,” Review of Accounting Studies 15 , 915953.
25
[33] Fernandez-Villaverde, J., P. Guerron-Quintana, K. K uester, and J. Rubio-Ramirez 2015.
“Fiscal Volatility Shocks and Economic Activity,” forthcoming in American Economic Re-
view.
[34] Fernandez-Villaverde, J., P. Guerron-Quintana, J. F. Rubio-Ramirez, and M. Uribe 2011.
“Risk Matters: The R eal Effects of Vola t ility Shocks,” American Economic Review, 101(6),
2530-61.
[35] Fischer, S. 2017. “Monetary Policy Expectations and Surprises”, Columbia University,
https://www.federalreserve.gov/newsevents/speech/fischer20170417a.htm
[36] Goodfriend, Marvin. 1986, “ Monetar y Mystique: Secrecy and Central Banking,” Journal of
Monetary Economics, 17, 63-92.
[37] Hoberg, Gerard, and Gordon Phillips. 2010. “Product Market Synergies and Competition
in Mergers and Acquisitions: A Text-Based Analysis,” Review of Fina ncial Studies 23(10):
37733811.
[38] Husted, L., J. Rogers, and B. Sun, 2016a. “Measuring Monetary Policy Uncertainty: The
Federal Reserve January 1986 t o January 2016,” Federal Reserve Board,
https://www.federalreserve.gov/econresdata/notes/ifdp-notes/2 016/measuring-monetary-
policy-uncertainty-the-federal-reserve-january-1985-january-2016-20160411.html
[39] Husted, L., J. Rogers, and B. Sun, 2016b. “Measuring Cross-Countr y Monetary Policy Un-
certainty,” Federal Reserve Board, https://www.federalreserve.gov/econresdata/notes/ifdp-
notes/2016/measuring-cross-country-monetary-policy-uncertainty-20161123.html
[40] Jurado, Kyle, Sydney C. Ludvigson a nd Serena Ng. 2015. “Measuring Uncertainty.” Amer-
ican Economic Review, 105(3): 1177-1216.
[41] Justiniano, A., and G. Primiceri. 2008. “Time-Varying Volatility of Macroeconomic Fluctu-
ations,” American Economic Review, 98(3), 604-641.
[42] Levin, A., Wieland, V., Williams, J. 2003. “The Performance of Forecast-Based Monetary
Po licy Rules Under Model Uncertainty,” American Economic R eview, 93(3), 622-645.
[43] Loughran, T., and B. McDonald, 2011. “When Is a Liability Not a Liability? Textual
Analysis, Dictionaries, and 10-Ks,” Journal of F inance 66, 3565.
[44] Ludvigson S., S. Ma, and S. Ng, 2016. “Uncertainty and Business Cycles,” Working Paper,
New York University and Columbia University.
[45] McKay, A., E. Naka mura, and J. Steinsson, 2016. “The Power of Forward Guidance Revis-
ited,” American Economic Review, 106(10), 3133-31 58.
[46] Meade, Ellen E, and Miguel Acosta, 2015. “Hanging on every word: Semantic analysis of
the FOMC’s postmeeting statement,” FED S Notes, Federal Reserve Board
[47] Meade, Ellen E, and Stasavag e, David. 2008. “Publicity of Debate and the Incentive to
Dissent: Evidence from the US Federal Reserve,” The Economic Journal, 118(528), 6 95717.
[48] Nakamura, E., D. Sergeyev, and J. Steinsson, 2014 . “Growth-Rate and Uncertainty Shocks
in Consumption: Cross-Country Evidence,” Columbia University working paper.
26
[49] Ramey, Valerie, 2015. “Macroeconomic Shocks and Their Propagation,” Handb ook o f
Macroeconomics.
[50] Rogers, John, Chiara Scotti, and Jonathan Wright, 2016. “Unconventional Monetary Pol-
icy a nd International Risk Premia,” International Finance Discussion Paper 1172, Federal
Reserve Board, https://www.federalreserve.gov/econresdata/ifdp/2016 /files/ifdp1172.pdf
[51] Romer, Christina D., and David H. Romer, 2004. “A New Measure of Monetary Shocks:
Derivation and Implications,” American Economic Review, 94(4), pp. 1054-108 4.
[52] Rudebusch, G. 2001. “Is the Fed too Timid? Monetary Policy in an Uncertain World,”
Review of Economics a nd Sta tistics, 83(2), 203 -217.
[53] Rudebusch, G. 2002. “ Assessing Nominal Income Rules for Monetary Po licy with Model
and Data Uncertainty,” Economic Journal, 112(479), 402-432.
[54] Scotti, Chiara, 2013. “Surprise and Uncertainty Indexes: Real-Time Ag gregation of Real-
Activity Macro Surprises,” International Fina nce Discussion Papers 1093. Board of Governors
of the Federal Reserve System.
[55] Schonhardt-Bailey, Cheryl. 2013. “Deliberating American Monetary Policy: A Textual Anal-
ysis,” The MIT Press.
[56] Sims, Christopher J, 1980. “Macroeconomics and Reality,” Econometrica.
[57] Stock, J., and M. Watson 2012. “Disentangling the Channels of the 2007 -2009 Recession,”
Brookings Papers o n Economic Activity, pp. 81-135 .
[58] Stock J and Yogo M. 2005. “Testing for Weak Instruments in Linear IV Regression. In: An-
drews DWK Identification and Inference for Econometric Models. Identification and Inference
for Econometric Models,” New York: Cambridge University Press, pp. 80-108.
[59] Swanson, E. T., 2006. “Have Increases in Federal Reserve Transparency Improved Private
Sector Interest Rate Forecasts?” Journal of Money, Credit and Banking, 38, 791-819.
[60] Shoag, Daniel and Stan Veuger. 2015. “Uncertainty and the geog raphy of the great reces-
sion,” Harvard Kennedy School mimeo.
[61] Tetlock, P. C., 2 007. “Giving Content To Investor Sentiment: The Role Of Media In The
Stock Market,” Journal of Fina nce 62, 11391168.
[62] Tetlock, P. C., M. Saar-Tsechansky, and S. Macskassy, 2008. “More Than Words: Q ua nti-
fying Language To Measure Fir ms’ Fundamentals,” Journal of Finance 63, 14371467.
[63] Thornton, D. L. and Wheelock, D. C., 2014. “Making Sense of Dissents: A History of FOMC
Dissents,” Federal Reserve Bank of St. Louis Review, 9 6(3), 213-227.
[64] Woodford, Michael, 2013. “Fo r ward Guidance by Inflation-Targeting Central Banks,”
Columbia University Working Paper.
27

Table 1 : Magnitude of MPU Shocks: Comparison Across Identifications
GK Paper Updated GK GK with MPU Cholesky Sign External Instrument Estimation
Restriction Baseline MPU Human MPU Baseline ’94-’15
MPU (impact) ... ... 5.80 36.60 37.30 36.60 36.60 36.60
Interest rate (impact) 0.22 0.19 0.20 -0.01 0.11 0.07 0.05 0.10
Max drop in IP -0.34 -1.23 -1.11 -0.28 -1.12 -1.62 -1.09 -0.99
Month of max drop in IP 23 30 30 17 28 21 21 21
IP at horizion 12 -0.13 -0.70 -0.67 -0.17 -0.08 -1.45 -0.98 -0.85
Max drop in CPI -0.04 -0.11 -0.10 -0.14 -0.01 -0.13 -0.07 -0.16
Month of max drop in CPI 40 60 60 16 35 30 34 36
CPI at horizion 12 0.04 0.09 0.04 -0.08 -0.14 -0.01 - 0.03 -0.21
Impulse respon ses under the different VAR identification sch emes. The first two columns are from an identified monetary policy
shock in the four-variable VAR of Gertler and Karadi (2015). In the third column, MPU is added to the GK model and imp ulse
responses are to the GK monetary policy s hock. The remaining columns are impulse responses to identified MPU shocks in the
same five-variable VAR [ip
t
, cpi
t
, mpu
t
, i
t
, ebp
t
]. All estimates are over 1985:1-2015:12, except the final column which is
1994:1-2015:12.
28

Table 2 : Does FOMC Communication Influence MPU?
(1) (2)
Dissenting Votes (t − 1) 71.6
(1.15)
Statement Persistence (t − 1) −41
∗
−37.5
+
(−2.11) (−1.95)
Statement/Minute Uncertainty 597.8
(0.82)
Financial Uncertainty 148.8 164.5
+
(1.50) (1.71)
Macro Uncertainty −151.8 −170
(−1.38) (−1.58)
Geopolitical Risk 0.40
∗∗
0.41
∗∗
(5.07) (5.32)
Member Turnover 1.90
(0.32)
Constant 74.9 88
(0.78) (0.93)
Dummy 2008H2 Yes Yes
Chair Dummies Yes Yes
Adj. R
2
0.26 0.27
Number of Observations 128 128
Dependent variable: MPU at FOMC meeting interval, 1985-2015;
Dissenting Votes (1-meeting lag): percentage of dissenting votes in the previous meeting;
Statement Persistence (1-meeting lag): the similarity of statements between the previous and the current FOMC
meeting (Acosta, 2015);
Statement/Minute Uncertainty: p ercentage of words meaning uncertainty in FOMC statments and minutes over
the inter-meeting period;
Member Turnover : number of new membe rs on the FOMC at the current meeting.
Macro Uncertainty: Jurado, Ludvigson, and Ng (2013) measure of Macroeconomic Uncertainty (12 month hori-
zon);
Financial Uncertainty: Ludvigson, Ng, and Ma (2016) measure of financial uncertainty.
Geopolitical Risk Index: Caldara and Iacoviello (2 017) measure o f geopolitical conflict and terrorism based on
news releases.
29

Figure 1: Monetary Policy Uncertainty Index
Black Monday 9/11
Iraq
Invasion
QE1 QE2
Taper
Tantrum
Liftoff
Brexit
US
Election
0
50
100
150
200
250
300
350
400
Index (Avg = 100)
1985 1990 1995 2000 2005 2010 2015
Year
MPU index, mo nthly frequency (January 1985 - June 2017)
Figure 2: Human index vs. Computer index
Correlation = .84
0
50
100
150
200
250
300
350
400
450
Index (Avg = 100)
1985 1990 1995 2000 2005 2010 2015
Year
Monetary Policy Uncertainty Index
Human MPU Index
MPU index against human index
30
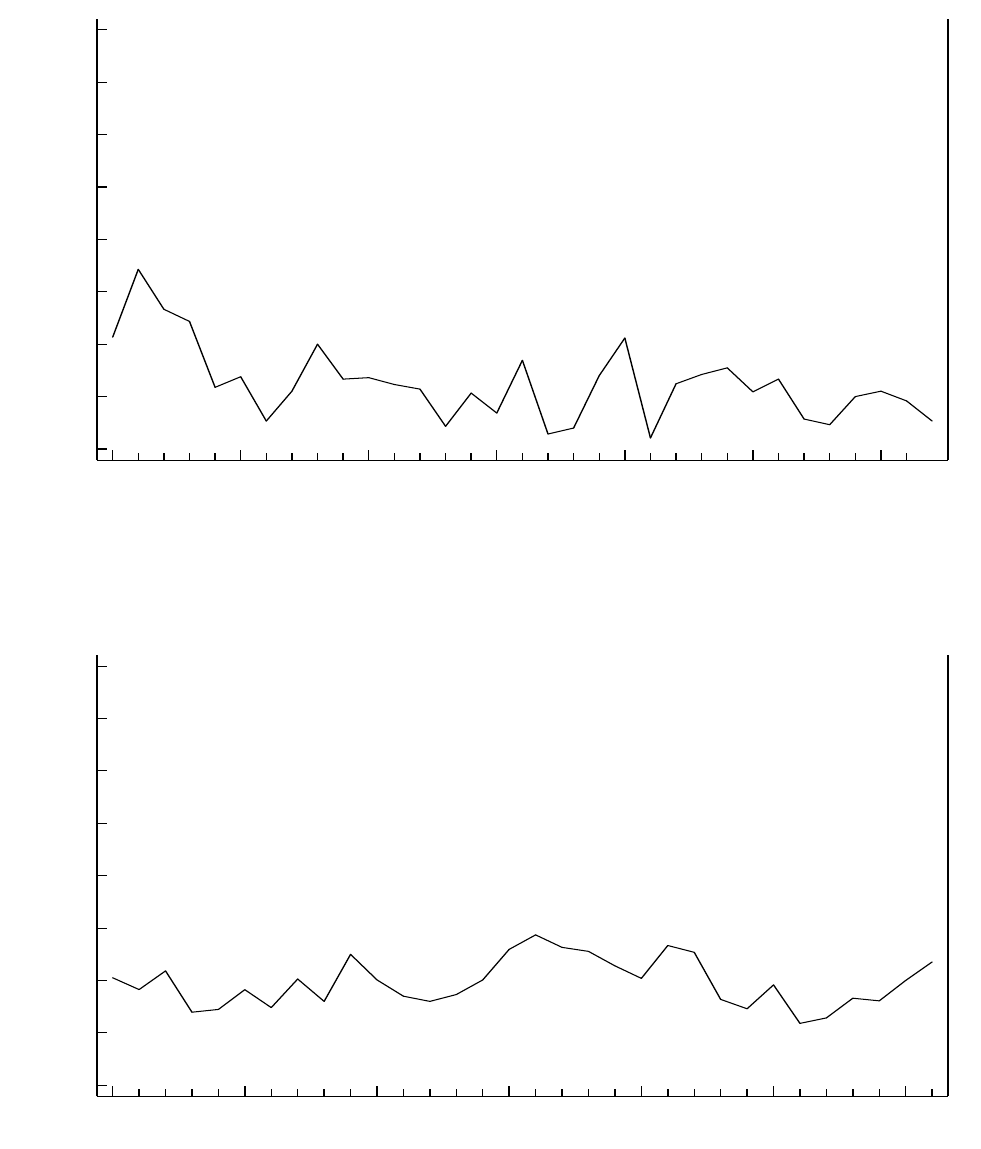
Figure 3: Type I error rate
Avg. Type 1 = .16
0.000
0.125
0.250
0.375
0.500
0.625
0.750
0.875
1.000
Percent
1985 1990 1995 2000 2005 2010 2015
Year
Type I error rate in MPU index
Figure 4: Type II error rate
Avg. Type 2 = .24
0.000
0.125
0.250
0.375
0.500
0.625
0.750
0.875
1.000
Percent
1985 1990 1995 2000 2005 2010 2015
Year
Type II error rate in MPU index
31

Figure 5: Monetary Policy Shock, GK External Instruments Identification
0 10 20 30 40
IP
-4
-2
0
2
0 10 20 30 40
CPI
-0.25
0
0.25
0.5
0 10 20 30 40
MPU
-30
0
30
60
0 10 20 30 40
1 Year Rate
0
0.3
0.6
0 10 20 30 40
EBP
0
0.25
0.5
Impulse responses to a monetary policy shock, identified using external instruments. The VAR is
Gertler a nd Karadi’s (2015) four-variable model, supplemented with our baseline MPU, estimated
over 1985:1-2015:1 2. Dashed lines represent 68 percent confidence bands.
32

Figure 6: MPU Shock, Cholesky and Sign Restrictions
0 10 20 30 40
IP
-0.5
-0.25
0
0 10 20 30 40
CPI
-0.3
-0.15
0
0 10 20 30 40
MPU
-20
0
20
40
0 10 20 30 40
1 Year Rate
-0.2
-0.1
0
0.1
0 10 20 30 40
EBP
-0.07
-0.035
0
0.035
0 10 20 30 40
IP
-4
-2
0
2
0 10 20 30 40
CPI
-0.8
-0.4
0
0.4
0 10 20 30 40
MPU
0
40
80
0 10 20 30 40
1 Year Rate
-0.4
0
0.4
0 10 20 30 40
EBP
0
0.25
0.5
0 10 20 30 40
IP
-4
-2
0
2
0 10 20 30 40
CPI
-0.8
-0.4
0
0.4
0 10 20 30 40
MPU
0
40
80
0 10 20 30 40
1 Year Rate
-0.4
0
0.4
0 10 20 30 40
EBP
0
0.25
0.5
Cholesky Sign Restrictions
Impulse responses to an MPU shock. The left panels are for a Cholesky decomposition. The far
right panels are the median, 16th and 84th percentile of the distributions for the sign restrictions
case (MPU, interest rate and EBP rise on impact). The middle panels display the Cholesky and
sign restriction cases together, absent confidence bands.
33

Figure 7: MPU Shock, External Instruments
0 10 20 30 40
IP
-0.006
-0.003
0
0 10 20 30 40
CPI
-0.001
0
0.001
0 10 20 30 40
MPU
0
0.1
0.2
0 10 20 30 40
1 Year Rate
-0.001
0
0.001
0 10 20 30 40
EBP
-0.002
0
0.002
Impulse respo nses to an MPU shock, ident ified using external instruments.
34

Correlation = .306
Correlation before 2008 = .75
0.00
0.03
0.06
0.09
0.12
0.15
0.18
Index
0
50
100
150
200
250
300
Index (Avg = 100)
2005 2006 2007 2008 2009 2010 2011 2012 2013
Year
Monetary Policy Uncertainty Index
Primary Dealers’ Uncertainty: Rate Next Meeting
Figure 8: MPU vs. Survey (FFR)
Correlation = .532
0.60
0.90
1.20
1.50
1.80
2.10
Index (Dealers’ Uncertainty)
50
100
150
200
250
300
350
Index (Avg = 100)
01/15 02/15 03/15 04/15 05/15 06/15 07/15 08/15 09/15 10/15 11/15 12/15 01/16
Year
Monetary Policy Uncertainty Index
Primary Dealers’ Uncertainty: Liftoff Timing
Figure 9: MPU vs. Survey (liftoff)
MPU index against uncertainty measures from FRBNY Survey of Primary Dealers
Figure 10: MPU index vs. Market-based Measure (1 year)
Correlation Overall = .107
Correlation Before 2008 = .274
0
50
100
150
200
250
300
350
Index
1995 2000 2005 2010 2015
Year
Monetary Policy Uncertainty Index
Uncertainty: 1Y Swaption Volatility 1M Ahead
MPU index against swaptions volatility, from Carlston and Ochoa (20 16)
35

Figure 11: MPU Index vs. sub-category EPU
Correlation = .546
0
50
100
150
200
250
300
350
400
450
Index (Avg = 100)
1985 1990 1995 2000 2005 2010 2015
Year
Monetary Policy Uncertainty Index
BBD Monetary Policy Index
Baseline MPU index against monetary policy sub-index o f Baker, Bloom, and Davis (2016).
Figure 12: MPU around FOMC Meetings
0
50
100
150
200
250
300
Index (Avg = 100)
−7 −6 −5 −4 −3 −2 −1 0 1 2 3 4 5 6 7
Days Before And After Meeting
Feb. 1994−Nov. 2008
Dec. 2008−Present
Daily MPU, before and after FOMC meetings. Average levels during two different sub-periods.
36

Figure 13: Response of Output to 50bps Rate Cut in Qua rter 20
0 5 10 15 20 25 30 35 40
Quarter
-0.05
0
0.05
0.1
0.15
0.2
0.25
Percentage points
equilibrium output
Complete market
IM Perfect foresight
IM Uncertainty
37

Online Appendix
A Baseline Index Construction
The MPU index reflects a ut omated text-search results fo r the newsstand edition of three major
newspapers: New York Times, Wall Street Journal, and Washington Post. We use the ProQuest
Newsstand database to search the electronic archives of each newspaper from January 1985
to January 2016 for terms related to monetary policy uncertainty. In particular, the search
identifies articles containing the triple of (i) “uncertainty” or “uncertain,” (ii) “monetary policy”
or “interest rate” or “Federal funds rate” or “Fed fund rate,” and (iii)“Federal Reserve” or “Fed”
or “Federal Open Market Committee” or “FOMC”. Based on these search criteria, we count in
each newspaper how many articles contained the search terms above every day.
To deal with changing volume of newspap ers over time, we norma lize as follows. First, we
divide, for each newspaper, in every inter-meeting period, t he raw count of articles related to
monetary policy uncertainty by the total article count mentioning the Fed. For each newspaper
i in period t, we calculate the share of articles containing monetary policy uncertainty terms as
n(i, t) =
#mpu
articles(i, t)
#Fed articles(i, t)
.
We then normalize the share of articles so that, for each newspaper, the resulting series has a
standard error o f one over the sample period. This normalization controls for the possibility that
different newspapers mention monetary policy uncertainty with different frequency over time.
That is, we denote the normalized share of articles using
nn(i, t) =
n(i, t)
stdev(n(i, 1985 : 2015))
.
Finally, we sum the nn(i) series across newspapers and scale them so that the average value
is 100 over the sample period. The scaling produces our monetary policy uncertainty index,
denoted as MPU:
MP U(t) =
P
i
nn(t)
avg(
P
i
nn(1985 : 2015))
× 100.
A human reading of a sample of the a rticles suggests that the news-based approach used to
construct the index can provide a reasonable indicator of monetary policy uncertainty. Newspa-
pers typically cite uncertainties related to monetary policy in one of the following cases:
• Newspaper articles comment on the uncertainty resulting from Federal Reserve actions.
For example, “FOMC reserve injection during the day is reversed at the overnight closing
time to achieve an artificial 5.25%. This target Fed f unds chicanery leaves the financial
market with considerable uncertainty.”
38
• Newspaper articles discuss the implications of uncertainty regarding the Federal Reserve
actions for the real economy and stock markets. For example, “Traders last week blamed
uncertainty about the FOMC for the sharp ups and downs on the New York Stock Ex-
cha ng e.”
• Newspaper articles analyze uncertainties at ho me and abroad that affect monetary policy.
For example, “Given the inherent uncertainty about future developments, policy actions
often importantly depend on the flow of new information and the FOMC’s judgment about
its implications.” “There are significant uncertainties about the Fed moving to boost the
cost of borrowing in the U.S. as China’s economy has r un int o trouble and as financial
markets have suffered significant losses.”
• Newspaper articles quote policy-makers, economists, political leaders, or industry experts
who refer to uncertainties in relatio n to monetary policy in their speeches or interviews.
For example, “The Federal Open Market Committee, the centr al bank’s top policymaking
group, blamed the slowdown in growth largely on falling stock prices and ‘heightened
uncertainty related to problems in corpo rate reporting and governance’.”
39
B Additional data checks
Saiz a nd Simonsohn (2013) propose a number of data checks to examine whether an index is a
useful proxy for the phenomenon of interest. We follow these conditions and check the validity
of our index below.
1. Do the different queries maintain the phenomenon and keyword constant?
Following Saiz and Simonsohn (2013), two data checks are used to assess the validity of this
premise. First, we verify that our MPU index is expressed in terms of a r elat ive frequency.
Second, the keyword chosen be more likely t o be employed following the occurrence than
the non-occurrence of t he phenomenon of interest. We verify this by calculating that 85% of
the randomly selected articles fr om set M (i.e., those included in our computer-a ut omated
index).
2. Is the variable being proxied a frequency?
Our index is a f r equency.
3. Aft er sampling the contents of documents found: is the keywo rd employed predominately
to discuss the occurrence rather than non-occurrence of phenomenon?
We verify this in our human auditing: 85% of the randomly selected articles from set M
(i.e., those included in our computer-automated index).
4. Is the average number of documents found large enough for variation in document-frequency
to be driven by factors other than sampling error?
We verify this in two ways. First, we gain confidence in our human audit that (i) the
average number documents found is sufficiently large for meaning variations and (ii) our
index spike up on the days of notable events that are associated with rising monetary policy
uncertainty, for example, 2003 Iraq invasion, 2013 Taper Tantrum, and 2015 December
liftoff uncertainty, not only on the monthly basis but also on a daily frequency.
5. Is the expected variance in the occurrence-frequency o f interest high enough to overcome
the noise associated with document-frequency proxying?
Saiz and Simonsohn (2013) argue that one likely source of measurement error is keywords
with multiple meanings leading to false positives; that is, to documents that do contain
the key words but which are not actually about the phenomenon of interest. This can be
easily fixed by replacing a keyword for a synonym with fewer other meanings. Our human
audit and, in particular, our analysis of the error rate, show small measurement errors in
our index and help alleviate this concern. In fact, our reading of both set M (those articles
included in MPU index) and set E (a la rger set that contains only words in category (iii))
suggests tha t our MPU index is rather conservative because of relatively restrictive search
criteria.
40
6. Aft er inspecting the content of the documents found: does the chosen keyword have as its
primary or only meaning the occurrence of the phenomenon o f interest?
The final aspect of data checks deals with a possible correlation of the index with covar iates
of other variables of interest: conditioning on occurrence-frequency, document-frequency
should be uncorrelated with the covariates of interest (Saiz and Simonsohn (2013)). We
address this by (i) scaling our index by the number of articles mentioning Fed (see more
details in data check #8) and ( ii) showing that our index is not correlated with other majo r
economic outcome variables.
7. Aft er inspecting the content of t he documents f ound: does the chosen keyword also result
in documents related to the covariates of the occurrence of interest?
See our response for data check #8.
8. Are there plausible omitted variables that may be correlated both with the document-
frequency and its covariates? If so, contro l for the omitted variable with an additional
placebo document-frequency variable.
We control for the potentially time-varying public attention on Federal Reserve (that may
or may not be unrelated to uncertainty) by scaling our index by the total number of articles
each month mentioning the Fed. In so doing, we control for the time variation in the volume
of newspaper articles as well as that in concerns about the Federal Reserve in general. This
is also a key difference between our index and that constructed by Baker, Bloom, and Davis
(2016).
C The Survey of Primary Dealers index details
For each dealer i in period t, we use Er(i, t) to denote the expected value of the interest rate at
the upcoming meeting, calculated as the policy rate in pla ce prior to the survey r(t − 1) plus t he
exp ected change in the policy rate computed from the possibilities each dealer i assigned to the
pre-specified bins (b = {1, · · ·, n}):
Er(i, t) = r(t − 1) +
n
X
b=1
P r(b, i)d(b)
where d(b) denotes the value of a possible rate change specified in each bin, for example, 0,
+/ − 25 bps, or +/ − 50 bps; and P r(b, i) is the probability dealer i assigned to each bin b.
For the policy rate set two meetings ahead, we calculate dealer i’s expected rate as his
own expected rate a t the upcoming meeting plus the expected change in the policy rate two
meetings ahead computed from the bins. That is, we replace the actual policy rate prior to the
survey r(t − 1) by Er(i, t) in the expectatio n calculation. By the same token, we use dealer i
′
s
41
own expected po licy rate two meetings ahead as the basis to compute his expectation for three
meetings ahead.
The degree of uncertainty perceived by dealer i for m = {1, 2, 3} meetings ahead, denoted by
U(i, m), is calculated as the standard deviation of his for ecasted r ate for m meetings ahead. The
uncertainty measure in period t for m meetings ahead is then the avera ge of all the uncertainty
measures for the dealers m meetings ahead. The disagreement measure for m meetings ahead is
the standard deviation of the expected policy rate m meetings ahead among the dealers.
Finally, there is time variation in the survey questions. There are questions about the target
interest rate only from February 2005 through September 2012. As the Fed Funds rate reached
the ZLB and forward guidance ramped up, uncertainty about the interest rate fell to zero quickly.
This question was dropped after September 2012 presumably b ecause it did not provide useful
information during the ZLB. In addition, the po ssible bins given in the survey question evolve
with the level of the target policy rate. For example, at the beginning of the sample when a
reduction in the target rate was unlikely, the possible bins were restricted to a change of 0,
an increase of 25 basis points, and an increase o f 50 basis points. Such time variation in the
bins should not affect the consistency of our measure because we assume that survey questions
are tailored to real possibilities. That is, the probability a ssociated with, say a decrease of 25
basis points for any respondent in this period would be approximately zero anyway, so the fact
that they were not asked this does not change the expected value or dispersion of the perceived
target. The survey question appropriately added increasingly drastic negative changes in the
target rate during the onset of the financial crisis. Finally, the survey question changed format
in 2009. Instead of asking about t he likelihood of an increase or decrease of a certain number
of basis points from the current target, the survey asked about the likelihood of maintaining a
certain target rat e (0 − 25 bps, 25 bps, 50 bps, 75 bps). Using the mean/median of 0 − 25 bps
as the point forecast for the first bin, it is straightforward to see that the former question and
the updated question for the ZLB are mathematically equivalent.
D Baker, Bloom, and Davi s’ (2016) Monetary Policy sub-
index of EPU
We begin by noting the relatively low correlation between MPU-HRS and MPU-BBD, which
is .49 over the full sample and (.31) a fter 2008. Their index has more pronounced spike-ups
than ours early in the sample, remained well below average throughout 2014 and into 2015, and
is subdued relative to our index during the October 2015, December 2015, and January 2016
FOMC meeting intervals.
To try and understand this, we first examine the role o f scaling. The correlation between
MPU-HRS and MPU-(HRS terms, HRS papers, BBD scaling) is .85 (.92, post-2008). The
correlation between MPU-BBD and MPU-(HRS terms, HRS papers, BBD scaling) is .46 (.46) .
42
These two cases, against the backdrop of the weak correlation between MPU-HRS and MPU-
BBD, indicate tha t scaling does not ma tter much: in the former, we see that changing MPU-HRS
only by adopting the BBD scaling maintains a high correlation with MPU-HRS, while the latter
case indicates that this same strategy change leaves the resulting index weakly correlated with
MPU-BBD.
Second, we examine the role of the keyword search. The correlation between MPU-HRS and
MPU-(BBD terms, HRS papers, HRS scaling) is .75 (.76 ) , while that between MPU-BBD and
MPU-(BBD terms, HRS papers, HRS scaling) is .42 (.57). These two cases tell us that changing
terms matters a little bit more than scaling. That is, the former says that changing MPU-HRS
only by using the BBD keyword search leaves a decently high cor r elat ion with MPU-HRS, though
not super high, while in the latter case we learn that changing MPU-HRS only to use the BBD
keywords leaves the resulting index weakly correlated with MPU-BBD (though notably higher
post-2008).
Third, and finally, we examine MPU-HRS vs. MPU-(BBD terms, HRS papers, BBD scaling),
and find correlations of .62 (.68), and MPU-BBD vs. MPU-(BBD terms, HRS pa pers, BBD
scaling) with correlations of .39 (.72). These last two cases are more difficult to assess. For the
most part they suggest that if all BBD were to do was use only our smaller set of newspapers,
there wo uld be a decent correlation with our MPU-HRS index and in the full sample period a
poor correlation with what they compute from using the large set of newspapers. This indicates
that newspaper choice matters. Baker, Bloom, and Davis (2016) use the Access World News
database of over 2,000 newspapers, while we use the three major U.S. newspapers that are more
tailored to national financial news.
We conclude from our reconciliation analysis that in or der o f importa nce, the factors explain-
ing the weak correlation between MPU-HRS and MPU-BBD can be ranked: (1) Newspapers, (2)
Keywords, and (3) Scaling. Given their significantly larger set of search terms a nd newspapers,
it is likely that theirs captures a relatively larger global factor while ours is more U.S. centric.
E Proximate Determinants of MPU
E.1 Dissenting votes
The Federal Open Market Committee consists of the seven Federal Reserve governors and five
Federal Reserve Bank presidents on a rotating basis. The FOMC ordinarily meets eight times
per year and at each meeting votes on a directive that governs monetar y po licy during the period
between meetings. The policy directives are usually supported by a strong majority but voting
often involves dissent (Figure E.2). Dissent could reflect fundamental disagreement about how
to achieve the Committee’s objectives and could potentially represent shocks to the preferences
of the monetary authority. The FOMC dissenting votes have been revealed in the postmeeting
statements only since March 2002. However, they have been included in the minutes since the
43
mid 1 990s. Recalling that we lag dissenting votes by one period, it is not ill-designed to examine
the relationship with MPU before March 2002.
In the first r ow of Table 1 , we show t ha t there is a positive correlation between the percentage
of FOMC dissenting votes at one meeting and the level of MPU during the following inter-meeting
period. A “united front” of the FOMC participants does seem to convey to the public t hat a
sudden deviation from the central bank’s reaction function due to preferences shocks is unlikely
in the near term. The effect is not particularly significant, however.
E.2 Statement persistence
The Federal Open Market Committee’s postmeeting statements constitute one of the key vehicles
through which the Committee communicates its assessment of the economy, its policy actions,
and its thinking about future policy. In February 1994, Chairman Greenspan issued the first
postmeeting statement following the FOMC’s decision to tighten monetary policy – the first
increase in the t arget federal funds rate since 1989. For the next five years, a statement was
released o nly after meetings in which the FOMC decided to change rates, but in May 199 9 the
committee began releasing statements at the conclusion of every meeting.
Using techniques developed in computational linguistics, Meade and Acosta (20 15) construct
a measure of how persistent the content of the statements has been, by calculating the correlation
(similarity) of words used in two consecutive postmeeting statements. If identical words are used
in consecutive FOMC statements, ignoring changes in wor d order, t he similarity will equal unity.
The addition or subtraction o f words or the use of the same words in different proportions will
reduce similarity between consecutive meetings.
The Meade-Acosta measure of statement persistence is displayed in Figure E.3, along with
MPU. Meeting-to-meeting similarity rose between May 1999 through mid-2007. It then fell to
an historic low (below 0.20) between the October 2008 and December 2008 meetings when the
FOMC reduced the Fed Funds target rate to a range of 0 to 1/4 percent a mid a widening crisis.
Average persistence declined during the financial crisis and then rose to a very high level through
2014.
As shown in Table 1, we find a negative correlation between persistence in FOMC statements
(from the previous meeting to the current) and monetary policy uncertainty perceived by the
public ( r egarding the period up to the next meeting). When the semantic content of FOMC
statements from one meeting to the next is similar, the public seems to perceive little change in
the central bank’s policy stance and projects limited uncertainty going forward.
E.3 Uncertainty perceived and conveyed by the central bannk
“Part of the g ame is confidence, and looking clueless and uncertain doesn’t help.”
— Ben Bernanke (2015)
44

We conjecture that the public’s uncertainty regarding monetary policy is influenced by the
degree of uncertainty the Federal R eserve itself perceives and conveys. To examine this, we
construct indicators of uncertainty conveyed in publicly archived FOMC documents including
statements, minutes, testimony, speeches, and the Chair’s postmeeting press conferences. We use
automated text-search to calculate the frequency of words that suggest uncertainty, including
synonyms that are taken from a thesaurus.
30
Consistent with our conjecture, Table 1 shows
that the degree of uncertainty conveyed in FOMC statements and minutes, displayed in Figure
E.1, is positively correlated with contemporaneous monetary policy uncertainty that the public
perceives, but only weakly so. Uncertainty conveyed in FO MC speeches and testimonies is also
only weakly correlated with MPU.
E.4 FOMC member turnover
A significant turnover of FOMC members may lead to unanticipated changes in the central
bank’s p olicy stance and introduce disparate and unknown voices at the Fed, making it difficult
to convince the public with a coherent monetary policy message. Our measure of member
turnover is the number of FOMC participants leaving or joining the FOMC for the first time
at the current meeting. The coefficients on FOMC member turnover in Table 1 are positive a s
exp ected and yet only occasionally significant. One main challenge of identifying the effects of
personnel turnover is that such changes are typically anticipated ahead of time (e.g., the recent ly
announced resignation of Governor Tarullo will take place a couple o f months hence), and it is
difficult t o pinpoint when turnover becomes public knowledge. Thus, we do not consider the
lack of statistical significance here as dismissing the role of FOMC member turnover in affecting
monetary policy uncertainty.
E.5 Endogeneity
Although we are careful about temporal considerations in correlating our measures with MPU
in Table 1, and despite the intuitive appeal of the resulting correlations, inference is complicated
by concerns of simult aneity and omitted facto r s. There likely exists hard-to-measure forces, each
with varying degrees of quiescence, which simultaneously create, e.g., more monetary policy un-
certainty and less agreement among FOMC members about policy prescriptions. We attempt
to make progress by controlling for (reasonable proxies o f) such hard-to-measure forces. To this
end, we employ measures of U.S. macroeconomic uncertainty and financial uncertainty, geopolit-
30
Uncertain, ambiguous, ambivalent, dubious, erratic, hazy, hesitant, insecure, precarious, questionable, r isky
(this does no t include the noun risk), unclear, undecided, undetermined, unpredictable, unreliable, unresolved,
unsettled, unsure, and vague (and their derivatives). We sum instances of these words on a document-by-document
basis and divide this raw count by the number of total words in the release. In the case of minutes and statements,
the resulting observation is just an addition of these two measures on a mee ting-date basis. In the case of the
speeches and testimony, this is the summed linear co mbination of all of the speeches and testimony observations
in the inter-meeting period.
45

ical risk, U.S. defense spending shocks, and U.S. natural disasters. The potential importance of
macro or financial uncertainty speaks for itself: uncertainty about FOMC policy actions could
be high when the basis on which policy is made, the current and expected future state of the
U.S. economy, is perceived as highly uncertain. The appealing featur e of the latter three controls
is that they ar e arguably orthogonal to the error terms in the MPU regressions that contain only
the FOMC institutional/procedural variables. We briefly describe these controls in the following
sub-sections.
E.5.1 Macroeconomic uncertainty and financial uncertainty
Imperfect information about the current and expected future state of the economy is another
source of uncertainty regarding central bank policy. There is measurement error in the prelim-
inary data available to the FOMC at the time it makes decisions. The actual position of t he
economy at any t ime is only partially known, as key information on spending, production, and
prices becomes available only with a lag (and is furthermore continuously revised). Therefore,
policy makers must rely on estimates of these economic variables when assessing the appropriate
course of policy, aware that they could act on the basis of incomplete or misleading informa-
tion. Uncertainty about policy actions could be high when the basis on which policy is made is
perceived as highly uncertain by the public. This in turn could be correlated with, e.g., FOMC-
revealed uncertainty. To control for this, we use the macroeconomic uncertainty measure of
Jurado, Ludvigson, and Ng (2015), an econometric estimate of whether the economy has become
less or more predictable, and the financial uncertainty measure of Ludvigson, Ma, and Ng (201 6),
which is also estimated – from an iterative projection instrumenta l variables method.
31
Cont emporaneous uncertainty about the fina ncial state of the economy is positively, and often
significantly, correlated with MPU. On the other hand, macroeconomic uncertainty cont r ibutes
to uncertainty the public perceives about mo netar y p olicy in a way that is unstable over time.
Prior to 2008, the estimated relationship (not displayed) is positive irrespective of o t her controls
in the regression, while in the regressions that go through 2015 the estimate is negative and
sometimes significantly so.
E.5.2 Geopolitical risk, U.S. Defense spending shocks, and U.S. natural disasters
The geopolitical risk index (Caldara and Iacoviello 2017) is calculated using a methodology simi-
lar to t hat used in constructing our MPU index. They search over 11 major U.S. and British news-
papers for mentions of the words: geopolitical risk(s), concern(s), tension(s), uncertainty(ies),
wa r risk(s) (or risk(s) of war) and military threat(s), as well as mentions of terrorist threat(s).
Our expectation that geopolitical risk will be positively correlated with MPU is confirmed, and
31
We use their 12-month ahead measures as this is a better conceptual match with our MPU than the 1 -month
or 3-month horizons. Results are quite similar irrespective of which of their horizon-measures we use. We also
find robustness to using Scotti’s (2013) alterna tive measure of macroeco nomic uncertainty.
46

indeed we see that it is quite significant statistically as well.
Ramey (2011) constructs a measure of news abo ut future government spending, by reading
news sources to gather quantitative information about expectations. Her defense news va r iable
measures the expected discounted value of government spending changes due to foreign political
events. The series was constructed by reading periodicals (e.g., Business Week) in order to gauge
the public’s expectations. According to Ramey, the constructed series should be viewed as an
approximation to the changes in expectations at the time. In calculating present discounted
values, she used the 3-year Treasury bond rate prevailing at the time. We estimated all of our
regressions with Ramey’s measure included. These specifications never produced estimates o f
her variable with a t-statistic greater than 0.50, and never had any material effect on the other
estimated coefficients, so we do not report these results.
As a final control, we construct a measure of fatalities resulting from notable natural disasters
that occurred in the United States. These include cyclones (Rita, Katrina), tornadoes, hurricanes,
floods, blizzards, snow storms, earthquakes, a nd heat waves.
32
We expect this also to be po sitively
correlated with monetary policy uncertainty. In this case too, the estimated coefficient s are not
significant.
E.5.3 Instrumental variables
All of the OLS estimates displayed in Table 1 convey a consistent message: there is an important
association between FOMC communications and monetary policy uncertainty, even when con-
trolling for reasonable proxies o f omitted factors that might account for some of this relationship.
Of course, these additional controls are not playing the role of instruments. Hence, we also es-
timated regressions for MPU using both two- stage least squares (2SLS) and limited-information
maximum likelihood (LIML). We tried a variety of instruments, alone and in combination with
each other, including first lags of each of the X variables and each of our control variables Z
t
(as well as the first lag of macro uncertainty). We found that these instruments a re “weak”,
however, leaving us without reliable IV estimates.
33
Angrist and Kr euger (2 001) note that finding good instruments is difficult in practice. They
do discuss the popularity of using instrument s derived from “natural experiments”. Analogous
randomized experiments are not likely in our application, however. Just as it is not feasible to
coerce a ra ndo mly chosen group of people, e.g., to quit smoking, randomization in something
like the semantic content of FOMC statements is unthinkable.
32
https://en.wikipedia.or g/wiki/List
of natural disasters in the United States.
33
For example, in the 2SLS estimates we typically found F-statistics from first stage regressions in the neigh-
borhood of 1.0 to 3.5 or lower, well below the recommended cutoff of 10 (Stock and Yogo (2005)). The most valid
instrument, unsurprisingly, was lagged macro unce rtainty instrumenting for itself.
47

E.6 Proximate determinants: plots of the series
The following three figures depict some of the variables described above, namely: “ FOMC-
revealed uncertainty” (against MPU), (ii) dissenting votes, and (iii) FOMC statement persistence
(against MPU).
Figure E.1: MPU and FOMC-Revealed Uncertainty
Correlation = .166
0
50
100
150
200
250
300
350
Percentage of uncertainty words
0
50
100
150
200
250
300
350
Index
2005 2006 2007 2008 2009 2010 2011 2012 2013 2014 2015
Year
Monetary Policy Uncertainty Index
Uncertainty In FOMC Statements and Minutes
Baseline MPU index against the our measure of uncertainty revealed in FOMC Stat ements and
Minutes.
48

Figure E.2: D issenting Votes
0 50 100 150 200 250 300
Monetary Policy Uncertainty
0
1
2
3
Dissenting Votes
Excludes Outside Values
Baseline MPU index against the percentage of FOMC members voting against the Committee
decision.
Figure E.3: MPU and Statement Persistence
Correlation Overall = −.34
Correlation Before 2008 = −.36
0.00
0.20
0.40
0.60
0.80
1.00
1.20
Persistence
0
50
100
150
200
250
300
Index
1999 2002 2005 2008 2011 2014
Year
Monetary Policy Uncertainty Index
Similarity of Consecutive FOMC Statements (Acosta)
Baseline MPU index against similarity of FOMC statements from meeting to meeting (Meade
and Acosta (2015)).
49

F VAR Robustness: alter native measures of mone tary
pol icy u ncertainty
Figure F.1: Monetary Policy Shock, G K External Instruments Identification, MPU-BBD
0 10 20 30 40
IP
-2
0
2
0 10 20 30 40
CPI
-0.5
-0.25
0
0.25
0 10 20 30 40
MPU-BBD
0
60
120
0 10 20 30 40
1 Year Rate
-0.2
0
0.2
0.4
0 10 20 30 40
EBP
0
0.3
0.6
See notes to Figure 5.
50
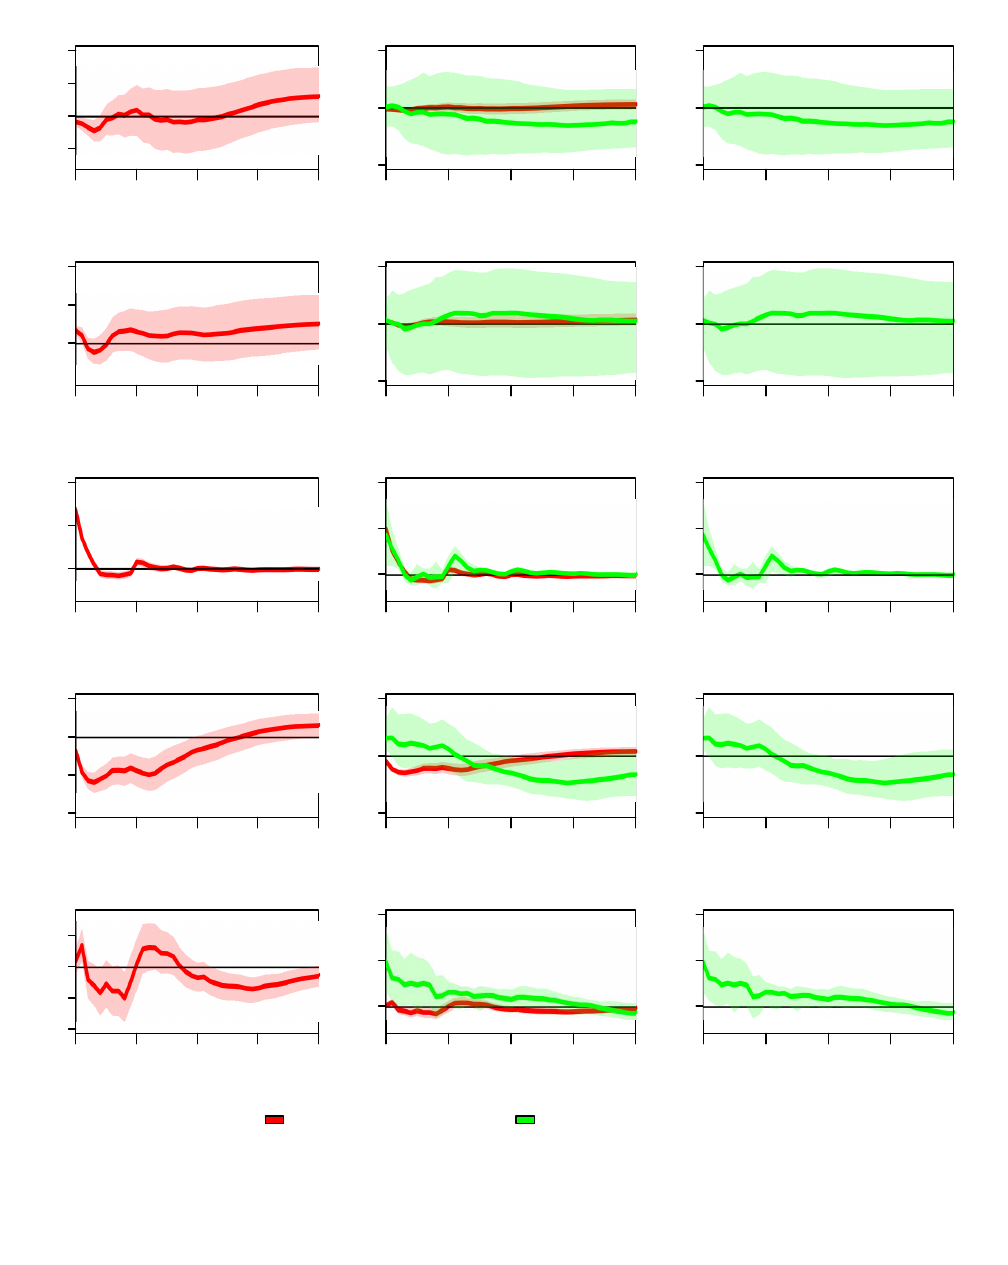
Figure F.2: MPU Shock, Cholesky and Sign Restrictions, MPU-BBD
0 10 20 30 40
IP
-0.2
0
0.2
0.4
0 10 20 30 40
CPI
0
0.1
0.2
0 10 20 30 40
MPU-BBD
0
30
60
0 10 20 30 40
1 Year Rate
-0.2
-0.1
0
0.1
0 10 20 30 40
EBP
-0.06
-0.03
0
0.03
0 10 20 30 40
IP
-2
0
2
0 10 20 30 40
CPI
-0.7
0
0.7
0 10 20 30 40
MPU-BBD
0
40
80
0 10 20 30 40
1 Year Rate
-0.4
0
0.4
0 10 20 30 40
EBP
0
0.2
0.4
0 10 20 30 40
IP
-2
0
2
0 10 20 30 40
CPI
-0.7
0
0.7
0 10 20 30 40
MPU-BBD
0
40
80
0 10 20 30 40
1 Year Rate
-0.4
0
0.4
0 10 20 30 40
EBP
0
0.2
0.4
Cholesky Sign Restrictions
See notes to Figure 6.
51

Figure F.3: MPU Shock, External Instruments, MPU-BBD
0 10 20 30 40
IP
-0.006
-0.003
0
0 10 20 30 40
CPI
-0.001
0
0.001
0 10 20 30 40
MPU-BBD
0
0.1
0.2
0 10 20 30 40
1 Year Rate
-0.001
0
0.001
0 10 20 30 40
EBP
-0.0006
0
0.0006
0.0012
See notes to Figure 7.
52

Figure F .4: Monetary Policy Shock, GK External Instruments Identification, mar ket-based MPU
0 10 20 30 40
IP
-2
0
2
0 10 20 30 40
CPI
-0.5
-0.25
0
0.25
0 10 20 30 40
MPU-Market
-40
-20
0
20
0 10 20 30 40
1 Year Rate
-0.4
-0.2
0
0.2
0 10 20 30 40
EBP
0
0.35
0.7
See notes to Figure 5.
53

Figure F.5: MPU Shock, Cholesky and Sign Restrictions, MPU-BBD
0 10 20 30 40
IP
-0.7
-0.35
0
0 10 20 30 40
CPI
-0.2
0
0.2
0 10 20 30 40
MPU-Market
-20
0
20
0 10 20 30 40
1 Year Rate
-0.1
-0.05
0
0 10 20 30 40
EBP
0
0.05
0.1
0 10 20 30 40
IP
-2
0
2
0 10 20 30 40
CPI
-0.7
-0.35
0
0.35
0 10 20 30 40
MPU-Market
-40
0
40
0 10 20 30 40
1 Year Rate
-0.3
0
0.3
0 10 20 30 40
EBP
0
0.2
0.4
0 10 20 30 40
IP
-2
0
2
0 10 20 30 40
CPI
-0.7
-0.35
0
0.35
0 10 20 30 40
MPU-Market
-40
0
40
0 10 20 30 40
1 Year Rate
-0.3
0
0.3
0 10 20 30 40
EBP
0
0.2
0.4
Cholesky Sign Restrictions
See notes to Figure 6.
54

Figure F.6: MPU Shock, External Instruments, market-based MPU
0 10 20 30 40
IP
-0.004
-0.002
0
0.002
0 10 20 30 40
CPI
-0.001
0
0.001
0 10 20 30 40
0
0.045
0.09
0 10 20 30 40
1 Year Rate
-0.001
0
0.001
0 10 20 30 40
EBP
-0.001
0
0.001
See notes to Figure 7.
55

Figure F.7: MPU Shock, External Instruments, Baseline MPU 1994-2 015
0 10 20 30 40
IP
-0.004
-0.002
0
0.002
0 10 20 30 40
CPI
-0.001
0
0.001
0 10 20 30 40
MPU
0
0.1
0.2
0 10 20 30 40
1 Year Rate
-0.001
0
0.001
0 10 20 30 40
EBP
-0.001
0
0.001
See notes to Figure 7.
56
