
THE EFFECTS OF INCOME ON THE ECONOMIC WELLBEING OF FAMILIES
WITH LOW INCOMES: EVIDENCE FROM THE 2021 EXPANDED CHILD TAX
CREDIT
By Natasha Pilkauskas, Katherine Michelmore, and H. Luke Shaefer
KEY FINDINGS
• Across six months in 2021, families reported using the monthly
Child Tax Credit (CTC) on bills, other household expenses, and
child-related expenses.
• We find robust evidence that the CTC reduced the overall num-
ber of material hardships experienced by families, particularly
food insecurity.
• Other evidence suggests that the monthly CTC reduced medical
hardships, inability to pay utility bills, and reliance on friends
and family for food.
• We do not find a statistically significant relationship between the
employment behaviors of families in our study and the monthly
CTC benefit.
INTRODUCTION
Interest in basic income and unconditional cash transfers as a
means of improving well-being has grown substantially over the last
few years in the United States. There remains much to learn about
the causal effects of unconditional cash transfers despite a large
evidence base suggesting that income
1, 2, 3
, in-kind policies
4, 5, 6
, and
earnings supplements
7, 8, 9
improve well-being.
New evidence from randomized control trial studies of unconditional
cash transfers find modest to null effects on material well-being
10,
11, 12, 13
, raising further questions about the causal link between cash
transfers and material well-being. In contrast, a small but growing
set of studies of a universal, recurring monthly unconditional cash
transfer to families with children – the 2021 monthly Child Tax
Credit (CTC) – suggests this policy improved the material well-being
of families with children
14, 15, 16
.
In this brief, we add to this growing literature by summarizing
the findings of a new study of the 2021 monthly Child Tax Credit.
Unlike earlier research, our study focuses on families with very
low incomes, those living in poverty. Using quasi-experimental
techniques, we find robust evidence that the 2021 monthly CTC
improved families’ material well-being and had little to no impact on
their employment.
THE 2021 CHILD TAX CREDIT
In March 2021, Congress passed the American Rescue Plan Act,
temporarily expanding the Child Tax Credit. This temporary
expansion increased the size of the benefit (including a larger benefit
for children under age 6), extended eligibility to households with
little or no earnings, and made the credit fully refundable. Finally,
half of the credit was disbursed monthly for the final six months of
2021, while the remaining balance was delivered as a lump sum at
tax time in early 2022. Removing the earnings minimum and making
the credit fully refundable made 26 million children eligible for a
larger credit — 6 million of whom were entirely ineligible before the
reform because their families’ earnings were too low
17
. Our study
focuses on these children, those at the lowest end of the income
distribution and who have historically been excluded from the full
benefits of the CTC.
THE DATA AND APPROACH
Poverty Solutions partnered with Propel, creators of the Providers
app, which helps more than 5 million families manage their
Supplemental Nutrition Assistance Program (SNAP) benefits,
encompassing about one-quarter of all SNAP users. Every month,
Propel invites a random national sample of its users to take an
online survey on a variety of topics related to household financial
well-being, including a number of questions related to the expanded
CTC. Roughly 4,000-6,000 users respond to the survey each month
from all 50 states, about half of whom live in households with
children under the age of 18 — the focus of our study. We use data
from surveys conducted between June 2021 and January 2022 to
study the effects of the 2021 monthly CTC on the economic well-
being of families with children.
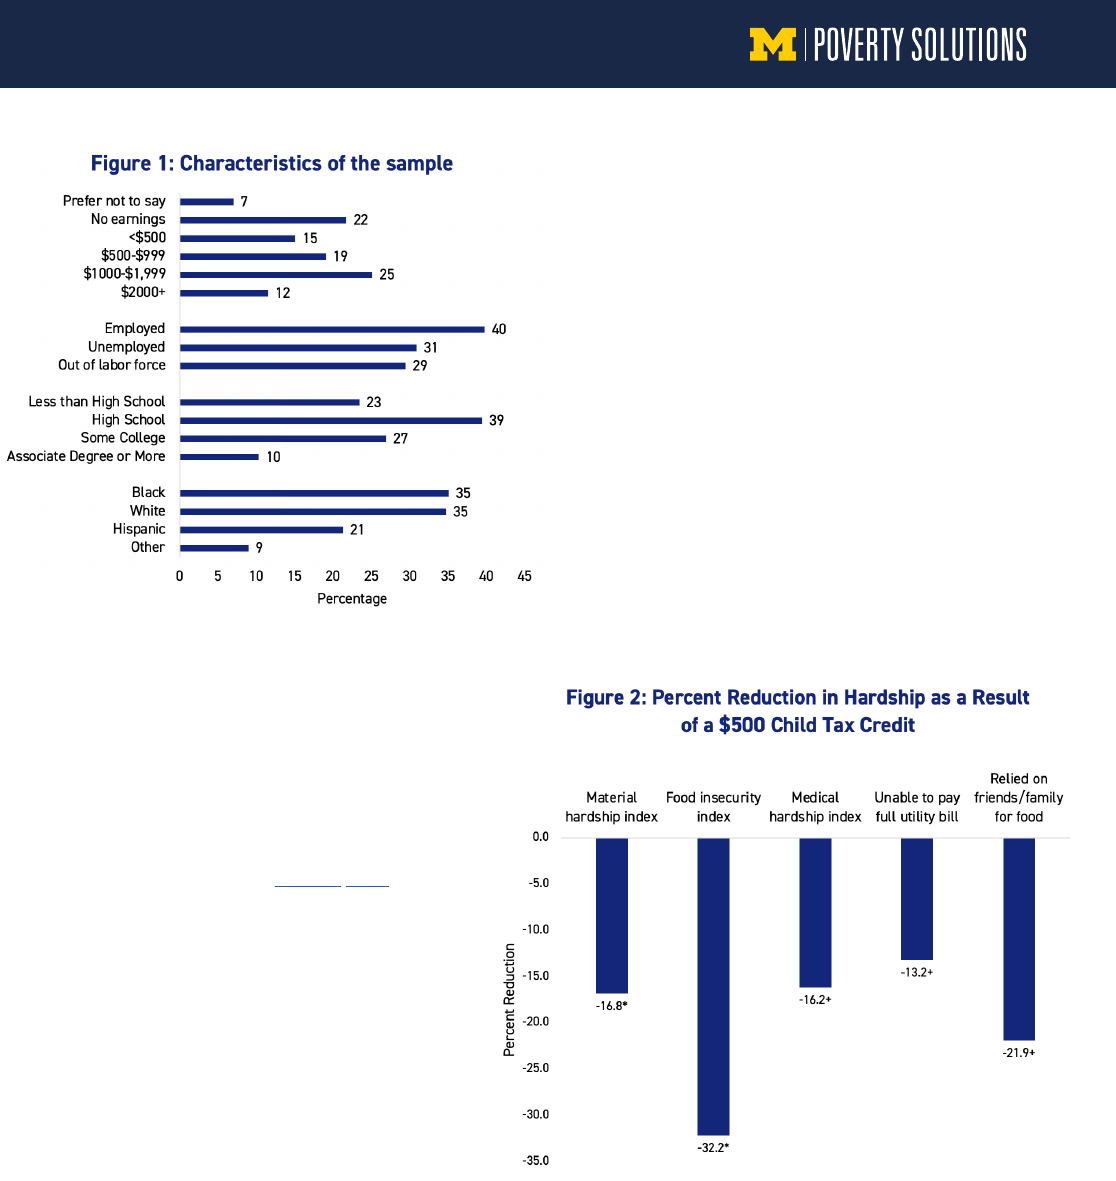
Figure 1 provides information on the characteristics of parents in
our study sample. Monthly earnings of families are very low: 22%
reported having no household earnings and another 15% had less
than $500 in monthly earnings. Additionally almost one-third of
parents were unemployed and another 29% were out of the labor
force. Sixty-two percent of parents in our study have a high school
degree or less. The sample is racially diverse: 35% of parents are
Black, 35% are White, 21% are Hispanic and 9% report an “other”
race/ethnicity.
September 2022
1
We compare families before and after the implementation of the
credit, using differences in the number and ages of children to
estimate the impacts of the monthly credit on families with
low incomes. In this brief, we present our estimates of the
impacts of the expanded CTC based on our most conservative
statistical modeling approach
18
. We have the most confidence
in our findings that are substantively similar and statistically
significant across our statistical modeling approaches. We
refer to these as “robust.” When the results are similar but not
significant across all models, we say they are “suggestive.”
As we have documented in previous research briefs
19, 20
, many
families did not receive the monthly CTC (only 66% in this
sample). Here we estimate the impact of the CTC for those who
did receive the CTC
21
. For more detail on our methodological
approach, see our full working paper.
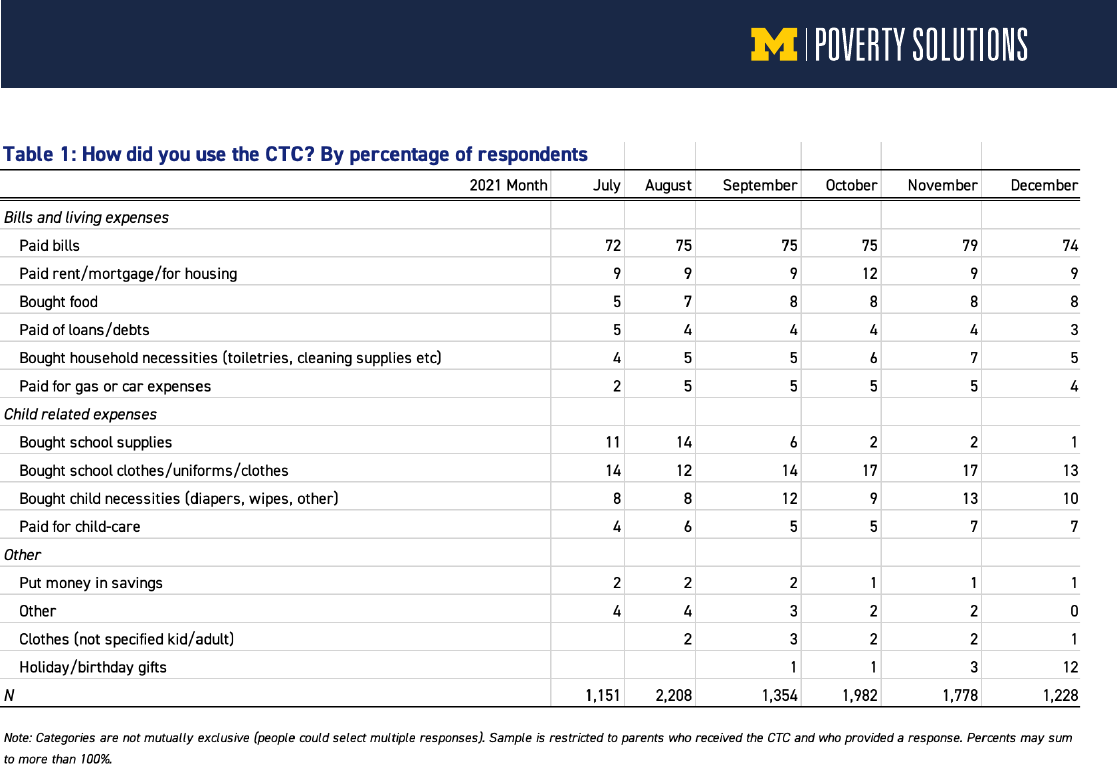
HOW DO FAMILIES REPORT SPENDING THE 2021
MONTHLY CTC?
We first present findings from an open-ended question that
asked respondents who received the 2021 monthly CTC how
they spent their credit. The results, in Table 1, indicate families
spent the money in ways that should improve their material
well-being and reduce hardships. The vast majority of families
(about 75%) reported using the money to “pay bills” in
every survey month. Families also used the money for
other basic necessities such as paying rent (9%) and
buying food (8%). Many parents used the money on child-
related expenses, buying school supplies (especially in
the late summer months) and children’s clothing. Thus, based on
these responses, we expect to find that the credit reduced material
hardships as well.
DID THE EXPANDED CTC IMPROVE ECONOMIC WELL
BEING?
In Figure 2, we show the results from our statistical model of the
effects of the 2021 monthly Child Tax Credit on material hardship
outcomes. We present the percent reduction in each outcome
based on a $500 monthly CTC, the average CTC amount received by
families in our study.
We find robust evidence that the CTC reduced the overall number
of material hardships experienced by families and children with low
incomes. Our statistical model indicates that a $500 monthly CTC
reduced the number of hardships experienced by families by nearly
17%. Similarly, we find robust evidence that the CTC cut reports of
food insecurity by almost one-third.
The evidence for reductions in medical hardships, being unable
to pay a full utility bill, and relying on friends and family for food
is somewhat less certain. Although the CTC appears to have
reduced the incidence of these hardships, these point estimates
were statistically significant in some models, but not all. Thus, we
interpret these findings as suggestive.
Note: * indicates findings are statistically significant and robust across models. + indicates
findings do not reach conventical levels of statistical significance in our most stringent test;
however, they are negatively signed and similar in size to the estimates with household size
fixed-effects, which do reach conventional levels of statistical significance. Thus we consider
these results as suggestive evidence. See the full paper for details on modeling approaches.
2
3
In addition to the material hardships shown in Figure 2, we also
examined the effects of the CTC on a number of additional hardship
and economic well-being measures and found no effects of the CTC
on these outcomes. We found no effect of the CTC on:
• Severe housing hardship (like eviction and homelessness)
• Whether families decided not to pay a bill
• Families’ ability to get to appointments, work, or somewhere else
• Whether families reported having “everything they typically need”
• The total money families had on hand
• The time that the money they had on hand would last
• Whether they borrowed money from friends and family
• Whether they visited a food pantry in the last month
It is perhaps surprising that we find no effects on these indicators
of material well-being. For some outcomes, like severe housing
hardship, it may be the case that the monthly benefit was not
sufficient to address this hardship. Many families in our study are
also in debt; thus, because the credit was relatively short-lived,
families may not have been able to get fully out of debt and back on
their feet with the six-month credit. It might also be surprising that
we find no impact of the monthly 2021 CTC on the total money that
families had on hand, but this could be explained by the fact that our
survey was conducted between two and four weeks after each of the
monthly payments was disbursed. Given the very low incomes of our
respondents and the fact that very few report saving their credit, it
is possible that most families had already spent down their credits
by the time of the survey.
DID THE 2021 MONTHLY CTC AFFECT EMPLOYMENT?
Policymakers and politicians have been concerned the 2021 monthly
CTC might reduce employment. Several studies have found no
effects of the CTC on employment
22, 23, 24, 25
and the results from our
study affirm those findings.
In Figure 3, we show the percentage point change in employment
because of a $500 monthly CTC. Here, unlike Figure 2, we show
percentage point change for consistency with other studies
26
and
none of the estimates shown here are statistically significant. The
point estimates suggest a possible shift from full-time employment
to part-time employment, but these findings are not robust across
model specifications. Thus, we conclude the 2021 CTC had little to no
effect on the employment of families with very low incomes.
DID THE EFFECTS OF 2021 MONTHLY CTC DIFFER BY
INCOME AND RACE/ETHNICITY?
We examined differences in the effects of the 2021 CTC by income,
comparing those with extremely low incomes (below $500 in
monthly earnings) to those with low incomes ($500 or greater in
monthly earnings). We did this because those at the very bottom are
very unlikely to have received the CTC in the past and because there
is evidence from other studies that cash transfers that represent
a larger proportion of household income have bigger effects
27, 28, 29
.
However, we find little to no evidence of differences in the effects by
household income.
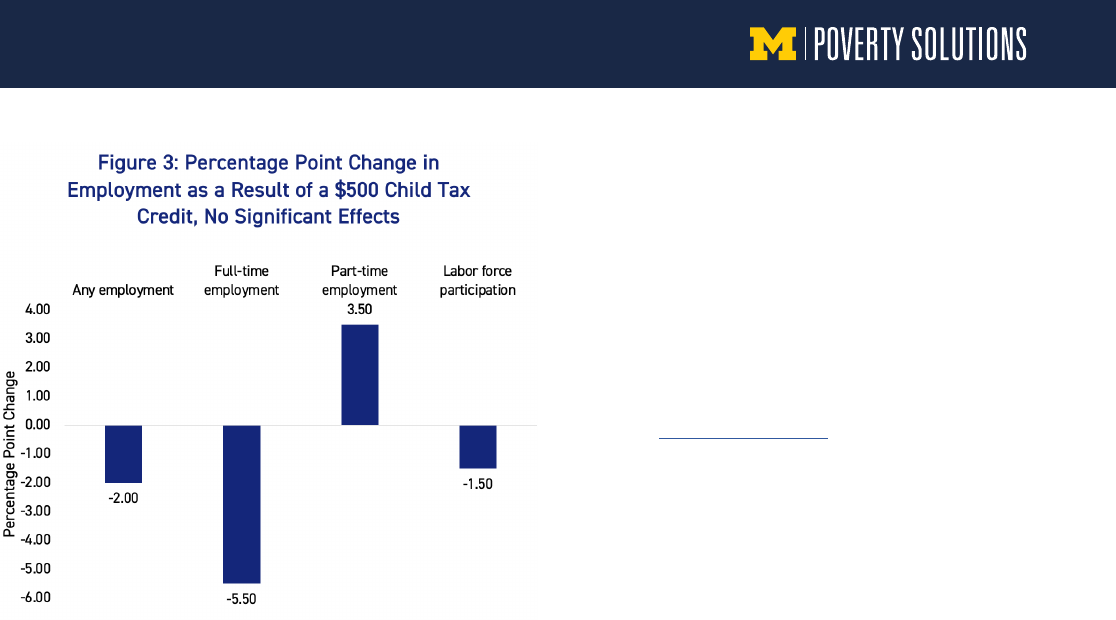
Note: We find no statistically significant effects of the monthly CTC on any labor
supply or employment outcomes.
We also studied differences in the effects of the CTC by race/
ethnicity as research suggests there are important intersections
between tax policy and racial inequality
30
. As a result of making
the credit fully refundable and removing the earnings minimum,
Hispanic and Black families were more likely to become newly
eligible or fully eligible for the CTC with the 2021 expansion
31,
32
. Thus, the 2021 CTC provided these families with new support
relative to White families, who have historically had higher eligibility
rates. We find some evidence that the 2021 CTC helped reduce
hardships among Black families more than White or Hispanic
families, but the differences were not large.
CONCLUSION
Our study focuses on a sample of families with very low incomes,
who were most likely to gain access to the CTC in 2021. We find that
families spent their monthly CTC on bills and expenses that should
improve their material well-being. We also find that the monthly
CTC reduced families’ overall number of material hardships and, in
particular, their food insecurity. These findings are in keeping with
other studies of the effects of the CTC on broader populations
33,
34
. Similarly, we find no evidence of an effect of the CTC on the
employment of families with low incomes, consistent with evidence
from other studies
35
. We also find suggestive evidence that the CTC
improved other measures of material well-being (reduced medical
hardships, inability to pay utility bills, and reliance on friends and
family for food).
The 2021 monthly CTC was short-lived. Thus, it is hard to know
what the effects of a longer-term, more stable credit would be.
Nonetheless, our research suggests the credit reduced material
hardship for families with very low incomes, which prior research
suggests should improve child and family well-being
36, 37
.
ABOUT THE AUTHORS
Natasha Pilkauskas and Katherine Michelmore are associate
professors of public policy at the Gerald R. Ford School of Public
Policy at the University of Michigan. H. Luke Shaefer is the faculty
director of Poverty Solutions, the Hermann and Amalie Kohn
Professor of Social Justice and Social Policy, and a professor of
public policy and social work at U-M.
The authors would like to acknowledge Propel for its partnership in
fielding the survey and sharing results for analysis. We would also
like to thank U-M Poverty Solutions associate Samiul Jubaed for
his assistance with the data cleaning as well as Nicole Kovski, who
co-authored the paper summarized in this brief. We also thank the
Washington Center for Equitable Growth and the Lynn and Charles
Schusterman Family Foundation for their generous support of our
research.
4

ENDNOTES
1 Duncan, G. J., & Brooks-Gunn, J. (Eds.). (1997). Consequences of growing up poor. Russell Sage Foundation.
2 Akee, R. K., Copeland, W. E., Keeler, G., Angold, A., & Costello, E. J. (2010). Parents’ incomes and children’s outcomes: A quasi-
experiment using transfer payments from casino profits. American Economic Journal: Applied Economics, 2(1), 86-115.
3 Troller-Renfree, S. V., Costanzo, M. A., Duncan, G. J., Magnuson, K., Gennetian, L. A., Yoshikawa, H., ... & Noble, K. G. (2022). The impact
of a poverty reduction intervention on infant brain activity. Proceedings of the National Academy of Sciences, 119(5), e2115649119.
4 Shaefer, H. L., & Gutierrez, I. A. (2013). The Supplemental Nutrition Assistance Program and material hardships among low-income
households with children. Social Service Review, 87(4), 753-779.
5 McKernan, S. M., Ratcliffe, C., & Braga, B. (2021). The effect of the US safety net on material hardship over two decades. Journal of
Public Economics, 197, 104403.
6 Schmidt, L., Shore-Sheppard, L., & Watson, T. (2016). The effect of safety-net programs on food insecurity. Journal of Human
Resources, 51(3), 589-614.
7 Kondratjeva, O., Roll, S. P., Despard, M., & GrinsteinWeiss, M. (2021). The impact of state earned income tax credit increases on
material and medical hardship. Journal of Consumer Affairs, 55(3), 872-910.
8 Kondratjeva, O., Roll, S. P., Despard, M., & Grinstein-Weiss, M. (2022). The Impact of Tax Refund Delays on the Experience of Hardship
Among Lower-Income Households. Journal of Consumer Policy, 1-42.
9 Pilkauskas, N., & Michelmore, K. (2019). The effect of the earned income tax credit on housing and living arrangements. Demography,
56(4), 1303-1326.
10 Gennetian, L., Duncan, G., Fox, N., Magnuson, K., Halpern-Meekin, S., Noble, K., & Yoshikawa, H. (2022). Unconditional cash and family
investments in infants: Evidence from a large-scale cash transfer experiment in the U.S. NBER Working Paper No. 30379.
11 Jaroszewicz, A., Jachimowicz, J., Hauser, O., & Jamison, J. (2022). How Effective Is (More) Money? Randomizing Unconditional Cash
Transfer Amounts in the US. Randomizing Unconditional Cash Transfer Amounts in the US (July 5, 2022).
12 Jacob, B., Pilkauskas, N., Rhodes, E., Richard, K., & Shaefer, H. L. (2022). The COVID-19 cash transfer study II: The hardship and mental
health impacts of an unconditional cash transfer to low-income individuals. National Tax Journal, 75(3), 000-000.
13 Pilkauskas, N.V., Jacob, B.A., Rhodes, E., Richard, K. and Shaefer, H.L. (2022). The COVID cash transfer study: The impacts of an
unconditional cash transfer on the wellbeing of low-income families. Poverty Solutions Working Paper.
14 Hamilton, L., Roll, S., Despard, M. , Maag, E., Chun, Y., Brugger, L., Grinstein-Weiss, M. (2022). The impacts of the 2021 expanded child
tax credit on family employment, nutrition and financial well-being: Findings from the Social Policy Institute’s Child Tax Credit Panel
Survey. Brookings Global Working Paper #173.
15 Karpman, M., Maag, E., Zuckerman, S. & Wissoker, D. (2022) Child Tax Credit recipients experienced a larger decline in food insecurity
and a similar change in employment as nonrecipients between 2020 and 2021.Tax Policy Center. Urban Institute and Brookings
Institution.
16 Parolin, Z., Ananat, E., Collyer, S., Curran, M, & Wimer, C. (2021). “The Initial Effects of the Expanded Child Tax Credit on Material
Hardship,” Columbia University Center on Poverty and Social Policy, Poverty and Social Policy Working Paper.
17 Goldin, J. and Michelmore, K. (2020). Who Benefits From the Child Tax Credit? (No. w27940). National Bureau of Economic Research.
18 We use a parameterized difference-in-differences model and present estimates from models that include a number of chil-dren fixed
effect. This approach allows us to compare households with the same number of children before and after the ex-pansion; however,
because the CTC is determined by the number of children in the household, it is a very stringent test (only leaving variation in the
household composition in the age of the children). In the paper, we also estimate models including number of household members
fixed effects as household size more generally is both correlated with the CTC and the out-comes but is a slightly less stringent test of
the relationship.
19 Pilkauskas, N.V. & Cooney, P, (2021). Receipt and usage of the Child Tax Credit payments among low-income families.
5

20 Pilkauskas, N.V. & Michelmore, K. (2021) Families with low incomes and the Child Tax Credit: Who is still missing out?
21 These are estimates that instrument for amount of the CTC received by families. They can be considered treatment on the treated or
local average treatment effects.
22 Ananat, E., Glasner, B., Hamilton, C., & Parolin, Z. (2022). Effects of the Expanded Child Tax Credit on Employment Outcomes: Evidence
from Real-World Data from April to December 2021 (No. w29823). National Bureau of Economic Research.
23 Lourie, B., Shanthikumar, D. M., Shevlin, T. J., & Zhu, C. (2021). Effects of the 2021 Expanded Child Tax Credit. Available at SSRN.
24 Hamilton et al., 2022.
25 Karpman et al., 2022.
26 Ananat et al., 2022.
27 Haushofer, J., Chemin, M., Jang, C., & Abraham, J. (2020). Economic and psychological effects of health insurance and cash transfers:
Evidence from a randomized experiment in Kenya. Journal of Development Economics, 144, 102416.
28 Haushofer, J., & Shapiro, J. (2016). The short-term impact of unconditional cash transfers to the poor: experimental evidence from
Kenya. The Quarterly Journal of Economics, 131(4), 1973-2042.
29 Pilkauskas et al., 2022.
30 Brown, D. A. (2021). The whiteness of wealth: How the tax system impoverishes Black Americans--and how we can fix it. Crown
Publishing Group, New York.
31 Goldin and Michelmore, 2021.
32 Collyer, S., Wimer, C., & Harris, D. (2019). ). Left behind: The one-third of children in families who earn too little to get the full Child Tax
Credit. Poverty & Social Policy Brief, 3(6) New York, NY: Columbia University Center on Poverty and Social Policy.
33 Parolin et al., 2021.
34 Hamilton et al., 2022.
35 Ananat, E., Glasner, B., Hamilton, C., & Parolin, Z. (2021). Effects of the Expanded Child Tax Credit on Employment Outcomes: Evidence
from Real-World Data from April to September 2021. Poverty and Social Policy Discussion Paper.
36 Zilanawala, A., & Pilkauskas, N. V. (2012). Material hardship and child socioemotional behaviors: Differences by types of hardship,
timing, and duration. Children and Youth Services Review, 34(4), 814-825.
37 Thomas, M. (2022). Longitudinal patterns of material hardship among US families. Social Indicators Research, 1-30.
6
